本文主要是介绍3D目标检测跟踪 | 基于kitti+waymo数据集的自动驾驶场景的3D目标检测+跟踪渲染可视化,希望对大家解决编程问题提供一定的参考价值,需要的开发者们随着小编来一起学习吧!
- 项目应用场景
-
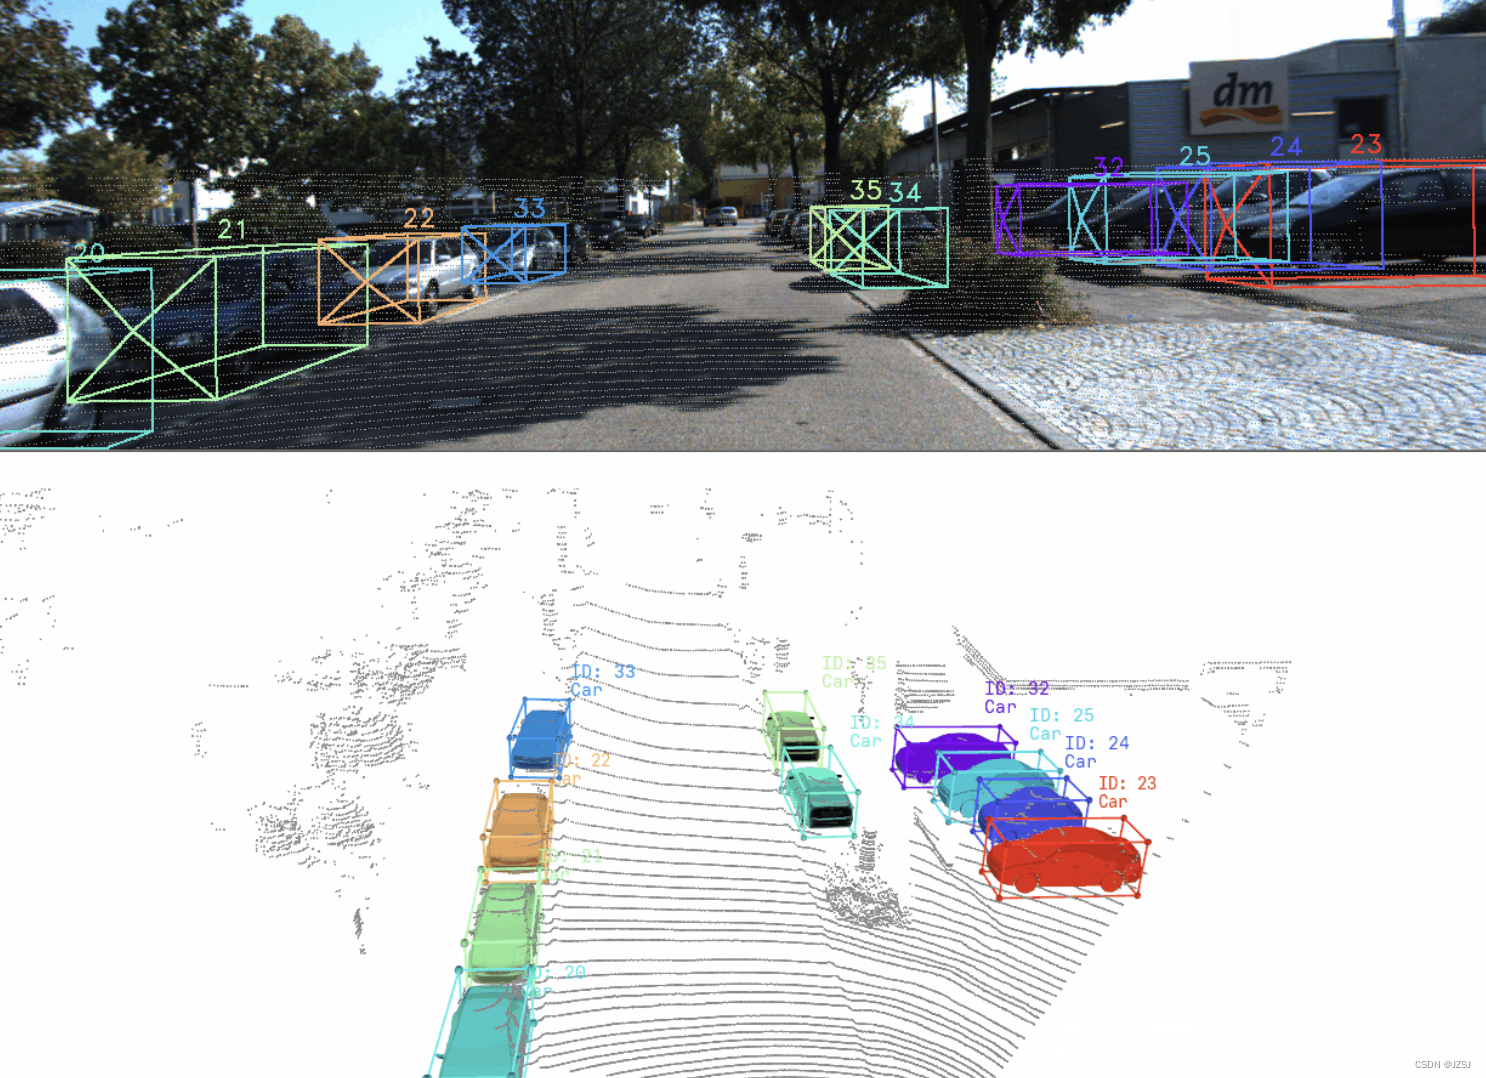
- 面向自动驾驶场景的 3D 目标检测+目标跟踪,基于kitti+waymo数据集的自动驾驶场景的3D目标检测+跟踪渲染可视化查看。
- 项目效果


- 项目细节 ==> 具体参见项目
README.md
-
- (1) Kitti detection 数据集结构
# For Kitti Detection Dataset
└── kitti_detection├── testing | ├──calib| ├──image_2| ├──label_2| └──velodyne └── training├──calib├──image_2├──label_2└──velodyne -
- (2) Kitti tracking 数据集结构
# For Kitti Tracking Dataset
└── kitti_tracking├── testing | ├──calib| | ├──0000.txt| | ├──....txt| | └──0028.txt| ├──image_02| | ├──0000| | ├──....| | └──0028| ├──label_02| | ├──0000.txt| | ├──....txt| | └──0028.txt| └──velodyne| ├──0000| ├──....| └──0028 └── training # the structure is same as testing set├──calib├──image_02├──label_02└──velodyne -
- (3) 安装依赖
pip install python3 \numpy==1.21.3 \vedo==2021.0.6 \vtk==9.0.3 \opencv==4.5.4.58 \matplotlib==3.4.3-
- (4) 执行示例
from viewer.viewer import Viewer
import numpy as npvi = Viewer() # set box_type='OpenPCDet' if you use OpenPCDet boxes
len_dataset = 1000for i in range(len_dataset):pseudo_boxes = np.array([[i*0.05, -1, 1, 1, 1, 1, 0], [i*0.05, 1, 1, 1, 1, 1, 0]]) # your boxesids = np.array([0,1]) # your boxes ids (optional)pseudo_points = np.random.randn(100, 3) # your pointsvi.add_points(pseudo_points, radius=4, scatter_filed=pseudo_points[:, 0])vi.add_3D_boxes(pseudo_boxes, ids=ids,caption_size=(0.09,0.09))vi.add_spheres(pseudo_boxes[:, 0:3],radius=0.03,res=10,color='red',del_after_show=False, alpha=1) # Draw motion trackvi.show_3D() # press the Q or Enter or ESC key to view- 项目获取
-
- https://download.csdn.net/download/weixin_42405819/89093750
这篇关于3D目标检测跟踪 | 基于kitti+waymo数据集的自动驾驶场景的3D目标检测+跟踪渲染可视化的文章就介绍到这儿,希望我们推荐的文章对编程师们有所帮助!


