本文主要是介绍文献速递:生成对抗网络医学影像中的应用——用于生成前列腺MR-only影像治疗剂量规划的合成CT的深度学习模型:多中心研究,希望对大家解决编程问题提供一定的参考价值,需要的开发者们随着小编来一起学习吧!
文献速递:生成对抗网络医学影像中的应用——用于生成前列腺MR-only影像治疗剂量规划的合成CT的深度学习模型:多中心研究
本周给大家分享文献的主题是生成对抗网络(Generative adversarial networks, GANs)在医学影像中的应用。文献的研究内容包括同模态影像生成、跨模态影像生成、GAN在分类和分割方面的应用等。生成对抗网络与其他方法相比展示出了优越的数据生成能力,使它们在医学图像应用中广受欢迎。这些特性引起了医学成像领域研究人员的浓厚兴趣,导致这些技术在各种传统和新颖应用中迅速实施,如图像重建、分割、检测、分类和跨模态合成。
01
文献速递介绍
For radiotherapy based solely on magnetic resonance imaging (MRI), generating synthetic computed tomography scans (sCT) from MRI is essential for dose calculation. The use of deep learning (DL) methods to generate sCT from MRI has shown encouraging results if the MRI images used for training the deep learning network and the MRI images for sCT generation come from the same MRI device. The objective of this study was to create and evaluate a generic DL model capable of generating sCTs from various MRI devices for prostate radiotherapy
对于仅基于磁共振成像(MRI)进行影像治疗,从MRI生成合成计算机断层扫描(sCT)对于剂量计算至关重要。如果用于训练深度学习网络的MRI图像和用于生成sCT的MRI图像来自同一台MRI设备,那么使用深度学习(DL)方法生成sCT已经显示出令人鼓舞的结果。本研究的目标是创建并评估一个通用的DL模型,能够从不同MRI设备中生成前列腺影像治疗的sCT图像。
Title
题目
A deep learning model to generate synthetic CT for prostate MR-only radiotherapy dose planning: a multicenter study
用于生成前列腺MR-only影像治疗剂量规划的合成CT的深度学习模型:多中心研究
Methods
方法
In total, 90 patients from three centers (30 CT-MR
prostate pairs/center) underwent treatment using volumetric modulated arc therapy for prostate cancer (PCa) (60 Gy in 20 fractions). T2 MRI images were acquired in addition to computed tomography (CT) images for treatment planning. The DL model was a 2D supervised conditional generative adversarial network (Pix2Pix). Patient images underwent preprocessing steps, including nonrigid registration. Seven different supervised models were trained, incorporating patients from one, two, or three centers. Each model was
trained on 24 CT-MR prostate pairs. A generic model was trained using patients from all three centers. To compare sCT and CT, the mean absolute**error in Hounsfield units was calculated for the entire pelvis, prostate, bladder, rectum, and bones. For dose analysis, mean dose differences of D99% for CTV, V95% for PTV, Dmax for rectum and bladder, and 3D gamma analysis (local, 1%/1mm) were calculated from CT and sCT. Furthermore, Wilcoxon tests were
performed to compare the image and dose results obtained with the generic model to those with the other trained models.
总共有90名患者来自三个中心(每个中心30对CT-MR前列腺图像对),接受了体积调制弧放射疗法治疗前列腺癌(60 Gy,分20次)。除了用于治疗规划的计算机断层扫描(CT)图像外,还获取了T2磁共振成像(MRI)图像。深度学习模型是一个2D监督条件生成对抗网络(Pix2Pix)。患者图像经过预处理步骤,包括非刚性配准。共训练了七个不同的监督模型,包括来自一个、两个或三个中心的患者。每个模型都是在24对CT-MR前列腺图像上进行训练的。使用来自所有三个中心的患者进行了通用模型的训练。为了比较sCT和CT,计算了在Hounsfield单位中的整个骨盆、前列腺、膀胱、直肠和骨骼的平均绝对误差。对于剂量分析,从CT和sCT计算了CTV的D99%的平均剂量差异,PTV的V95%,直肠和膀胱的Dmax,以及3D伽马分析(局部,1%/1mm)。此外,进行了Wilcoxon检验,以比较通用模型与其他训练模型获得的图像和剂量结果
Results
结果
Considering the image results for the entire pelvis, when the data used for the test comes from the same center as the data used for training, the results were not significantly different from the generic model. Absolute dose differences were less than 1 Gy for the CTV D99% for every trained model and center. The gamma analysis results showed nonsignificant differences between the generic and monocentric models.
考虑整个骨盆的图像结果,当用于测试的数据来自与用于训练的数据相同的中心时,结果与通用模型的结果没有显著差异。对于每个训练模型和中心,CTV D99%的绝对剂量差异均小于1 Gy。伽马分析结果显示通用模型与单中心模型之间没有显著差异。
**Conclusions
结论
The accuracy of sCT, in terms of image and dose, is equivalent to whether MRI images are generated using the generic model or the monocentric**model.
The generic model, using only eight MRI-CT pairs per center, offers robust sCT generation, facilitating PCa MRI-only radiotherapy for routine clinicaluse.
在图像和剂量方面,sCT的准确性与MRI图像是使用通用模型还是单中心模型生成的相等。通用模型仅使用每个中心的八对MRI-CT图像对进行训练,提供了强大的sCT生成能力,有助于实现前列腺癌MRI-only影像治疗的常规临床应用。
Figure
图
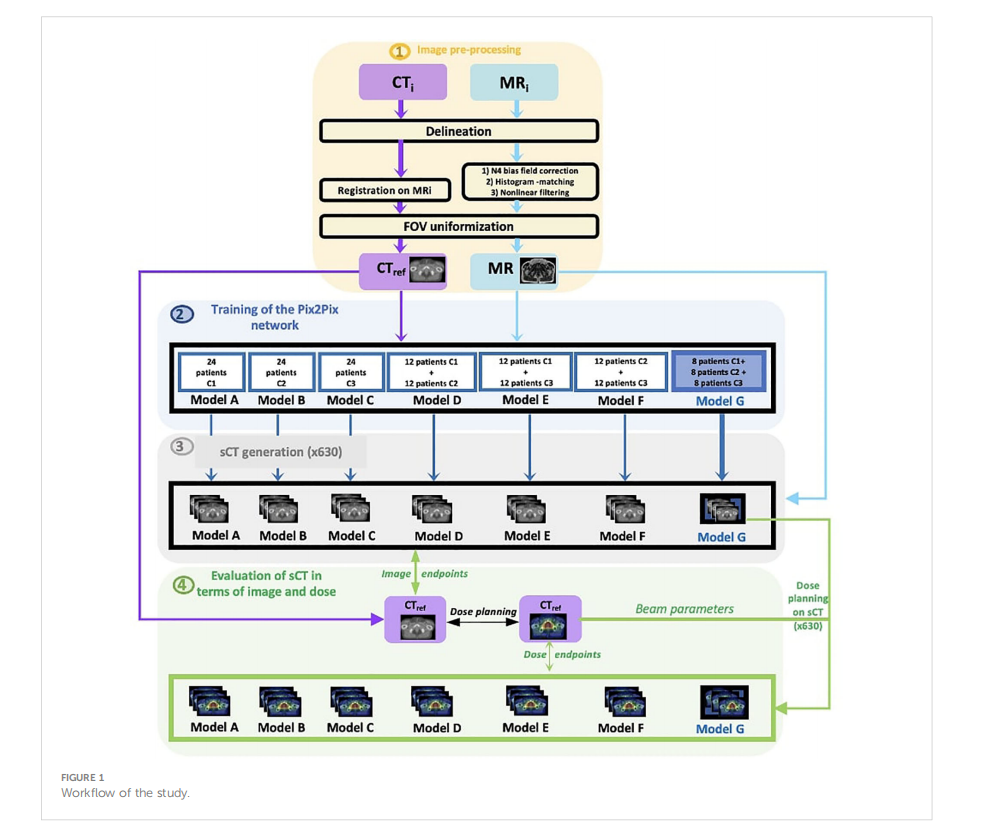
FIGURE 1 Workflow of the study
图1研究流程图
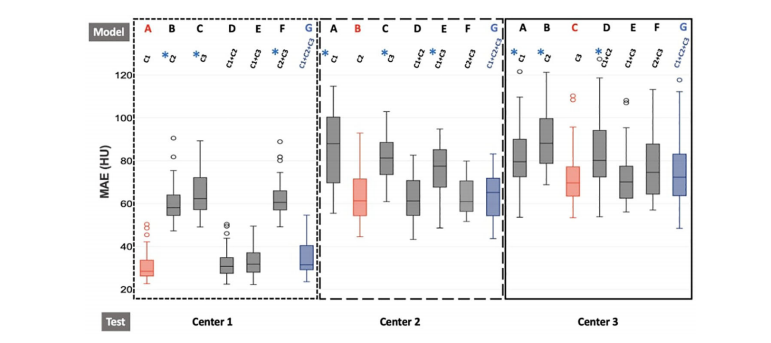
FIGURE 2 Boxplot of MAE results for the different training models for each test center for the entire pelvis. The dotted line represents the results for center 1,the larger dotted line for center 2, and the solid line for center 3. Furthermore, red boxes indicate the monocentric models (model A/test C1, modelB/test C2, model C/test C3), and blue boxes represent the generic model (model G/test C1 or C2 or C3). For each center, the seven models A, B, C,D, E, F, and G are trained with C1, C2, C3, C1+C2, C1+C3, C2+C3, and C1+C2+C3, respectively. The generic model (G) is our reference model.Wilcoxon tests were used to compare the generic model to the other models. *p-value< 0.05, significantdifferences.
图2整个骨盆的不同训练模型的MAE结果箱线图,每个测试中心的结果都有所不同。虚线代表中心1的结果,较大的虚线代表中心2,实线代表中心3。此外,红色框表示单中心模型(模型A/测试C1,模型B/测试C2,模型C/测试C3),蓝色框表示通用模型(模型G/测试C1或C2或C3)。对于每个中心,分别使用C1、C2、C3、C1+C2、C1+C3、C2+C3和C1+C2+C3进行训练的七个模型A、B、C、D、E、F和G。通用模型(G)是我们的参考模型。使用Wilcoxon检验比较通用模型与其他模型。 p值<0.05,表示显著差异。
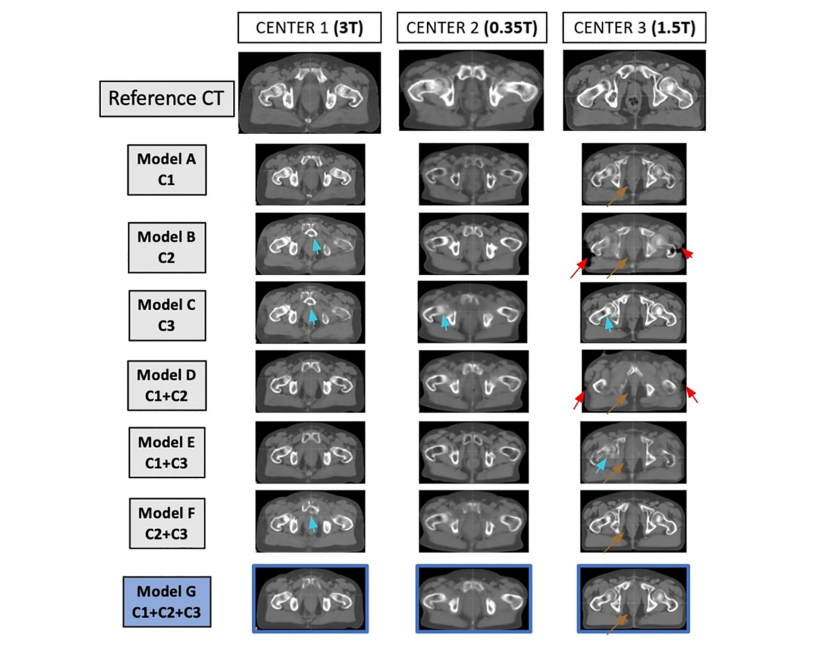
FIGURE 3Matched reference CT and synthetic CT (sCT) for each model, for one patient at each center. On the first line, from left to right, the reference CTsof one patient from center 1, one patient from center 2, and one patient from center 3 are represented. For each patient in each center, the sCTgenerated with each model is represented. The sCT images of each model represent the same slice as the reference CT. Arrows show limitations ofthe sCT generation (red arrow for misgeneration of the external contour, brown arrow for misgeneration of air pockets, blue arrows formisgeneration of bones).
图3对于每个模型,每个中心的一个患者的匹配参考CT和合成CT(sCT)。在第一行,从左到右,表示了来自中心1的一个患者、中心2的一个患者和中心3的一个患者的参考CT。对于每个中心的每个患者,都表示了使用每个模型生成的sCT。每个模型的sCT图像代表与参考CT相同的切片。箭头显示了sCT生成的局限性(红色箭头表示外部轮廓的错误生成,棕色箭头表示气囊错误生成,蓝色箭头表示骨骼错误生成)。
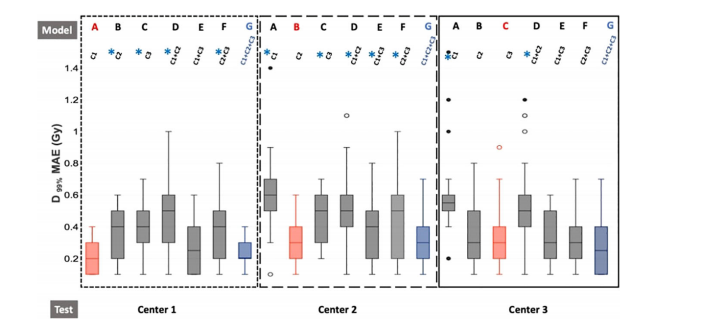
FIGURE 4Boxplot of dose absolute errors for D99% of the CTV. The dotted line represents the results for center 1, the larger dotted line for center 2, and thesolid line for center 3. Furthermore, red boxes indicate the monocentric models (model A/test C1, model B/test C2, model C/test C3), and blueboxes represent the generic model (model G/test C1 or C2 or C3). For each center, the seven models A, B, C, D, E, F, and G are trained with C1, C2,C3, C1+C2, C1+C3, C2+C3, and C1+C2+C3, respectively. The generic model (G) is our reference model. Wilcoxon tests were used to compare thegeneric model to the other models. *p-value< 0.05, significant differences.
图4 *CTV D99%的剂量绝对误差箱线图。虚线代表中心1的结果,较大的虚线代表中心2,实线代表中心3。此外,红色框表示单中心模型(模型A/测试C1,模型B/测试C2,模型C/测试C3),蓝色框表示通用模型(模型G/测试C1或C2或C3)。对于每个中心,分别使用C1、C2、C3、C1+C2、C1+C3、C2+C3和C1+C2+C3进行训练的七个模型A、B、C、D、E、F和G。通用模型(G)是我们的参考模型。使用Wilcoxon检验比较通用模型与其他模型。 p值<0.05,表示显著差异。
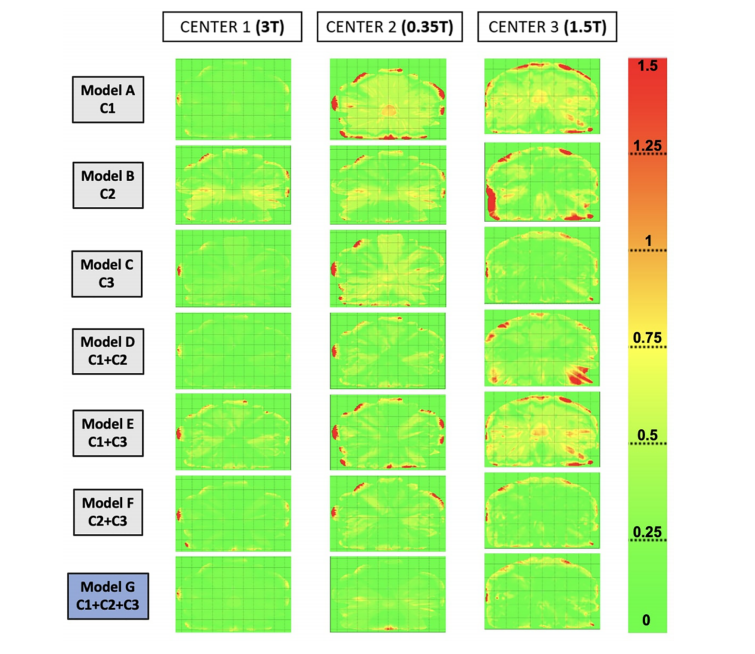
FIGURE 5 Gamma maps were obtained by comparing the dose distribution on reference CT to the dose distribution on synthetic CT (sCT) for each model, for one patient of each center. The selected patients are the same as Figure 3. The gamma criteria are local, 1%/1 mm, and 10% dose threshold.center 2. For center 3, the gamma pass-rate values were significantly higher for model C (trained with C3), model F (trained with C2 +C3), and the generic model (G). Furthermore, for all the centers, thegeneric model did not show significantly lower results than the other models from the same center.
图5通过比较参考CT上的剂量分布与合成CT(sCT)上的剂量分布,获得了伽马图,每个模型中的一个患者代表了每个中心的一个患者,所选的患者与图3相同。伽马标准是局部,1%/1 mm,10%剂量阈值。对于中心2,模型C(使用C3进行训练)、模型F(使用C2 + C3进行训练)和通用模型(G)的伽马通过率值显著较高。此外,对于所有中心,通用模型的结果与来自同一中心的其他模型没有显著差异。
Table
表
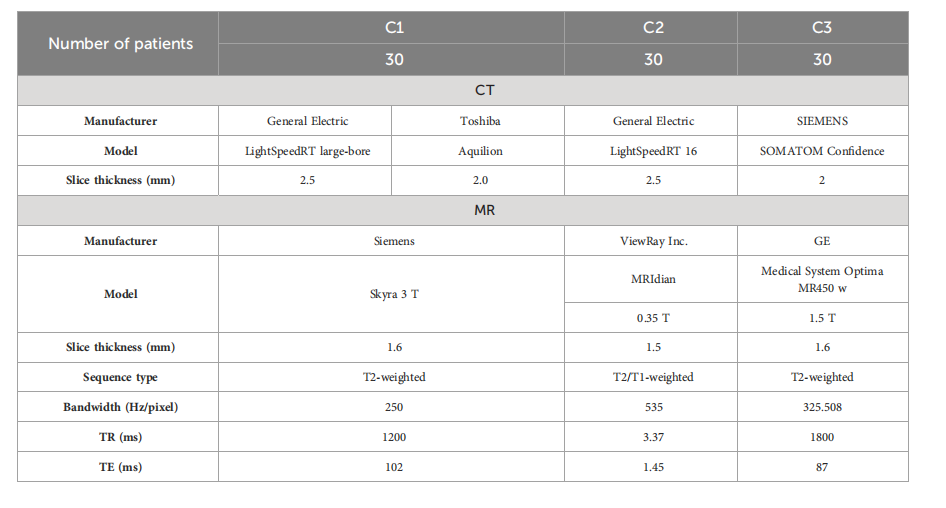
TABLE 1 Acquisition parameters of the modalities (CT and MR) for the three centers (C1, C2, and C3).
表1三个中心(C1、C2和C3)的模态(CT和MR)获取参数。
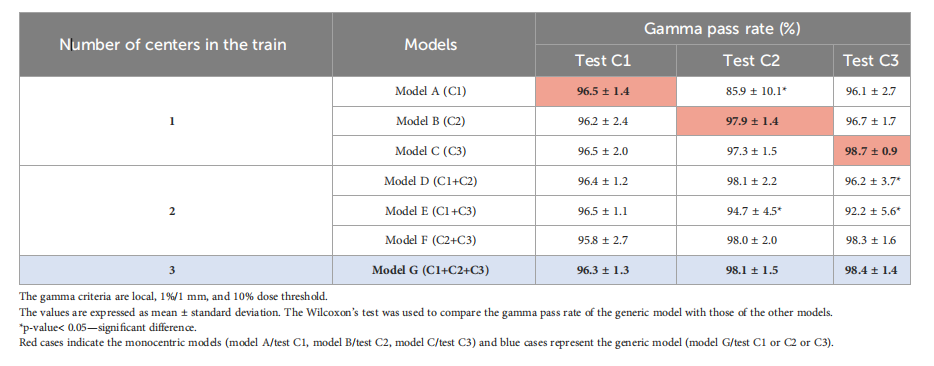
TABLE 2 Gamma pass-rate values comparing the dose distribution on reference CT with the dose distribution on sCTs.
表2Gamma通过率值,比较参考CT上的剂量分布与sCT上的剂量分布。
这篇关于文献速递:生成对抗网络医学影像中的应用——用于生成前列腺MR-only影像治疗剂量规划的合成CT的深度学习模型:多中心研究的文章就介绍到这儿,希望我们推荐的文章对编程师们有所帮助!


