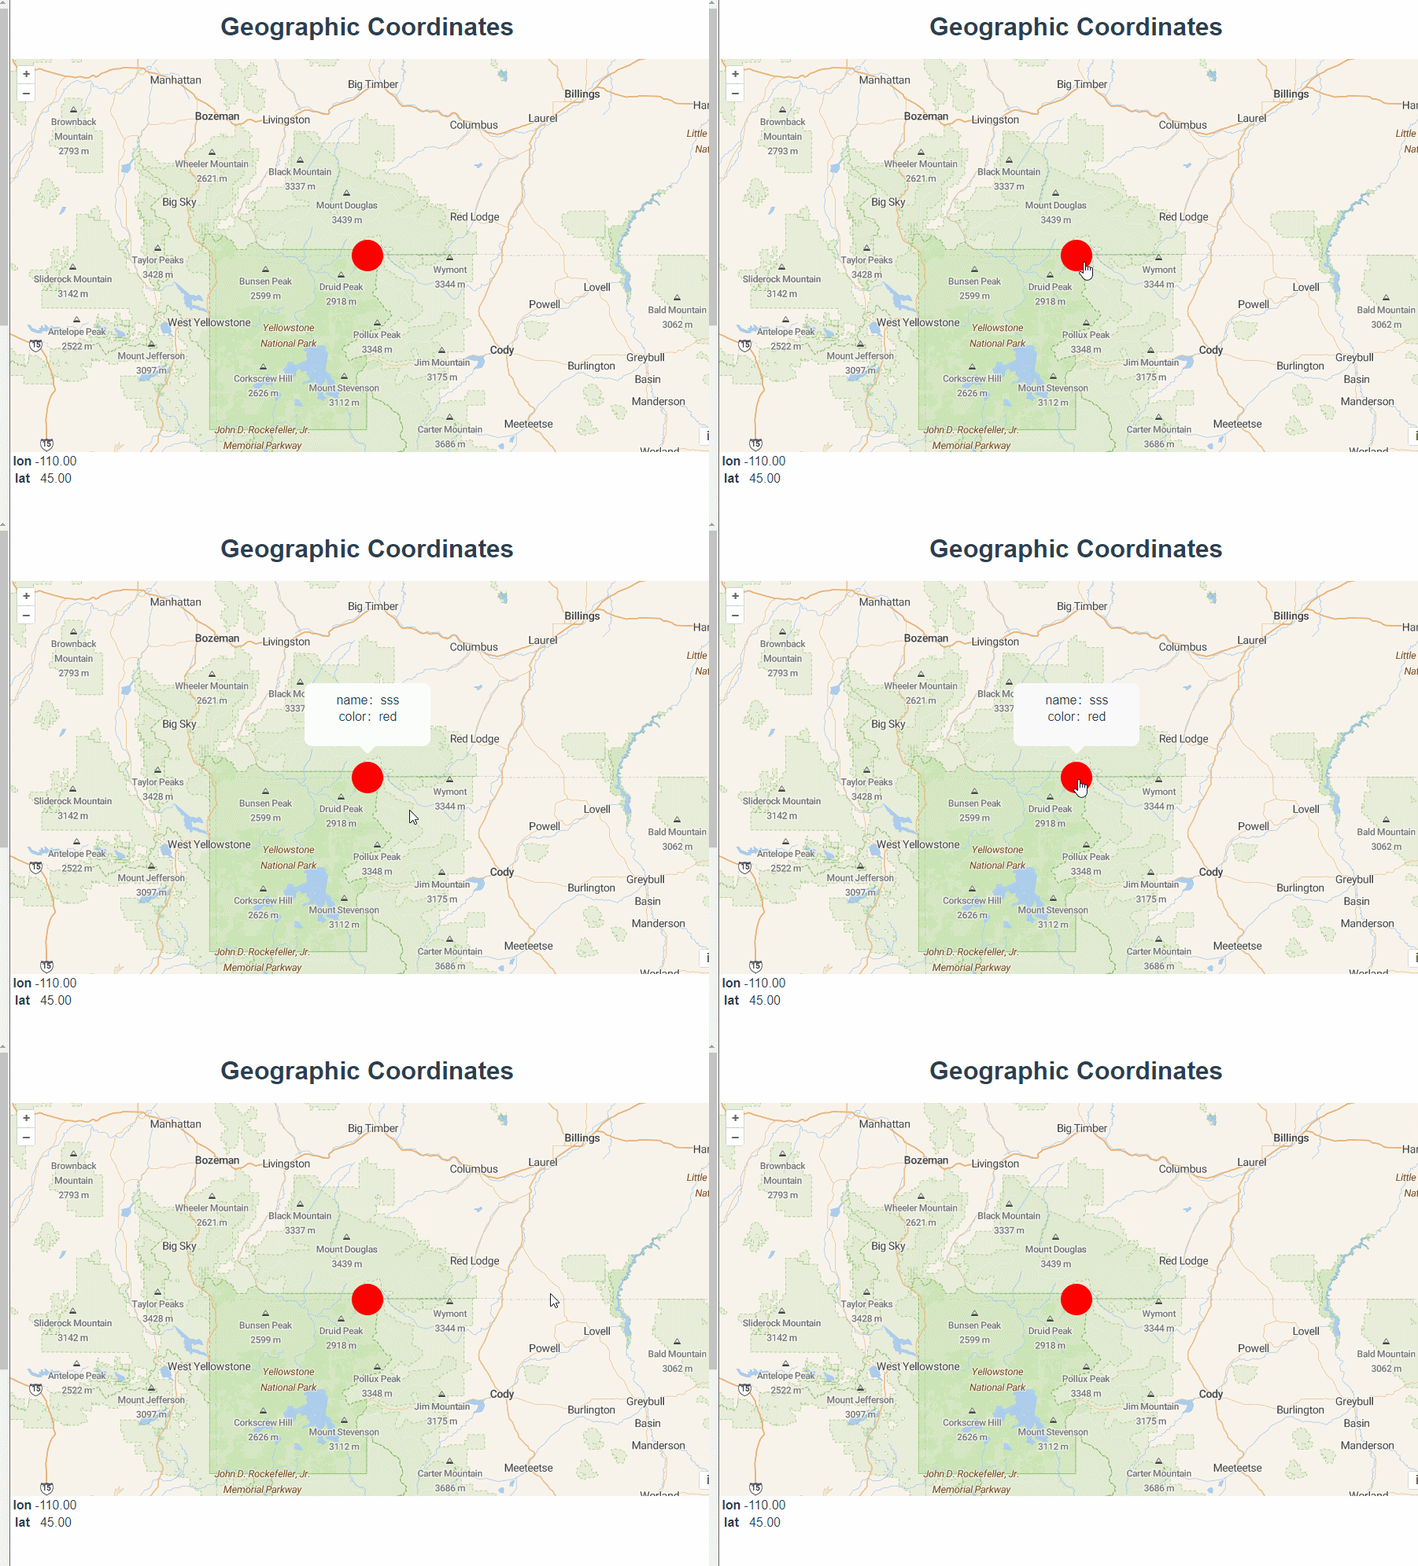
本文主要是介绍四十四、openlayers官网示例Geographic Coordinates解析——在地图上添加弹窗,点击显示图形信息,希望对大家解决编程问题提供一定的参考价值,需要的开发者们随着小编来一起学习吧!

使用Overlay在地图上添加弹窗,点击控制显隐。
初始化图层的时候,添加一个矢量的点数据到地图上,在new Feature时添加一些自定义属性。
const place = [-110, 45];const point = new Point(place);const map = new Map({target: "map",view: new View({center: place,zoom: 8,}),layers: [new TileLayer({source: new StadiaMaps({layer: "outdoors",}),}),new VectorLayer({source: new VectorSource({features: [new Feature({ geometry: point, name: "sss", color: "red" }),],}),style: {"circle-radius": 20,"circle-fill-color": "red",},}),],});写一个元素,用来展示信息。
<div id="map" class="map"><div id="popup"><div>name:{{ message.name }}</div><div>color:{{ message.color }}</div><div class="triangle"></div></div></div>添加一些样式。
#popup {width: 160px;height: 80px;border-radius: 10px;background: #fff;position: absolute;padding: 10px;box-sizing: border-box;
}
.triangle {position: absolute;left: 50%;transform: translateX(-50%);bottom: -20px;border-top: 10px solid #fff;border-bottom: 10px solid transparent;border-left: 10px solid transparent;border-right: 10px solid transparent;
}
创建overlay实例 ,offset是偏移量,根据写的元素大小调节。
const element = document.getElementById("popup");const popup = new Overlay({element: element,stopEvent: false,offset:[-80,-120],});map.addOverlay(popup);
点击地图的时候,获取图形的信息并给 this.message赋值。
map.on("click", (event) => {if (popover) {popover.dispose();popover = undefined;}const feature = map.getFeaturesAtPixel(event.pixel)[0];if (!feature) {popup.setPosition(undefined);return;}const coordinate = feature.getGeometry().getCoordinates();popup.setPosition(coordinate);this.message.name = feature.get("name");this.message.color = feature.get("color");});完整代码:
<template><div class="box"><h1>Geographic Coordinates</h1><div id="map" class="map"><div id="popup"><div>name:{{ message.name }}</div><div>color:{{ message.color }}</div><div class="triangle"></div></div></div><div id="info"></div></div>
</template><script>
import { Feature, Map, Overlay, View } from "ol/index.js";
import { OSM, Vector as VectorSource } from "ol/source.js";
import { Point } from "ol/geom.js";
import { Tile as TileLayer, Vector as VectorLayer } from "ol/layer.js";
import { useGeographic } from "ol/proj.js";
import StadiaMaps from "ol/source/StadiaMaps.js";
export default {name: "",components: {},data() {return {map: null,extentData: "",message: {name: "",color: "",},};},computed: {},created() {},mounted() {useGeographic();const place = [-110, 45];const point = new Point(place);const map = new Map({target: "map",view: new View({center: place,zoom: 8,}),layers: [new TileLayer({source: new StadiaMaps({layer: "outdoors",}),}),new VectorLayer({source: new VectorSource({features: [new Feature({ geometry: point, name: "sss", color: "red" }),],}),style: {"circle-radius": 20,"circle-fill-color": "red",},}),],});const element = document.getElementById("popup");const popup = new Overlay({element: element,stopEvent: false,offset:[-80,-120],});map.addOverlay(popup);function formatCoordinate(coordinate) {return `<table><tbody><tr><th>lon</th><td>${coordinate[0].toFixed(2)}</td></tr><tr><th>lat</th><td>${coordinate[1].toFixed(2)}</td></tr></tbody></table>`;}const info = document.getElementById("info");map.on("moveend", function () {const view = map.getView();const center = view.getCenter();info.innerHTML = formatCoordinate(center);});let popover;map.on("click", (event) => {if (popover) {popover.dispose();popover = undefined;}const feature = map.getFeaturesAtPixel(event.pixel)[0];if (!feature) {popup.setPosition(undefined);return;}const coordinate = feature.getGeometry().getCoordinates();popup.setPosition(coordinate);this.message.name = feature.get("name");this.message.color = feature.get("color");});map.on("pointermove", function (event) {const type = map.hasFeatureAtPixel(event.pixel) ? "pointer" : "inherit";map.getViewport().style.cursor = type;});},methods: {},
};
</script><style lang="scss" scoped>
#map {width: 100%;height: 500px;
}
.box {height: 100%;
}
#popup {width: 160px;height: 80px;border-radius: 10px;background: #fff;position: absolute;padding: 10px;box-sizing: border-box;
}
.triangle {position: absolute;left: 50%;transform: translateX(-50%);bottom: -20px;border-top: 10px solid #fff;border-bottom: 10px solid transparent;border-left: 10px solid transparent;border-right: 10px solid transparent;
}
</style>
这篇关于四十四、openlayers官网示例Geographic Coordinates解析——在地图上添加弹窗,点击显示图形信息的文章就介绍到这儿,希望我们推荐的文章对编程师们有所帮助!


