本文主要是介绍《数据分析与挖掘 第十四章 基于基站定位数据的商圈分析》,希望对大家解决编程问题提供一定的参考价值,需要的开发者们随着小编来一起学习吧!
基于基站定位数据的商圈分析
数据抽取
以2014-1-1开始到2014-6-30结束时间作为分析窗口
数据分析
以55555这个人为例,判断其活动位置,基站号改变,说明其进入下一个区域,分析出2014-1-1下午零时53分进入36902基站,直到二时13分才进入36907基站,说明他在36902基站呆了80分钟
数据预处理
首先,去掉无用的属性,例如什么信令类型,LOC编号这些的,只留下日期,时间,基站号,EMASI号这四个属性
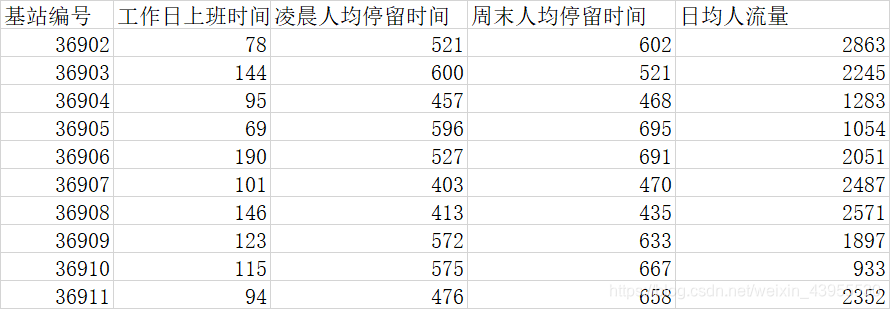
清楚地分出哪些人,在什么时间段,在那些基站,然后计算出:每个基站圈的 ,工作日上班时间人均停留时间,凌晨人均停留时间,周末人均停留时间,日军停留时间
得到数据:

因为这里我们要将商圈分类,也就是把这些基站分类出来,看哪些是有共同的以上四个属性的,比如说:哪些基站的位置是属于人均流量很多的,就值得关注,哪些基站的位置是属于周末人均停留时间很长的,那么这样的地方可能就是娱乐活动的地方,哪些基站的位置是属于工作日人均停留时间最长的,那么这里很可能就是办公楼什么的
我们采用聚类算法分类
聚类算法之前,为了使各个属性的差异值不受数量级影响,需要对数据进行标准化:
import pandas as pdfilename = 'D:\\python\\workspace\\shujufenxi\\chapter14\\chapter14\\demo\\data\\business_circle.xls' #原始数据文件
standardizedfile = 'D:\\python\\workspace\\shujufenxi\\chapter14\\chapter14\\demo\\data\\standardized.xls' #标准化后数据保存路径data = pd.read_excel(filename,index_col = u'基站编号') #读取数据data = (data - data.min())/(data.max() - data.min()) #离差标准化
这里我们先将基站编号拿出来当index,不然后面的步骤会把基站编号也标准化成小数:

把基站编号拿出来之后标准化:

然后
data = data.reset_index()ata.to_excel(standardizedfile, index = False) #保存结果,保存的表格里不出现前面的index从0开始的那串数字

这样达到了,基站编号不做标准化的目的
模型构建
首先我们要知道聚类算法,我们应该分为多少个类,k等于多少最好,这里用谱系聚类图分析看分多少个类:
#谱系聚类图
import pandas as pd#参数初始化
standardizedfile = 'D:\\python\\workspace\\shujufenxi\\chapter14\\chapter14\\demo\\data\\standardized.xls' #标准化后的数据文件
data = pd.read_excel(standardizedfile, index_col = u'基站编号') #读取数据import matplotlib.pyplot as plt
from scipy.cluster.hierarchy import linkage,dendrogram
#这里使用scipy的层次聚类函数Z = linkage(data, method = 'ward', metric = 'euclidean') #谱系聚类图
P = dendrogram(Z, 0) #画谱系聚类图
plt.show()

可以看出来,最好把聚类分成三个类,即k = 3
接下来进行聚类算法:
#层次聚类算法
import pandas as pd#参数初始化
standardizedfile = 'D:\\python\\workspace\\shujufenxi\\chapter14\\chapter14\\demo\\data\\standardized.xls' #标准化后的数据文件
k = 3 #聚类数
data = pd.read_excel(standardizedfile, index_col = u'基站编号') #读取数据from sklearn.cluster import AgglomerativeClustering #导入sklearn的层次聚类函数
model = AgglomerativeClustering(n_clusters = k, linkage = 'ward')
model.fit(data) #训练模型
这里由于model.labels_是一个array,我们想把他变成一个Series,且索引号对应data的索引号,才能把labels和data,以axis = 1的方式拼接起来
model.labels_:
array([1, 1, 1, 1, 1, 1, 1, 1, 1, 1, 1, 1, 1, 1, 1, 1, 1, 1, 1, 1, 1, 1,
1, 1, 1, 1, 1, 1, 1, 1, 1, 1, 1, 1, 1, 1, 1, 1, 1, 1, 1, 1, 1, 1,
1, 1, 1, 1, 1, 1, 1, 1, 1, 1, 1, 1, 1, 1, 1, 1, 1, 1, 1, 1, 1, 1,
1, 1, 1, 1, 1, 1, 1, 1, 1, 1, 1, 1, 1, 1, 1, 1, 1, 1, 1, 1, 1, 1,
1, 1, 1, 1, 1, 1, 1, 1, 1, 1, 1, 1, 1, 1, 1, 1, 1, 1, 1, 1, 1, 1,
1, 1, 1, 1, 1, 1, 1, 1, 1, 1, 1, 1, 1, 1, 1, 1, 1, 1, 1, 1, 1, 1,
1, 1, 1, 1, 1, 1, 1, 1, 1, 1, 1, 1, 1, 1, 1, 1, 2, 2, 2, 2, 2, 2,
2, 2, 2, 2, 2, 2, 2, 2, 2, 2, 2, 2, 2, 2, 2, 2, 2, 2, 2, 2, 2, 2,
2, 2, 2, 2, 2, 2, 2, 2, 2, 2, 2, 2, 2, 2, 2, 2, 2, 2, 2, 2, 2, 2,
2, 2, 2, 2, 2, 2, 2, 2, 2, 2, 2, 2, 2, 2, 2, 2, 2, 2, 2, 2, 2, 2,
2, 2, 2, 2, 2, 2, 2, 2, 2, 2, 2, 2, 2, 2, 2, 2, 2, 2, 2, 2, 2, 2,
2, 2, 2, 2, 2, 2, 2, 2, 2, 2, 2, 2, 2, 2, 2, 2, 2, 2, 2, 2, 2, 2,
2, 2, 2, 2, 2, 2, 2, 2, 2, 2, 2, 2, 2, 2, 2, 2, 2, 2, 2, 2, 2, 0,
0, 0, 0, 0, 0, 0, 0, 0, 0, 0, 0, 0, 0, 0, 0, 0, 0, 0, 0, 0, 0, 0,
0, 0, 0, 0, 0, 0, 0, 0, 0, 0, 0, 0, 0, 0, 0, 0, 0, 0, 0, 0, 0, 0,
0, 0, 0, 0, 0, 0, 0, 0, 0, 0, 0, 0, 0, 0, 0, 0, 0, 0, 0, 0, 0, 0,
0, 0, 0, 0, 0, 0, 0, 0, 0, 0, 0, 0, 0, 0, 0, 0, 0, 0, 0, 0, 0, 0,
0, 0, 0, 0, 0, 0, 0, 0, 0, 0, 0, 0, 0, 0, 0, 0, 0, 0, 0, 0, 0, 0,
0, 0, 0, 0, 0, 0, 0, 0, 0, 0, 0, 0, 0, 0, 0, 0, 0, 0, 0, 0, 0, 0,
0, 0, 0, 0, 0, 0, 0, 0, 0, 0, 0, 0, 0], dtype=int64)
pd.Series(model.labels_, index = data.index):
基站编号
36902 1
36903 1
36904 1
36905 1
36906 1
36907 1
36908 1
36909 1
36910 1
36911 1
36912 1
35138 1
37337 1
36181 1
38231 1
38015 1
38953 1
35390 1
36453 1
36855 1
35924 1
35988 1
37537 1
38885 1
36797 1
35976 1
37377 1
37160 1
38717 1
38608 1
…
36926 0
…
#详细输出原始数据及其类别
r = pd.concat([data, pd.Series(model.labels_, index = data.index)], axis = 1)  #详细输出每个样本对应的类别
r.columns = list(data.columns) + [u'聚类类别'] #重命名表头

绘制每一类数据的各项属性值所对应值的折线图:
import matplotlib.pyplot as plt
plt.rcParams['font.sans-serif'] = ['SimHei'] #用来正常显示中文标签
plt.rcParams['axes.unicode_minus'] = False #用来正常显示负号style = ['ro-', 'go-', 'bo-']
xlabels = [u'工作日人均停留时间', u'凌晨人均停留时间', u'周末人均停留时间', u'日均人流量']
pic_output = 'D:/python/workspace/shujufenxi/chapter14/chapter14/tmp/type_' #聚类图文件名前缀for i in range(k): #逐一作图,作出不同样式plt.figure()tmp = r[r[u'聚类类别'] == i].iloc[:,:4] #提取每一类for j in range(len(tmp)):plt.plot(range(1, 5), tmp.iloc[j], style[i])#这里的range(1,5)等同于list(range(1,5)),都是值1,2,3,4
到这一步可以画出三章聚类折线图:


然后我们对图片进行注释和调整:
plt.xticks(range(1, 5), xlabels, rotation = 20) #坐标标签,给1,2,3,4对应协商属性名字plt.title(u'商圈类别%s' %(i+1)) #加上title,加上类别名称,我们计数习惯从1开始plt.subplots_adjust(bottom=0.15) #调整底部plt.savefig(u'%s%s.png' %(pic_output, i+1)) #保存图片


模型分析
商圈1:日均流量大,工作日上班时间人均停留时间,凌晨人均停留时间和周末时间人均停留时间相对较短,可判断该区域为商业区
商圈2:周末人均停留时间长,凌晨人均停留时间长,工作日上班时间人均停留时间短,日均人流量较少,可判断为家庭住宅区
商区3:工作人均停留时间长,一看就是工作区
商区2,3人员流动主要在上下班,吃饭时间,不适合运营商的促销活动
这篇关于《数据分析与挖掘 第十四章 基于基站定位数据的商圈分析》的文章就介绍到这儿,希望我们推荐的文章对编程师们有所帮助!


