本文主要是介绍k-Wave丨光声成像仿真丨轴对称坐标系中的模拟+1D/2D/3D中的光声波形(七),希望对大家解决编程问题提供一定的参考价值,需要的开发者们随着小编来一起学习吧!
本文将介绍轴对称坐标系中的模拟示例,以及1D/2D/3D中的光声波形示例。这两部分内容是官方示例:初始值问题(Initial Value Problems)中的最后两部分,一些内容是官方英文注释的机翻,还请辩证性阅读。
有兴趣的同好可以加企鹅群交流:937503xxx(有意向的同好私聊或评论加群,新群,目前群内仅5人),任何科研相关问题都可以在群内交流,平常一起聊聊天、分享日常也是没问题的,欢迎~
一、轴对称坐标系中的模拟
% 本示例提供了模拟和检测轴对称坐标系内初始压力分布产生的压力场的简单演示。
% 基于均匀传播介质和异构传播介质示例。
1.1 定义网格、介质、压力分布
% create the computational grid
Nx = 128;           % number of grid points in the axial (x) direction
Ny = 64;            % number of grid points in the radial (y) direction
dx = 0.1e-3;        % grid point spacing in the axial (x) direction [m]
dy = 0.1e-3;        % grid point spacing in the radial (y) direction [m]
kgrid = kWaveGrid(Nx, dx, Ny, dy);% define the properties of the propagation medium
medium.sound_speed = 1500 * ones(Nx, Ny);       % [m/s]
medium.sound_speed(Nx/2:end, :) = 1800;         % [m/s]
medium.density = 1000 * ones(Nx, Ny);           % [kg/m^3]
medium.density(Nx/2:end, :) = 1200;             % [kg/m^3]% create initial pressure distribution in the shape of a disc - this is
% generated on a 2D grid that is doubled in size in the radial (y)
% direction, and then trimmed so that only half the disc is retained
source.p0 = 10 * makeDisc(Nx, 2 * Ny, Nx/4 + 8, Ny + 1, 5);
source.p0 = source.p0(:, Ny + 1:end);
(1)定义网格:
Nx = 128; % number of grid points in the axial (x) direction
Ny = 64; % number of grid points in the radial (y) direction
dx = 0.1e-3; % grid point spacing in the axial (x) direction [m]
dy = 0.1e-3; % grid point spacing in the radial (y) direction [m]
kgrid = kWaveGrid(Nx, dx, Ny, dy);
% 轴对称模拟以类似于二维模拟的方式进行。
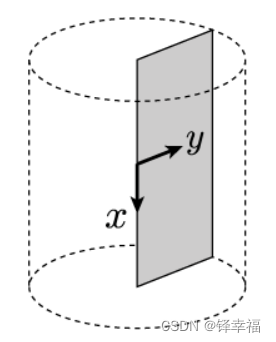
% 而在轴对称坐标系中,x维对应轴向,y维对应径向,如图所示。
% 坐标系是围绕x轴旋转对称的,因此y轴上的一个点对应于三维空间中的一个连续圆。
% 确定了网格参数后,"kWaveGrid"将以与2D模拟相同的方式进行介质离散化。
% 然而,在径向维度中,第一个网格点现在对应于网格原点,即y = 0。
% 相比之下,对于"kspaceFirstOrder2D",笛卡尔点y = 0位于计算网格的中间。

(2)定义介质:
% 对于非均质声传播介质,介质性质以与计算网格大小相同的二维矩阵形式给出。
% 在本例中,介质属性被划分为两个半空间。
(3)定义初始压力分布:
source.p0 = 10 * makeDisc(Nx, 2 * Ny, Nx/4 + 8, Ny + 1, 5);
% source.p0 = 10 * makeDisc(Nx, 2 * Ny, 10, Ny + 1, 5);
% Nx/4+8 = 40,40*0.1=4[mm],注:在这里,作者尚不确定如何确定source的横坐标,只能再挖下一个坑0.q
% Ny+1 = 65,65*0.1=6.5[mm],相当于y坐标贴近x轴
source.p0 = source.p0(:, Ny + 1:end);
% 与二维中一样,初始压力分布使用包含计算域中每个网格点的初始压力值的矩阵来设置。
% 然而,对于轴对称代码,初始压力是围绕矩阵的第一列旋转对称的。
% 例如:如果将初始压力设置为第一列中的单个网格点(即,y=0时在x轴上),则对应于在3D模拟中设置一个点源。
% 相反,如果将初始压力设置为任何其他列中的单个网格点,则对应于在3D中设置环。
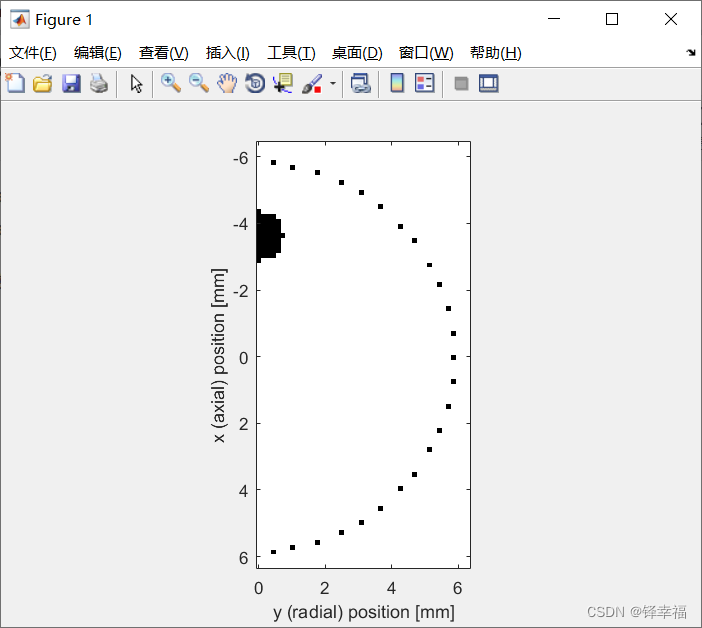
% 在这个例子中,初始压力被设置为半圆盘的形状,这相当于三维中的一个球。
1.2 定义传感器及运行模拟
% define a Cartesian sensor mask with points in the shape of a circle
sensor.mask = makeCartCircle(40 * dx, 50);% remove points from sensor mask where y < 0
sensor.mask(:, sensor.mask(2, :) < 0) = [];% run the simulation using the axisymmetric code
sensor_data = kspaceFirstOrderAS(kgrid, medium, source, sensor);
% 半径为40*dx=4[mm],个数为50
% 在这个例子中,定义了一个圆形的笛卡尔式传感器。
% 初始压力和传感器的图形见"1.3 绘图及数据可视化"。
sensor.mask(:, sensor.mask(2, :) < 0) = [];
% 注意:对于轴对称代码,在径向(y)方向上,完全匹配层(PML)仅应用于域的外缘。
% 默认的PML大小是20个网格点。
sensor_data = kspaceFirstOrderAS(kgrid, medium, source, sensor);
% 使用"kspaceFirstOrderAS",而不是"kspaceFirstOrder'x'D"。
1.3 绘图及数据可视化
% create plot axis
x_vec = 1e3 * kgrid.x_vec;
y_vec = 1e3 * (kgrid.y_vec - kgrid.y_vec(1));% create the simulation layout, removing the PML 创建仿真布局,关闭显示PML
pml_size = 20;
sim_layout = double(source.p0 | cart2grid(kgrid, sensor.mask, true));
sim_layout = sim_layout(1 + pml_size:end - pml_size, 1:end - pml_size); % plot the simulation layout
figure;
imagesc(y_vec, x_vec, sim_layout, [0, 1]);
axis image;
colormap(flipud(gray));
xlabel('y (radial) position [mm]');
ylabel('x (axial) position [mm]');% plot the simulated sensor data
figure;
imagesc(sensor_data, [-1, 1]);
colormap(getColorMap);
ylabel('Sensor Position');
xlabel('Time Step');
colorbar;% plot a trace from the simulated sensor data
figure;
plot(sensor_data(5, :));
xlabel('Time Step');
ylabel('Pressure [Pa]');
% 创建绘图轴
x_vec = 1e3 * kgrid.x_vec;
y_vec = 1e3 * (kgrid.y_vec - kgrid.y_vec(1));
% 创建仿真布局,关闭显示PML
pml_size = 20;
sim_layout = double(source.p0 | cart2grid(kgrid, sensor.mask, true));
sim_layout = sim_layout(1 + pml_size:end - pml_size, 1:end - pml_size);
figure;
imagesc(y_vec, x_vec, sim_layout, [0, 1]);
% 数据线性映射到[0,1]之间,而不是[-1,1]之间;如果是[-1,1],底色会成暗色。
axis image;
colormap(flipud(gray));
% "flipud":从上到下翻转数组;"flipud(gray)":翻转灰度图,将底色变为白色。
xlabel('y (radial) position [mm]');
ylabel('x (axial) position [mm]');
初始压力和传感器的绘制见下——
数据可视化结果见下——

二、1D/2D/3D中的光声波形
2.1 程序前的说明
% 从光声源记录的时变压力信号看起来不同,这取决于模拟中使用的维度数量。
% 这种差异的产生是因为一维的点源对应于三维的平面波,而二维的点源对应于三维的无限线源。
% 本示例显示了在每个维度中记录的信号之间的差异。
% 基于一维模拟、均匀传播介质(二维模拟)、三维模拟。
% 平面波(1D)、圆柱形波(2D)和球面波(3D)的传播特性在一些基本方面是不同的,
% 这一事实经常被忽视。这可能导致对光声模拟结果的不正确理解。
% 特别是,1D、2D和3D传播之间的三个关键区别是:
% 1.光声波在一维和三维是紧密支持的(compactly supported)。
% 这意味着它们在某个有限区域外为零(它们会“结束”),而二维波形具有无限长的尾巴。
% 这可以通过将二维点源视为三维中的无限长线源来理解。
% 这意味着总是会有一些信号从线源的某些部分(越来越远)到达检测器。
% 光声学的一个含义是时间反转图像重建在二维是不精确的。
% 2.在一维中没有几何扩展,所以波幅不会衰减(除非有吸收)。
% 在二维中,波经历圆柱形传播,其中声波能量分布在增长的波前。
% 这意味着声能与半径成反比,声压衰减为1/根号(半径)。
% 在三维中,扩散是在一个球形波前,所以能量扩散在半径的平方上,压力衰减为1/半径。
% 3.在一维中,初始压力分布的形状将保持在传播脉冲的形状中。这在2D和3D中是不成立的。
% 请注意,这里使用1D, 2D和3D来指代笛卡尔坐标系,其中变量为(x),(x,y)和(x,y,z)。
% 其他可以描述为1D(例如仅具有径向坐标的球对称)或2D(例如以(r,θ)为坐标的圆柱对称)的情况不被考虑。
2.2 常规设置
% 首先,设置所有三个示例的常用设置,
% 包括网格大小、介质属性、初始压力分布大小、source-接收器距离、时间步长和运行模拟的时间长度。
% size of the computational grid
Nx = 64;    % number of grid points in the x (row) direction
x = 1e-3;   % size of the domain in the x direction [m]
dx = x/Nx;  % grid point spacing in the x direction [m]% define the properties of the propagation medium
medium.sound_speed = 1500;      % [m/s]% size of the initial pressure distribution
source_radius = 2;              % [grid points]% distance between the centre of the source and the sensor
source_sensor_distance = 10;    % [grid points]% time array
dt = 2e-9;                      % [s]
t_end = 300e-9;                 % [s]% computation settings
input_args = {'DataCast', 'single', 'PlotLayout', true};
% "DataCast-single":加快计算时间,代价是精度损失。
% 设置为以单精度算法运行仿真,比双精度算法更快,对于大多数仿真来说已经足够了。
2.3 一维模拟
% 创建k-Wave网格、时间阵列、初始压力分布(source)和用于记录波场的传感器
% create the computational grid
kgrid = kWaveGrid(Nx, dx);% create the time array
kgrid.setTime(round(t_end / dt) + 1, dt);% create initial pressure distribution
source.p0 = zeros(Nx, 1);
source.p0(Nx/2 - source_radius : Nx/2 + source_radius) = 1;% define a single sensor point
sensor.mask = zeros(Nx, 1);
sensor.mask(Nx/2 + source_sensor_distance) = 1;% run the simulation
sensor_data_1D = kspaceFirstOrder1D(kgrid, medium, source, sensor, input_args{:});
2.4 二维模拟
% 在2D中运行模拟与1D非常相似,不同点如下:
% 使用"makeDisc"将初始压力分布定义为圆盘(填充圆);将传感器定义为二维中的单个像素
% create the computational grid
kgrid = kWaveGrid(Nx, dx, Nx, dx);% create the time array
kgrid.setTime(round(t_end / dt) + 1, dt);% create initial pressure distribution
source.p0 = makeDisc(Nx, Nx, Nx/2, Nx/2, source_radius);% define a single sensor point
sensor.mask = zeros(Nx, Nx);
sensor.mask(Nx/2 - source_sensor_distance, Nx/2) = 1;% run the simulation
sensor_data_2D = kspaceFirstOrder2D(kgrid, medium, source, sensor, input_args{:});
2.5 三维模拟
% 3D示例遵循相同的模式,除了source被定义为使用"makeBall"的球(填充球体)
% create the computational grid
kgrid = kWaveGrid(Nx, dx, Nx, dx, Nx, dx);% create the time array
kgrid.setTime(round(t_end / dt) + 1, dt);% create initial pressure distribution
source.p0 = makeBall(Nx, Nx, Nx, Nx/2, Nx/2, Nx/2, source_radius);% define a single sensor point
sensor.mask = zeros(Nx, Nx, Nx);
sensor.mask(Nx/2 - source_sensor_distance, Nx/2, Nx/2) = 1;% run the simulation
sensor_data_3D = kspaceFirstOrder3D(kgrid, medium, source, sensor, input_args{:});
2.6 绘图及数据可视化
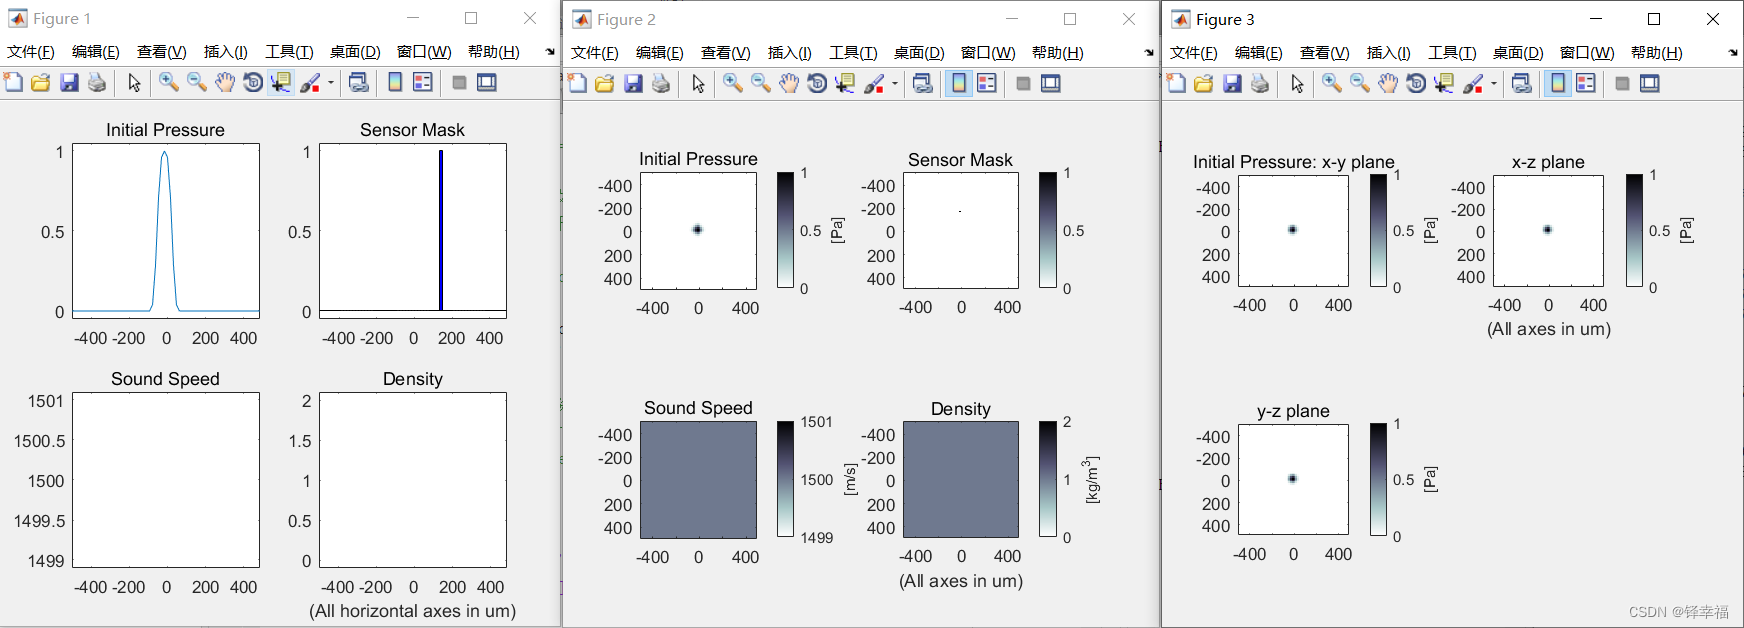
1.内置绘图如下——

2.数据可视化——
% plot the time signals recorded in each dimension
figure;
[t_sc, t_scale, t_prefix] = scaleSI(t_end);
% t_end=300*10^(-9)[s],t_sc='300n',t_scale='10^9',t_prefix='n'。
plot(kgrid.t_array * t_scale, sensor_data_1D ./ max(abs(sensor_data_1D)), 'b-');
hold on;
plot(kgrid.t_array * t_scale, sensor_data_2D ./ max(abs(sensor_data_2D)), 'r-');
plot(kgrid.t_array * t_scale, sensor_data_3D ./ max(abs(sensor_data_3D)), 'k-');
xlabel(['Time [' t_prefix 's]']);
ylabel('Recorded Pressure [au]');
legend('1D', '2D', '3D');
axis tight;
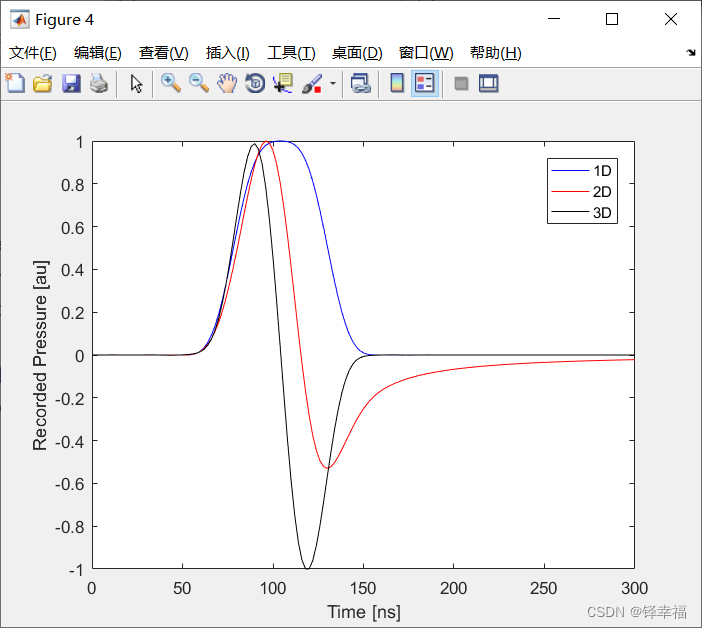
% 记录的1D、2D和3D三个时间序列如下图所示(振幅已归一化)。
% 可以清楚地看到,一维和三维波形是紧密支撑的(compactly supported)。
[t_sc, t_scale, t_prefix] = scaleSI(t_end);
% t_end=300*10^(-9)[s],t_sc='300n',t_scale='10^9',t_prefix='n'。
plot(kgrid.t_array * t_scale, sensor_data_1D ./ max(abs(sensor_data_1D)), 'b-');
% './':矩阵中对应的每个元素相除
% abs:返回数组中每个元素的绝对值;如果是复数,则返回复数的模。
% sensor_data_1D ./ max(abs(sensor_data_1D)):目的是“归一化”。
数据可视化结果如下——

后言——
到这里,官方文档中建议k-Wave新手优先完成的初始值问题实例【Initial Value Problems】已全部完结。
在此祝贺阅读到这里的你,也祝贺我自己。
后续将继续更新官方文档中的一些具体示例,以及特定领域内的光声成像仿真,欢迎订阅及关注~
这篇关于k-Wave丨光声成像仿真丨轴对称坐标系中的模拟+1D/2D/3D中的光声波形(七)的文章就介绍到这儿,希望我们推荐的文章对编程师们有所帮助!


