本文主要是介绍NetHogs - Monitor Per Process Network Bandwidth Usage in Real Time,希望对大家解决编程问题提供一定的参考价值,需要的开发者们随着小编来一起学习吧!
原文链接:http://www.tecmint.com/nethogs-monitor-per-process-network-bandwidth-usage-in-real-time/
Linux operating systems have tons of open source network monitoring tools on the web. Say, you can use iftop command to check bandwidth usage, netstat command to see reports on interface statistics or top command to watch running process on your system. But if you are really looking for something that can give you a real time statistics of your network bandwidth of per process usage, then NetHogsis the only utility you should look for.
What is NetHogs?
NetHogs is an open source command line program (similar to Linux top command) that is used for monitor real time network traffic bandwidth used by each process or application.
From NetHogs Project Page
NetHogs is a small ‘net top’ tool. Instead of breaking the traffic down per protocol or per subnet, like most tools do, it groups bandwidth by process. NetHogs does not rely on a special kernel module to be loaded. If there’s suddenly a lot of network traffic, you can fire up NetHogs and immediately see which PID is causing this. This makes it easy to identify programs that have gone wild and are suddenly taking up your bandwidth.
This article explains you on how to install and find out real time per process network bandwidth usage with nethogs utility under Unix/Linux operating systems.
Install NetHogs in RHEL, CentOS and Fedora
To install nethogs, you must turn on EPEL repository under your Linux systems and then run the following yum command to download and install nethogs package.
Sample Output
Install NetHogs in Ubuntu, Linux Mint and Debian
To install nethogs, type the following apt-get command to install nethogs package.
Sample Output
Using NetHogs Utility
To run the nethogs utility, type the following command under red-hat based systems.
To execute it, you will must have root permissions, so run with sudo command as shown.
Sample Previews:

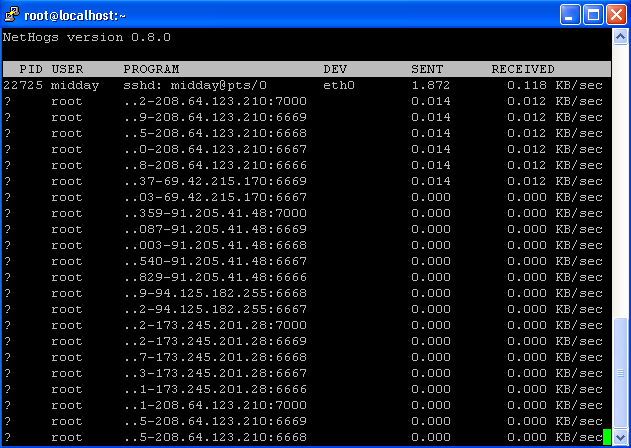
NetHogs Preview on CentOS 6.3

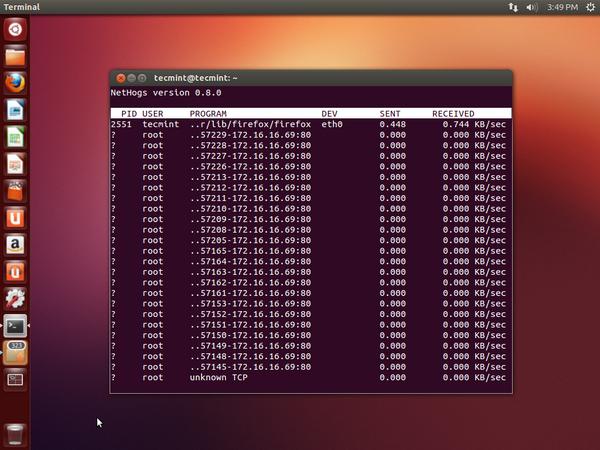
NetHogs Preview on Ubuntu 12.10
As you see above the send and received lines show the amount of traffic being used by per process. The total sent and received usage of bandwidth calculated at the bottom. You can sort and change the order by using the interactive controls discussed below.
NetHogs Command Line Options
Following are the nethogs command line options. Using ‘-d‘ to add a refresh rate and ‘device name‘ to monitor specific given device or devices bandwidth (default is eth0). For example, to set 5 seconds as your refresh rate, then type the command as.
To monitor specific device (eth0) network bandwidth only, use the command as.
To monitor network bandwidth of both eth0 and eth1 interfaces, type the following command.
Other Options and Usage
NetHogs Interactive Controls
Following are some useful interactive controls (Keyboard Shortcuts) of nethogs program.
For a full list of nethogs utility command line options, please check out the nethogs man pages by using command as ‘man nethogs‘ or ‘sudo man nethogs‘ from the terminal. For more information visit theNethogs project home page.
这篇关于NetHogs - Monitor Per Process Network Bandwidth Usage in Real Time的文章就介绍到这儿,希望我们推荐的文章对编程师们有所帮助!


