本文主要是介绍TCGA病理图像深度学习的肿瘤淋巴细胞浸润(文献),希望对大家解决编程问题提供一定的参考价值,需要的开发者们随着小编来一起学习吧!
Spatial Organization and Molecular Correlation of Tumor-Infiltrating Lymphocytes Using Deep Learning on Pathology Images - ScienceDirect
该文献展示了:基于13种TCGA肿瘤类型的H&E图像的肿瘤浸润淋巴细胞(TIL)的映射。
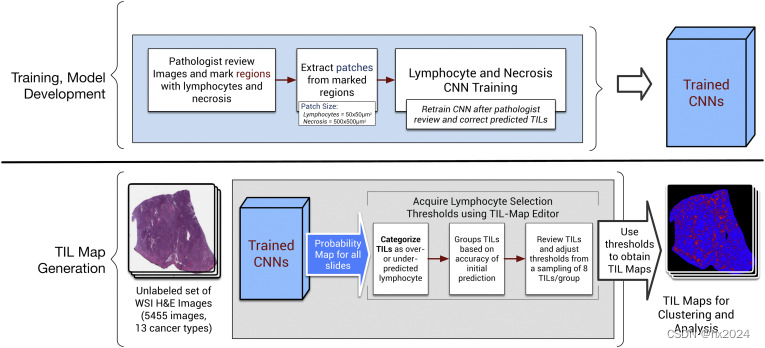
流程

方法使用两种CNN:淋巴细胞浸润分类CNN(淋巴细胞CNN)和坏死分割CNN(坏死CNN)。淋巴细胞 CNN 将输入图像的微小斑块分为有淋巴细胞浸润的斑块和没有淋巴细胞浸润的斑块。它是一个半监督的CNN,由无监督卷积自动编码器(CAE)初始化。坏死 CNN 对坏死区域进行分割,旨在消除坏死区域的假阳性,其中细胞核可能具有与淋巴细胞浸润区域相似的特征。
评估TIL空间分数
TIL的空间部分估计为在组织样本上鉴定的斑块总数中TIL阳性斑块的比例。
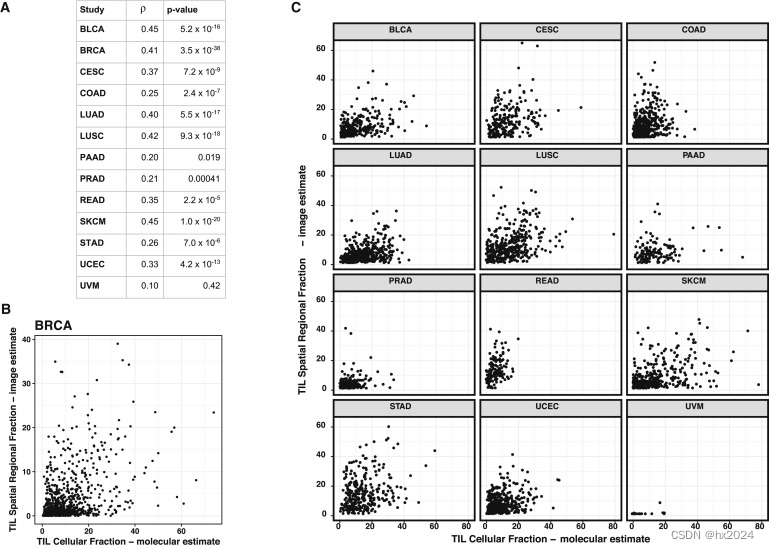
Spearman 相关系数和 p 值,用于比较 TIL 图谱空间估计的 TIL 分数和使用反卷积方法处理癌症基因组学数据的 TIL 分数的分子估计值。(病理空间分数与 CIBERSORT算法结果的相关性比较)
免疫浸润的局部空间结构
对病理TIL空间关系的探索
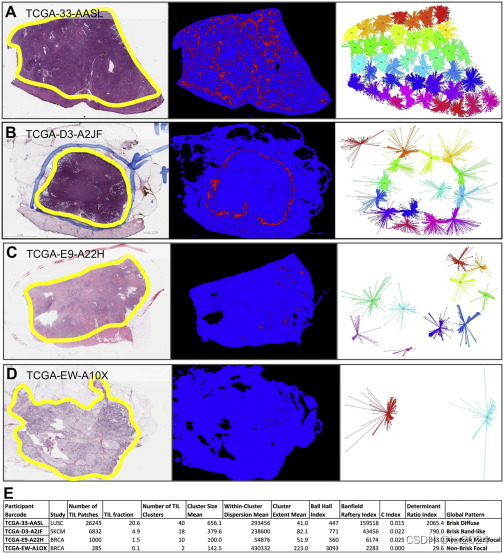
成像数据的一个独特特征是能够超越总淋巴细胞浸润负荷,评估淋巴细胞浸润模式。寻找TIL图像斑块的空间连接和连贯区域(簇)。汇总度量包括聚类数 N簇,簇NP中TIL斑块的平均数量,簇内分散WCD的平均值,以及簇空间范围CE的平均值。
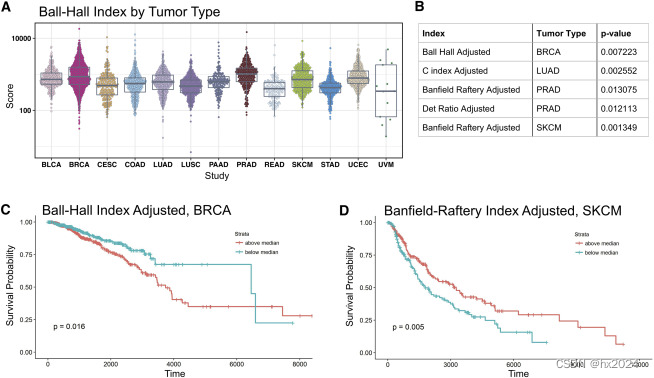
由于Ball-Hall指数与近似的簇范围呈比例,这意味着,在其中一些中等浸润肿块的肿瘤类型中,形成了相对较大的空间范围的TIL簇。总之,这意味着,在某些肿瘤类型中,与其他肿瘤类型相比,TIL的局部聚集可能是一个比整体TIL浸润更显着的特征。
TIL分数生存分析
TIL空间结构模式
病理学家在肿瘤内和肿瘤周围区域对 TIL 图中的模式进行分类。相应地,病理学家将 5,202 张 TIL 图中的模式分为五类之一:①“轻快、弥漫”,表示散布在肿瘤区域至少 30% 的弥漫性浸润性 TIL(1,856 例);②“轻快的带状”免疫应答在其外围形成与肿瘤接壤的带状边界 (1,185);③“非轻快、多灶性”,即松散散散的 TIL 存在于肿瘤面积的不到 30% 但超过 5% (1,083);④“非轻快,局灶性”,即散布在肿瘤面积小于 5% 但大于 1% 的 TIL (874);⑤最后,在143例TIL很少的病例中,涉及肿瘤面积的1%或更少,为“无”。
具体方法详解
TIL映射的卷积神经网络
| REAGENT OR RESOURCE | SOURCE | IDENTIFIER |
| Deposited Data | ||
| Tumor-infiltrating lymphocyte maps | This paper | Tumor-Infiltrating Lymphocytes Maps from TCGA H&E Whole Slide Pathology Images (TIL-WSI-TCGA) - TCIA DOIs - Cancer Imaging Archive Wiki |
| Software and Algorithms | ||
| Convolutional neural networks for TIL maps | This paper | Tumor-Infiltrating Lymphocytes Maps from TCGA H&E Whole Slide Pathology Images (TIL-WSI-TCGA) - TCIA DOIs - Cancer Imaging Archive Wiki |
| QuIP | Saltz et al., 2017 | Description | Quantitative Imaging in Pathology (QuIP) |
| Theano | Theano Development Team, 2016 | http://deeplearning.net/software/theano/ |
| DeconvNet | Noh et al., 2015 | https://github.com/HyeonwooNoh/DeconvNet |
| CIBERSORT | Newman et al., 2015 | CIBERSORTx |
| APCluster | Bodenhofer et al., 2011 | CRAN - Package apcluster |
| clusterCrit | The Comprehensive R Archive Network (CRAN) | CRAN - Package clusterCrit |
| polycor | Drasgow, 2014 | CRAN - Package polycor |
| Other | ||
| Data (images, clinical and molecular) used in this study | National Cancer Institute Genomics Data Commons | Spatial Organization And Molecular Correlation Of Tumor-Infiltrating Lymphocytes Using Deep Learning On Pathology Images | NCI Genomic Data Commons |
总体方法包括两个 CNN(淋巴细胞浸润分类 CNN(淋巴细胞 CNN))和坏死分割 CNN),以及捕获和整合病理学家反馈的机制,以评估和完善生成的肿瘤浸润淋巴细胞 (TIL) 图谱。

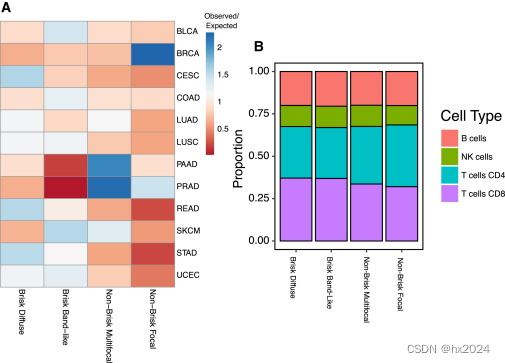
免疫应答的分子数据估计
CIBERSORT估计的免疫区室内免疫细胞组分的聚集比例。
淋巴细胞分数(lymphocyte fraction)是幼稚和记忆 B 细胞、幼稚、静息和活化记忆 CD4 T 细胞、滤泡辅助性 T 细胞、T 调节细胞、γ-δ T 细胞、CD8 T 细胞、活化和静息 NK 细胞和浆细胞的 CIBERSORT 估计值的集合。用基因分析的淋巴细胞分数与病理的TIL估计值进行斯皮尔曼相关性分析。

免疫浸润的局部空间结构
使用APCluster R包(Bodenhofer等人,2011)应用亲和传播算法来获得局部TIL簇模式。亲和力传播方法(Frey和Dueck,2007)同时将所有数据点视为可能数据点中的潜在示例(即聚类的中心)。它将每个数据点视为网络中的一个节点,沿着网络边缘递归传输实值消息,直到找到一组好的示例和相应的集群。
聚类表征是使用 Bernard Desgraupes 的 R 包 clusterCrit 中的计数和成员资格以及聚类索引的简单度量进行。Ball-Hall、Banfield-Raftery、C 指数和行列式 Ration 指数在软件包文档中进行了详细说明。
| Variable | Definition or Reference |
|---|---|
| Number of TIL Patches | TIL patch count |
| TIL fraction | (TIL patch count)/(Total number of available patches on tissue slice) |
| Number of TIL Clusters | Number of clusters, from affinity propagation clustering |
| Cluster Size Mean | Mean of the cluster membership counts |
| Cluster Size Standard Deviation | Standard deviation of the cluster membership counts |
| Within-Cluster Dispersion Mean | Mean of the values of WGSSk, the within-cluster dispersion (see below) |
| Within-Cluster Dispersion Standard Deviation | Standard deviation of the values of WGSSk |
| Cluster Extent Mean | Mean of the maximum distances to clusters exemplars. The cluster examplar is the most representative TIL patch for the cluster, as defined in the affinity propagation method |
| Cluster Extent Standard Deviation | Standard deviation of the maximum distances to exemplars |
| Ball Hall Index | Ball and Hall (1965). Available at: http://www.dtic.mil/docs/citations/AD0699616 |
| Banfield Raftery Index | Banfield and Raftery (1993) |
| C Index | Hubert and Schultz (1976) |
| Determinant Ratio Index | Scott and Symons (1971) |
| Ball Hall Index - TIL count adjusted | ‘Adjusted’ refers to the residual of the corresponding index after regression against %TIL density |
| Banfield Raftery Index - TIL count adjusted | ‘Adjusted’ refers to the residual of the corresponding index after regression against %TIL density |
| C Index - TIL count adjusted | ‘Adjusted’ refers to the residual of the corresponding index after regression against %TIL density |
| Determinant Ratio Index - TIL count adjusted | ‘Adjusted’ refers to the residual of the corresponding index after regression against %TIL density |
(补充文件表1 的详细解读)
TIL Map Structural Patterns评估
Summary Table of Criteria Used to Characterize TIL Map Structural Patterns
| Category | Immune Response | Qualitative Pattern | Proportion of Tumor composed of Lymphocytes |
|---|---|---|---|
| Indeterminate | Insufficient and/or no tumor in the H&E image at low-power | Not applicable | Not applicable |
| None | No response | No pattern | <1% TILs |
| Non-brisk, focal | Very Weak (minimal) | Localized | <5% TILs |
| Non-brisk, multi-focal | Weak (mild) | Loosely scattered foci | >5%-30% TILs |
| Brisk, diffuse | Moderate to Strong | Diffuse and dense infiltrate | >30% TILs in the intra-tumoral component∗ |
| Brisk, band-like | Not applicable | Infiltrate bordering the tumor at its periphery | <30% TILs in the intra-tumoral component∗ |
∗
If the TIL map patterns revealed both diffuse and band-like immune responses, the predominant pattern was characterized and the difference between “Brisk, diffuse” and “Brisk, band-like” was based on whether the relative distribution of TILs in the intra-tumoral component appeared to be greater than or less than 30%, respectively.
其余详见文献的补充文件!
这篇关于TCGA病理图像深度学习的肿瘤淋巴细胞浸润(文献)的文章就介绍到这儿,希望我们推荐的文章对编程师们有所帮助!


