本文主要是介绍二手房网站信息数据分析、数据可视化-基于python的crawl,jupyter notebook进行数据清洗和可视化。,希望对大家解决编程问题提供一定的参考价值,需要的开发者们随着小编来一起学习吧!
爬取数据
使用的是beautifulsoup和request库,最终将数据存入excel即csv格式
首先导入库:
import requests
from bs4 import BeautifulSoup
import csv
创建一个方法-根据网页链接和headers获取网页的内容:
def crawl_data(crawl_url):headers = {'User-Agent': 'Mozilla/5.0 (Windows NT 10.0; Win64; x64) AppleWebKit/537.36 (KHTML, like Gecko) Chrome/90.0.4430.212 Safari/537.36 Edg/90.0.818.62'}url = 'https://sh.lianjia.com' + crawl_urltry:response = requests.get(url, headers=headers)start(response)except Exception as e:print(e)抓取二手房的相关信息 包括描述、位置、房子信息、补充信息、价格、单位价格、标签
注意:用soup爬取所有最外层li的时候,class是clear LOGVIEWDATA LOGCLICKDATA;原因见此链接:原因
def start(response):item = {}soup = BeautifulSoup(response.text,'html.parser')contentlist=soup.find_all('li',{'class':'clear LOGVIEWDATA LOGCLICKDATA'})print(contentlist)for con in contentlist:describe=con.find('div',{'class':'title'}).textposition=con.find('div',{'class','positionInfo'}).texthouseinfo=con.find('div',{'class':'houseInfo'}).textfollowinfo=con.find('div',{'class':'followInfo'}).textcost=con.find('div',{'class':'totalPrice'}).find('span').textunitcost=con.find('div',{'class':'unitPrice'}).find('span').texttag=con.select('div.tag > span')totaltag = ''for t in tag:totaltag+=str(t.text) +','link=con.find('div',{'class':'title'}).find('a').get('href')seller,sellerscore,sellerreply=getseller(link)item = {"describe":describe,"position":position,"houseinfo":houseinfo,"followinfo":followinfo,"cost":cost,"unitcost":unitcost,"totaltag":totaltag,"seller":seller,"sellerscore":sellerscore,"sellerreply":sellerreply}print(item)item_list.append(item)
由于销售员在另一个页面,因此要先爬取销售员所在界面的url,再爬取此url的信息。在此getseller中传入的link参数就是上面代码块中:“link=con.find(‘div’,{‘class’:‘title’}).find(‘a’).get(‘href’)”爬到的url
def getseller(link):headers={'User-Agent':'Mozilla/5.0 (Windows NT 10.0; Win64; x64) AppleWebKit/537.36 (KHTML, like Gecko) Chrome/90.0.4430.212 Safari/537.36 Edg/90.0.818.62'}resp=requests.get(link,headers=headers)soupl = BeautifulSoup(resp.text, 'html.parser')seller = soupl.find('div', {'class': 'brokerName'}).find('a').textsellerinfo=soupl.select('div.evaluate > span')sellerscore=(sellerinfo[0].text)[3:]sellerreply=((sellerinfo[-1].text)[1:])[:-3]return seller,sellerscore,sellerreply
def一个函数写入csv的表头:
def csv_title():return['标题','位置','房屋信息','关注人数及发布时间','总价','每平米价格','所有标签','销售者','销售者评分','关于销售者的评论']
main函数。这里爬取了20页,所以range(20),放在循环里依次加一。
最后是将所有爬取信息写入csv(遍历item_list)。
if __name__=='__main__':start_url = '/ershoufang/'item_list = []for a in range(20):next='/ershoufang/pg'next_url = next+str(a+1)+'/'print(next_url)crawl_data(next_url)file_name='链家信息爬取.csv'with open(file_name,'w',newline='',encoding='utf-8-sig') as f:pen=csv.writer(f)pen.writerow(csv_title())for i in item_list:pen.writerow(i.values())print("爬取完成,共爬取%d条数据"% len(item_list))
最终爬取出信息存入excel中,这个样子:
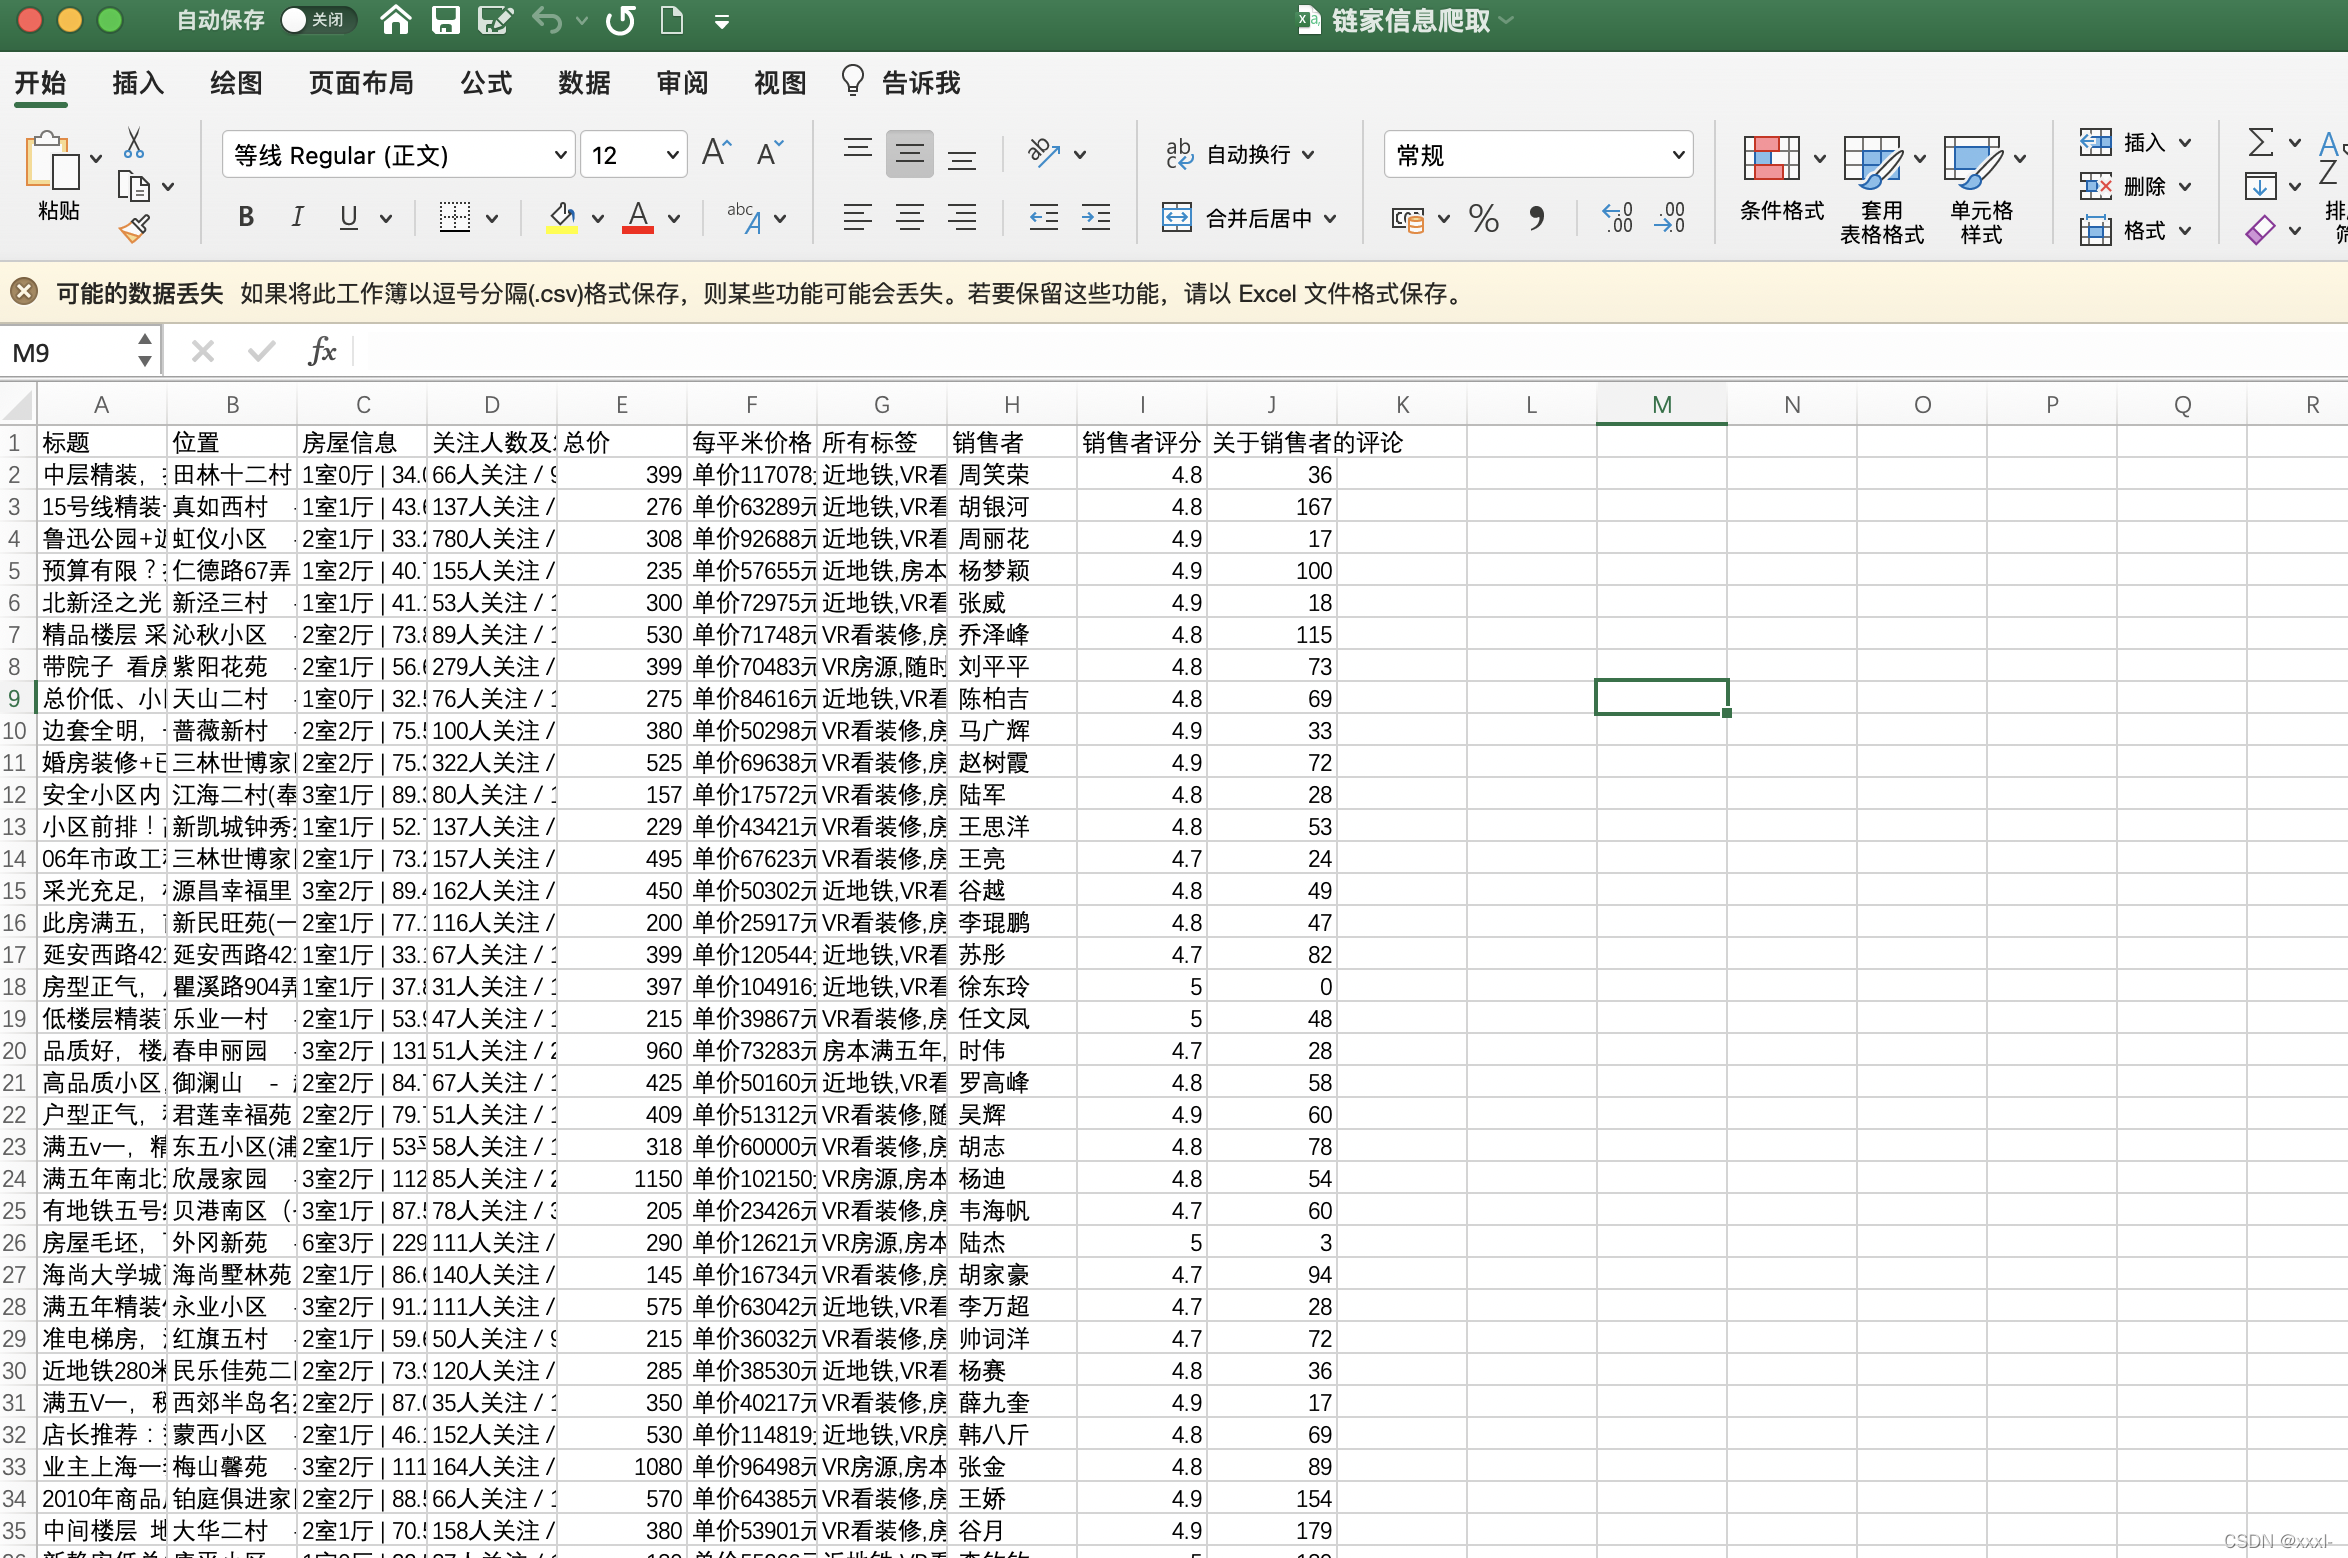
然后爬虫部分就结束了。
数据清洗
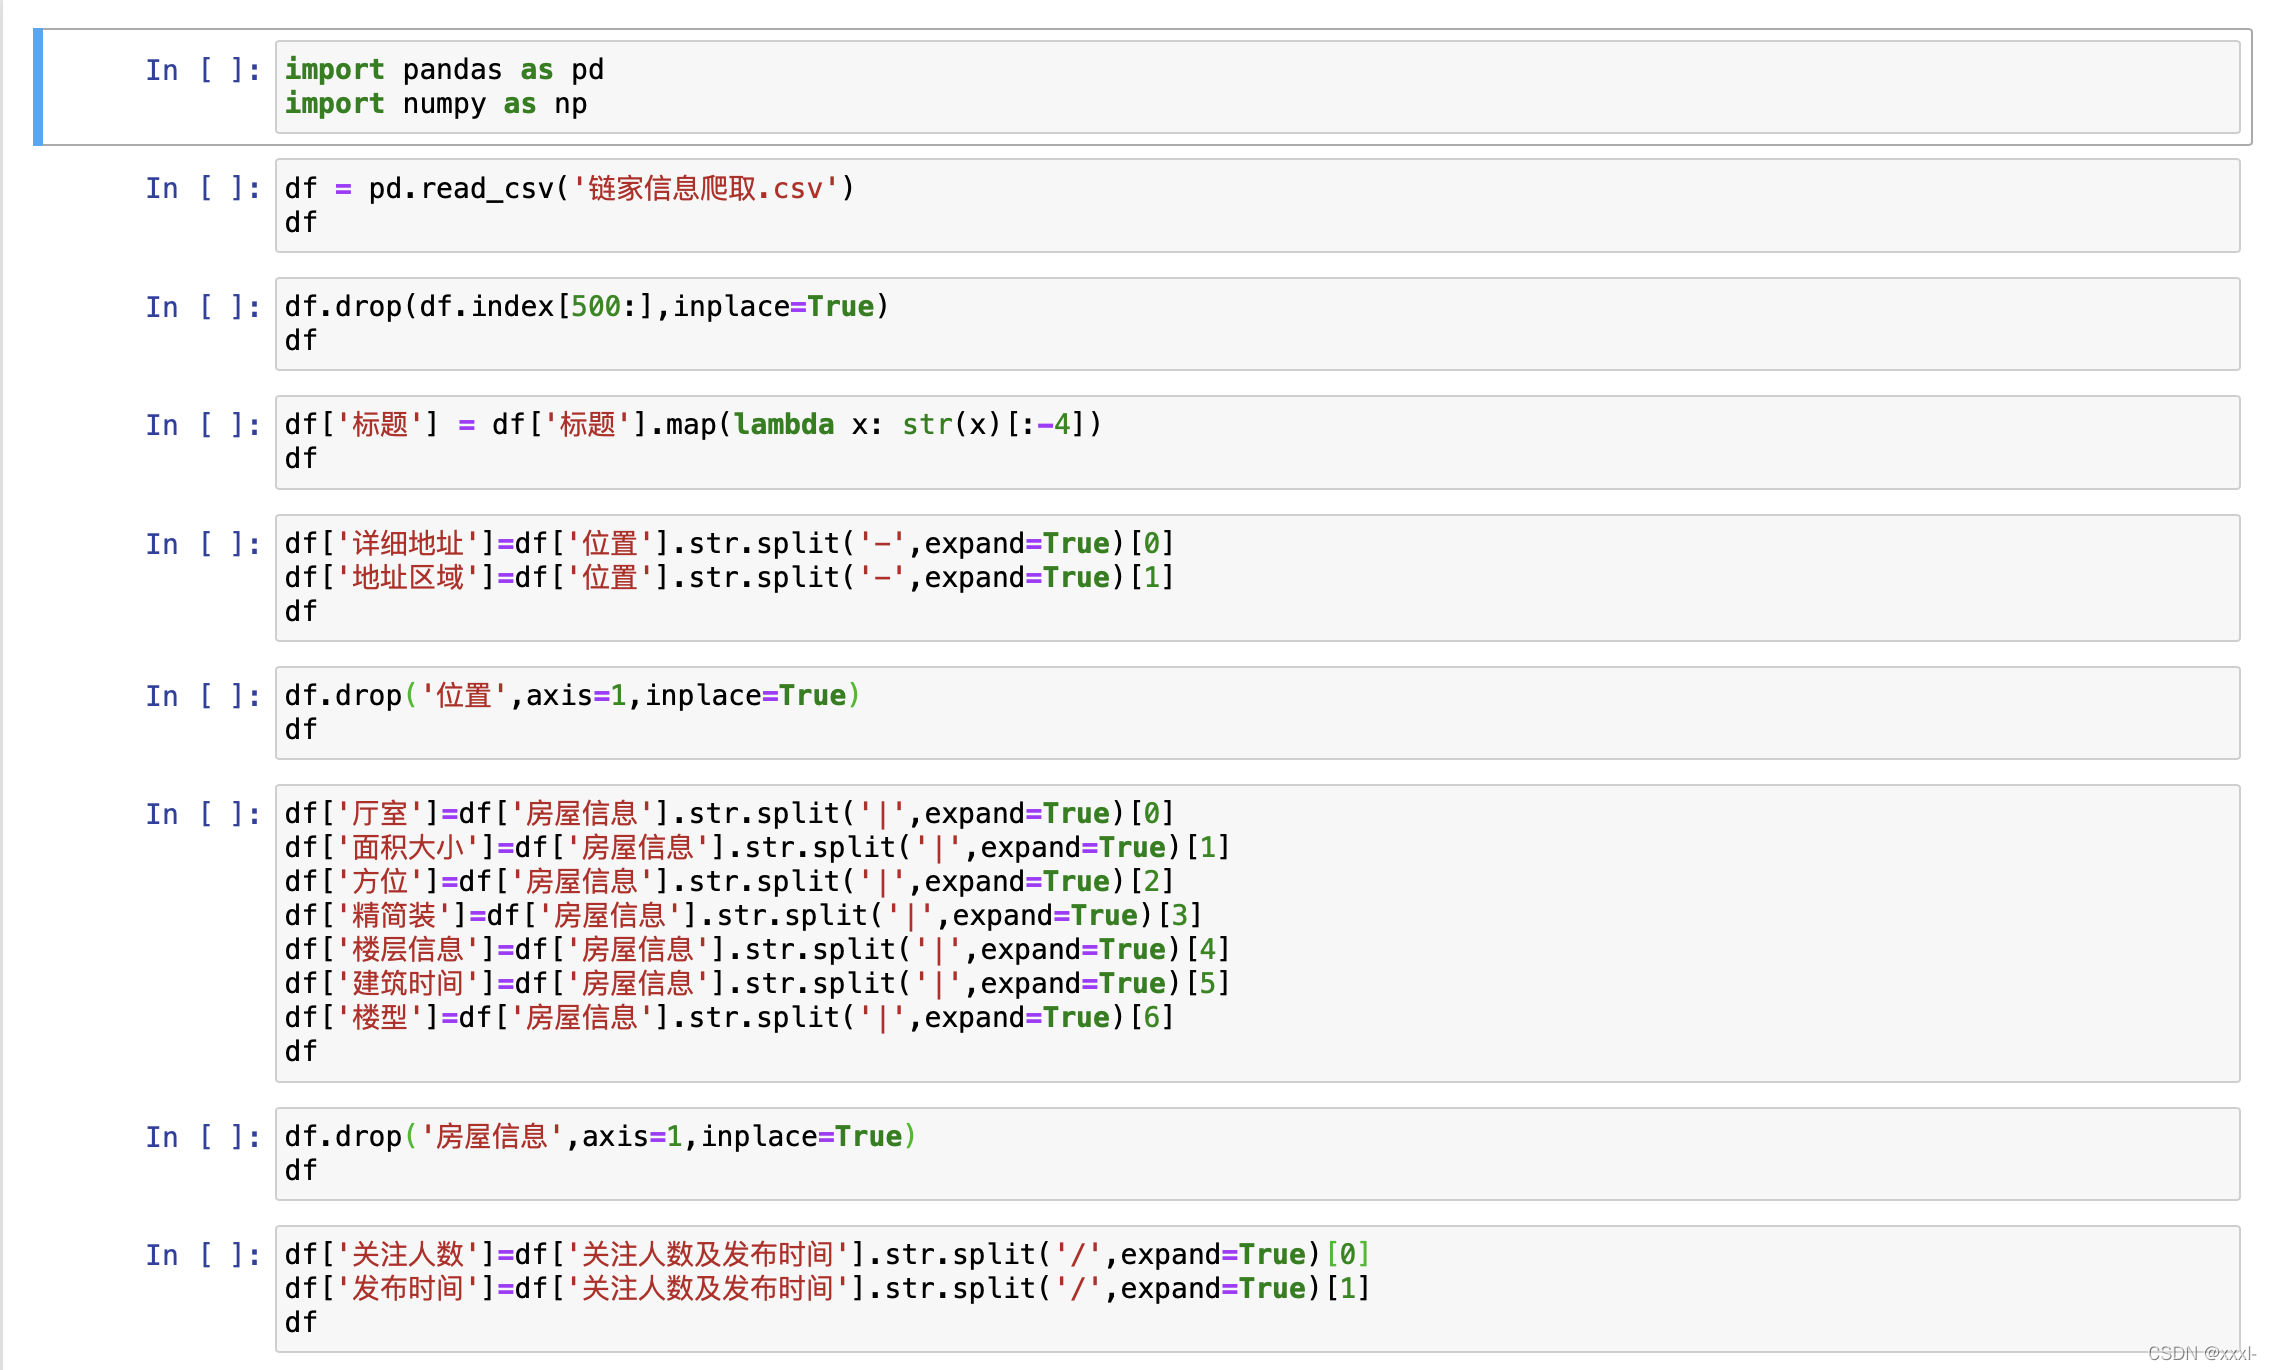
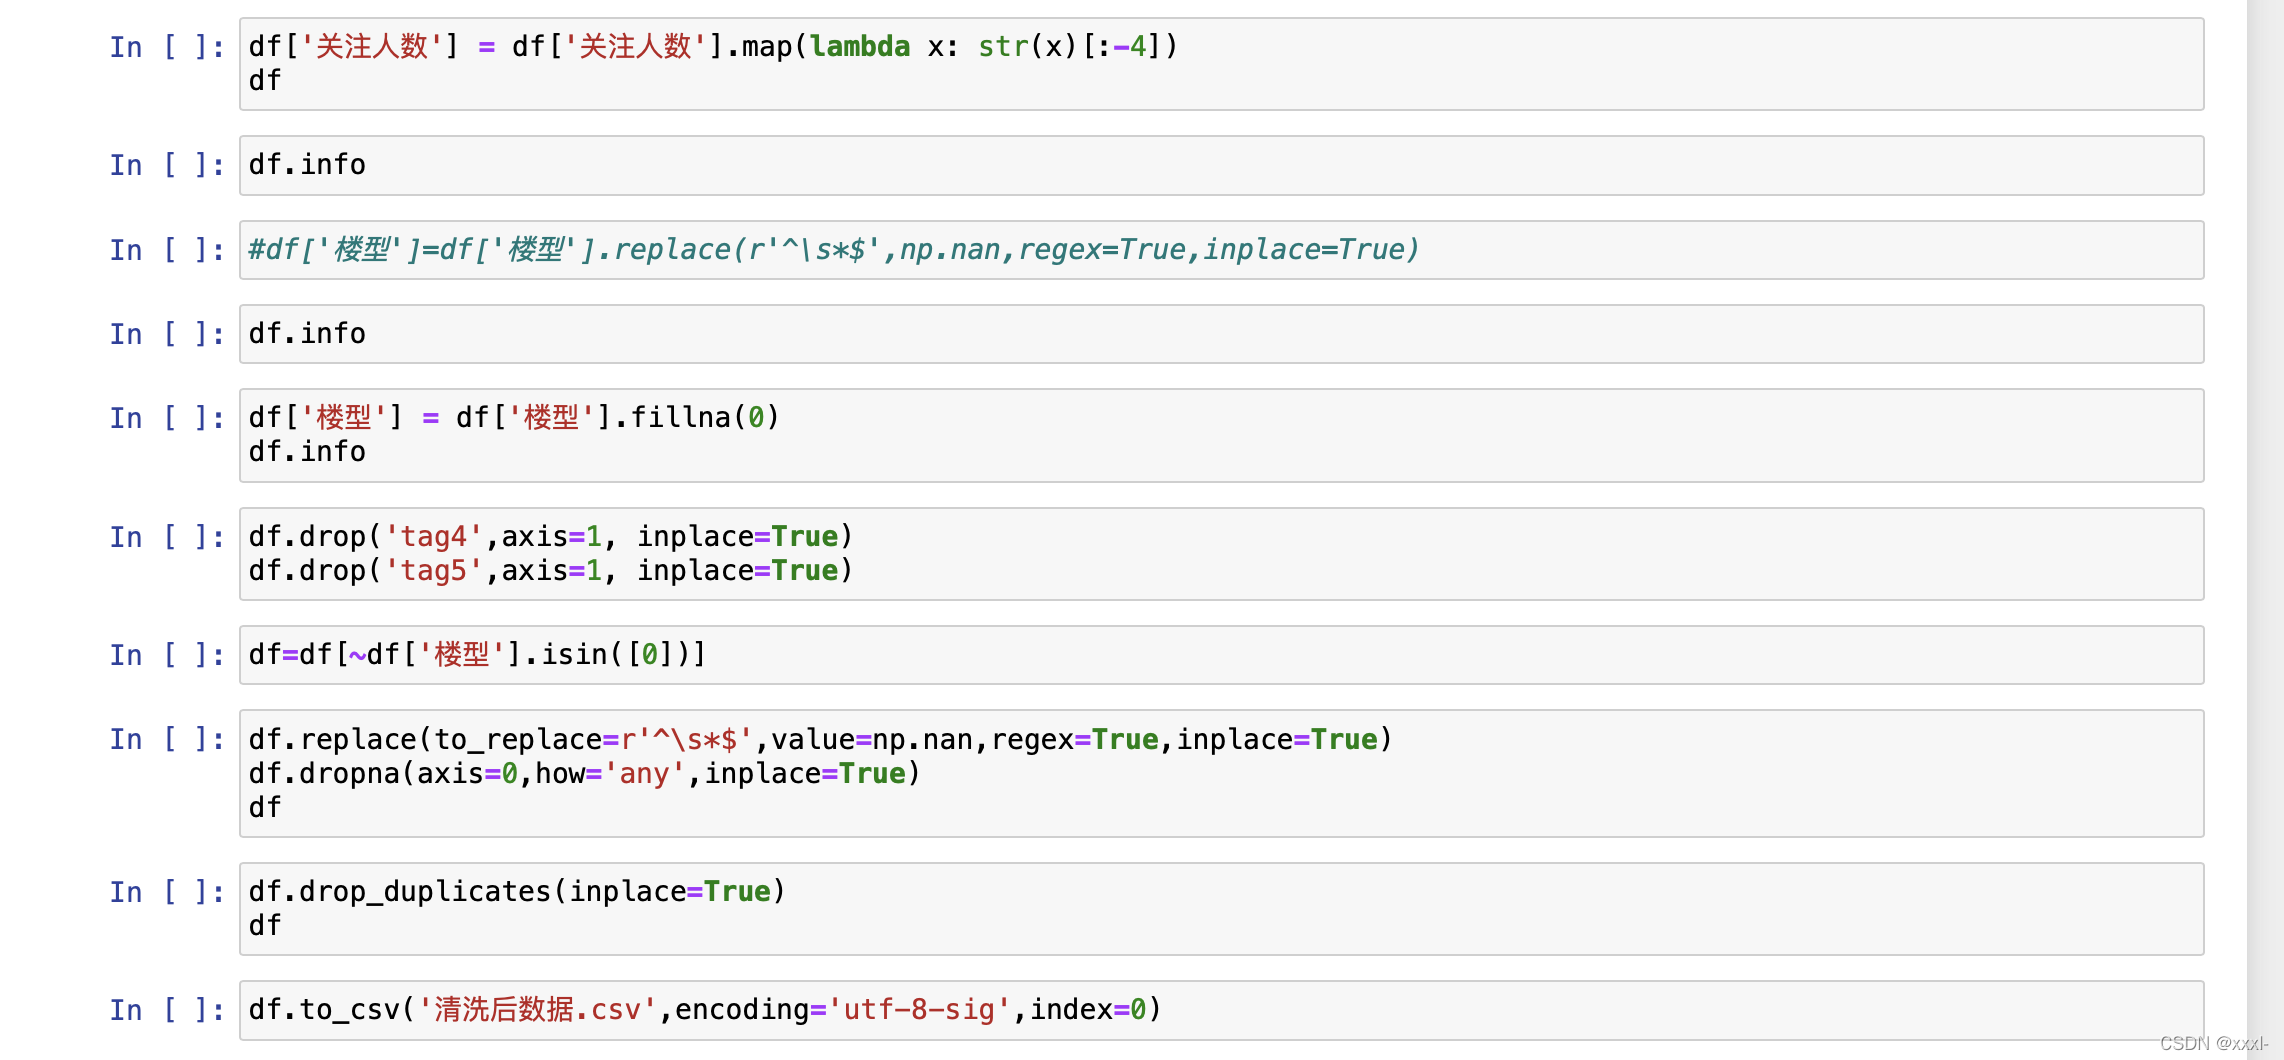
下边是利用jupyter notebook进行数据清洗,把一些不需要的信息用代码去除。
把一些关键的代码放在这里,完整的jupyter代码文件我会上传。
用了pandas和numpy库。
这里是取前500条数据:
df.drop(df.index[500:],inplace=True)
将位置细分,分为地址区域和详细地址两部分。
df['详细地址']=df['位置'].str.split('-',expand=True)[0]
df['地址区域']=df['位置'].str.split('-',expand=True)[1]
多了最后两列:
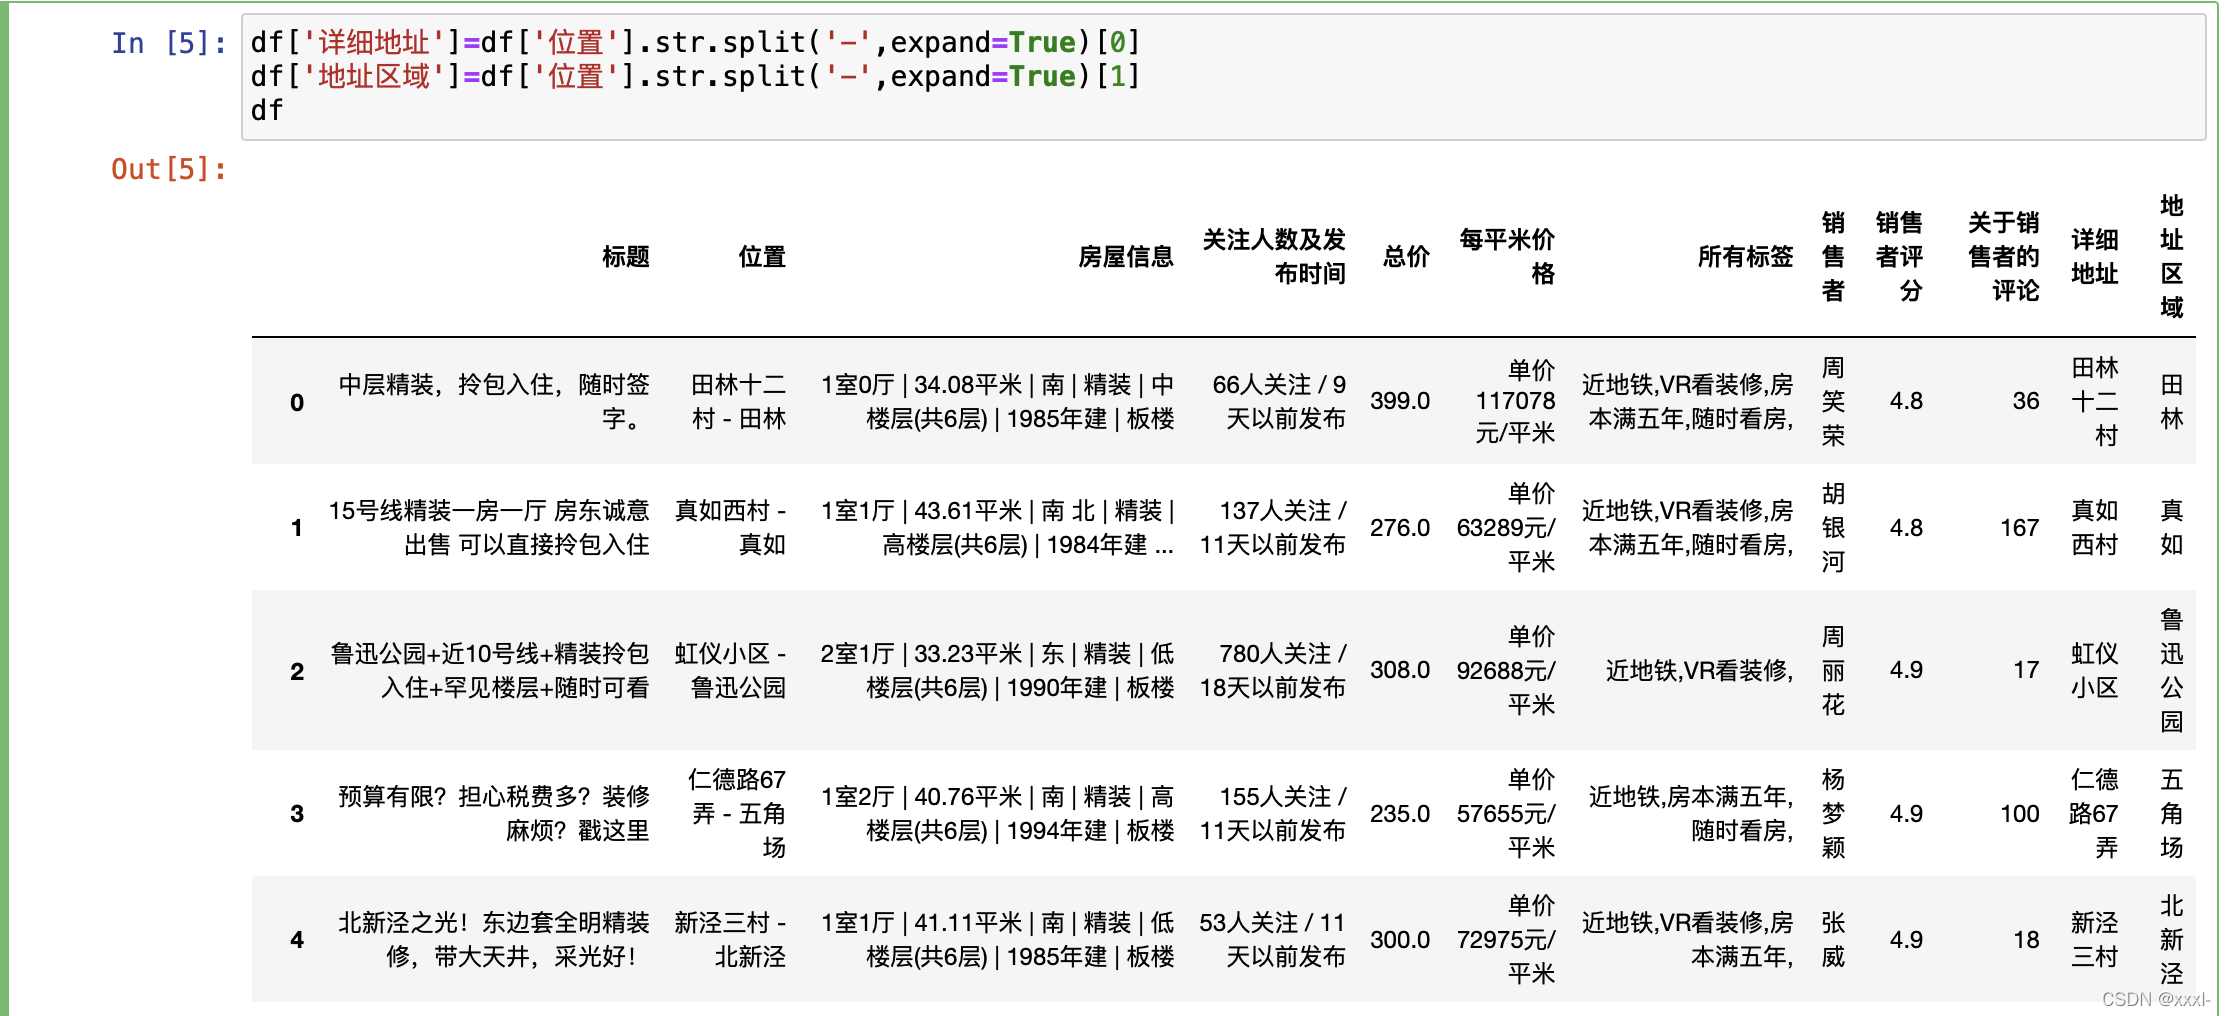
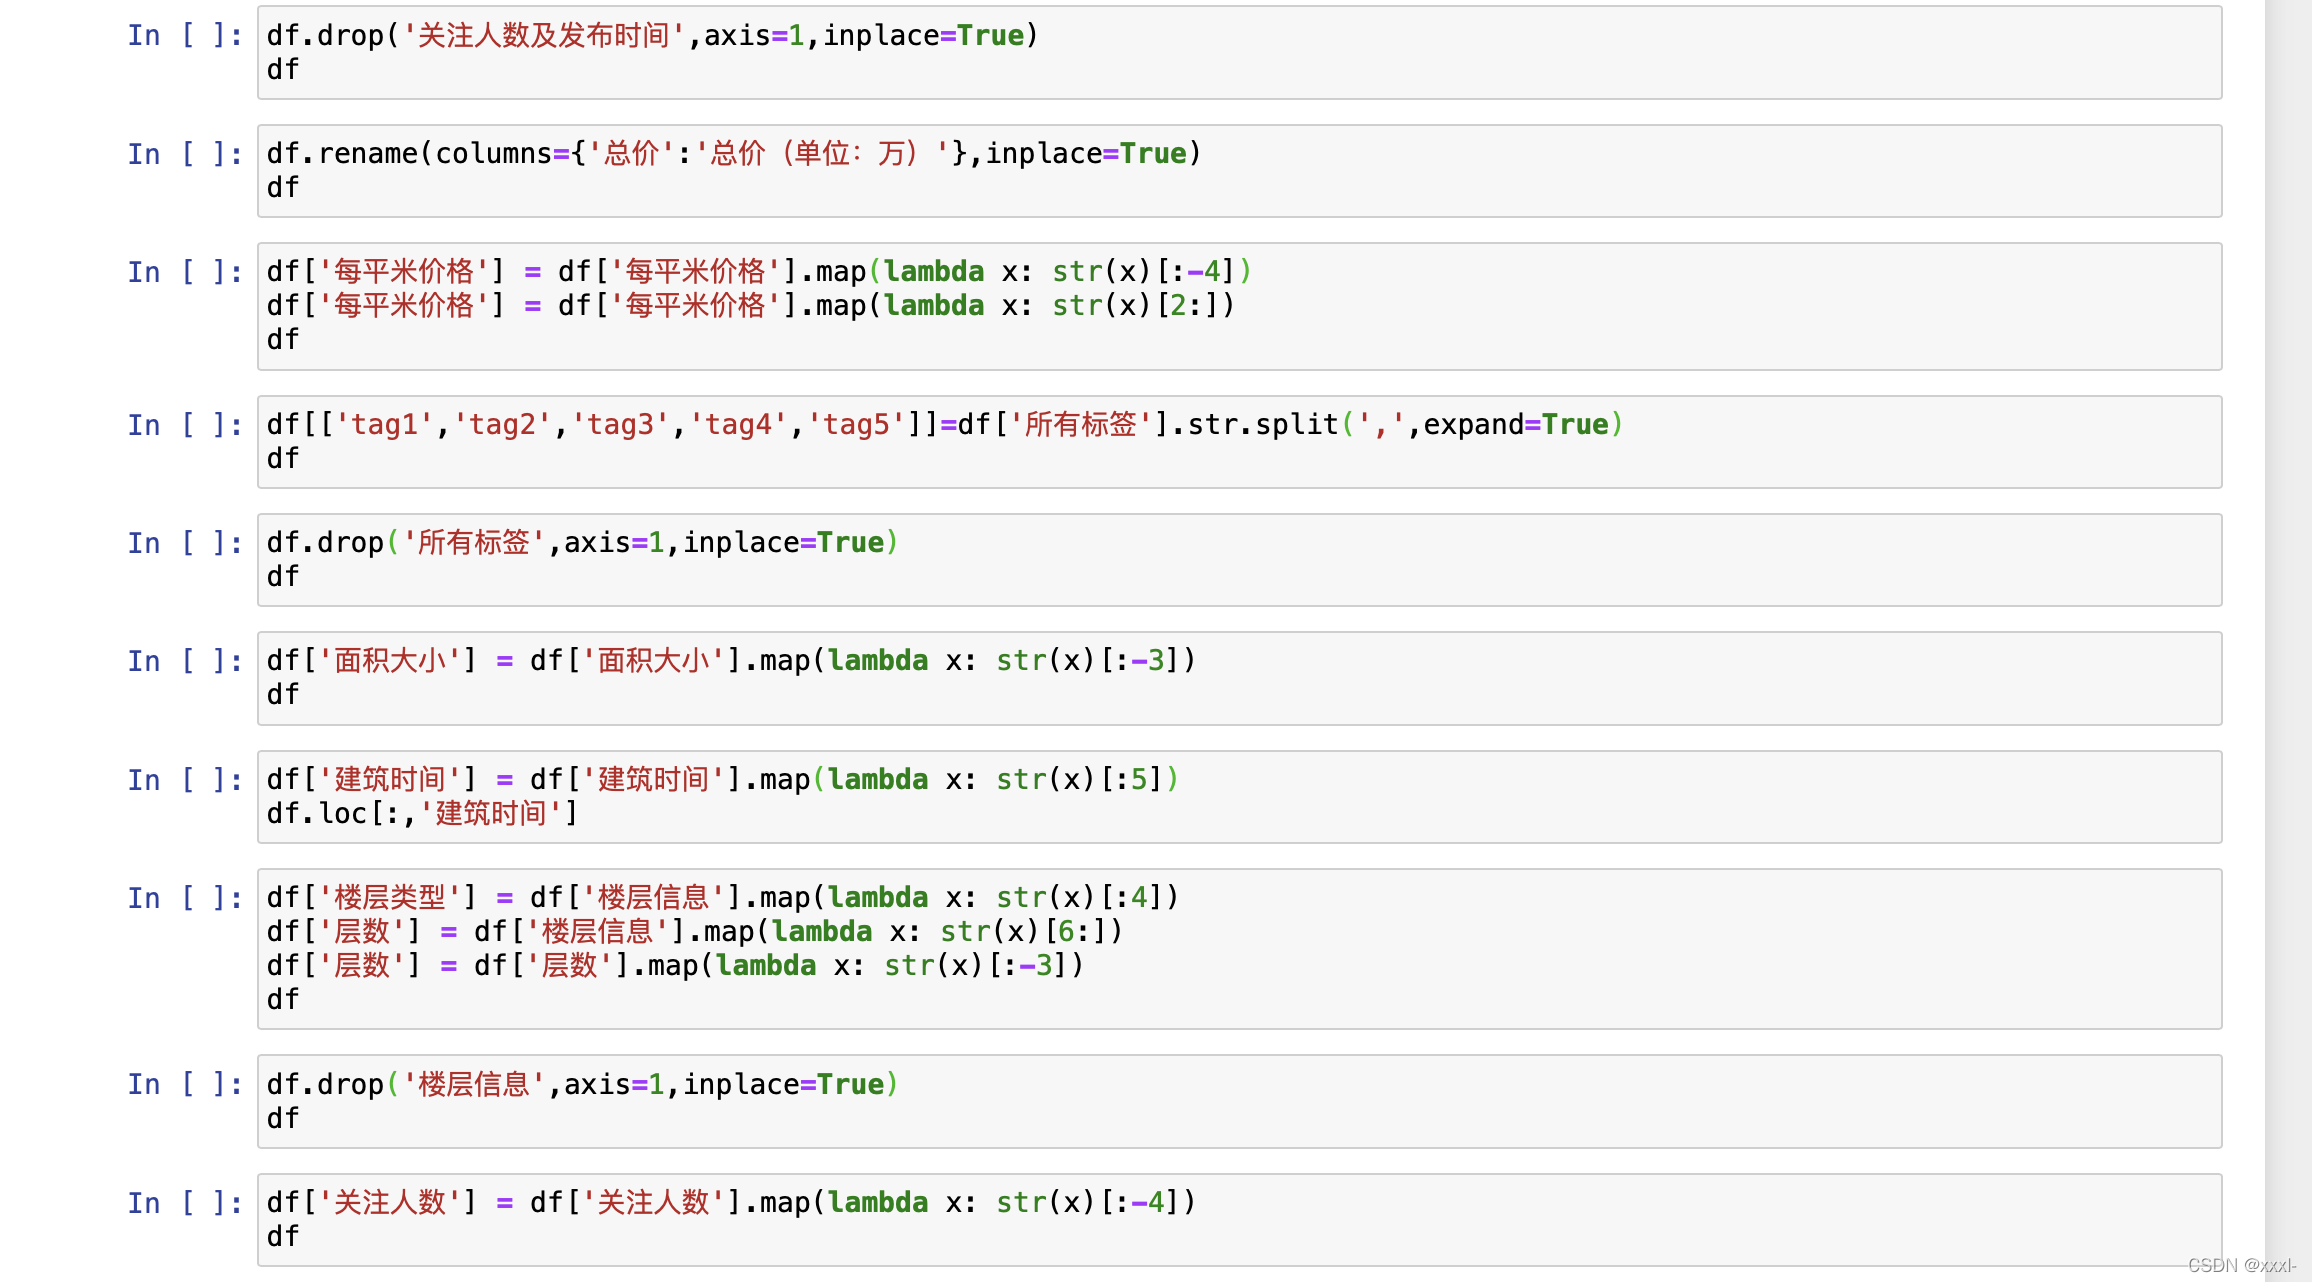
基本就是分片、将信息细分。
数据可视化
接下来是数据的可视化。引用了这些库、字体。
import pandas as pd
import numpy as np
import collectionsimport matplotlib.pyplot as plt
import seaborn as sns
import wordcloud
import jiebaplt.rcParams['font.sans-serif']=['FangSong']
plt.rcParams['axes.unicode_minus']=False
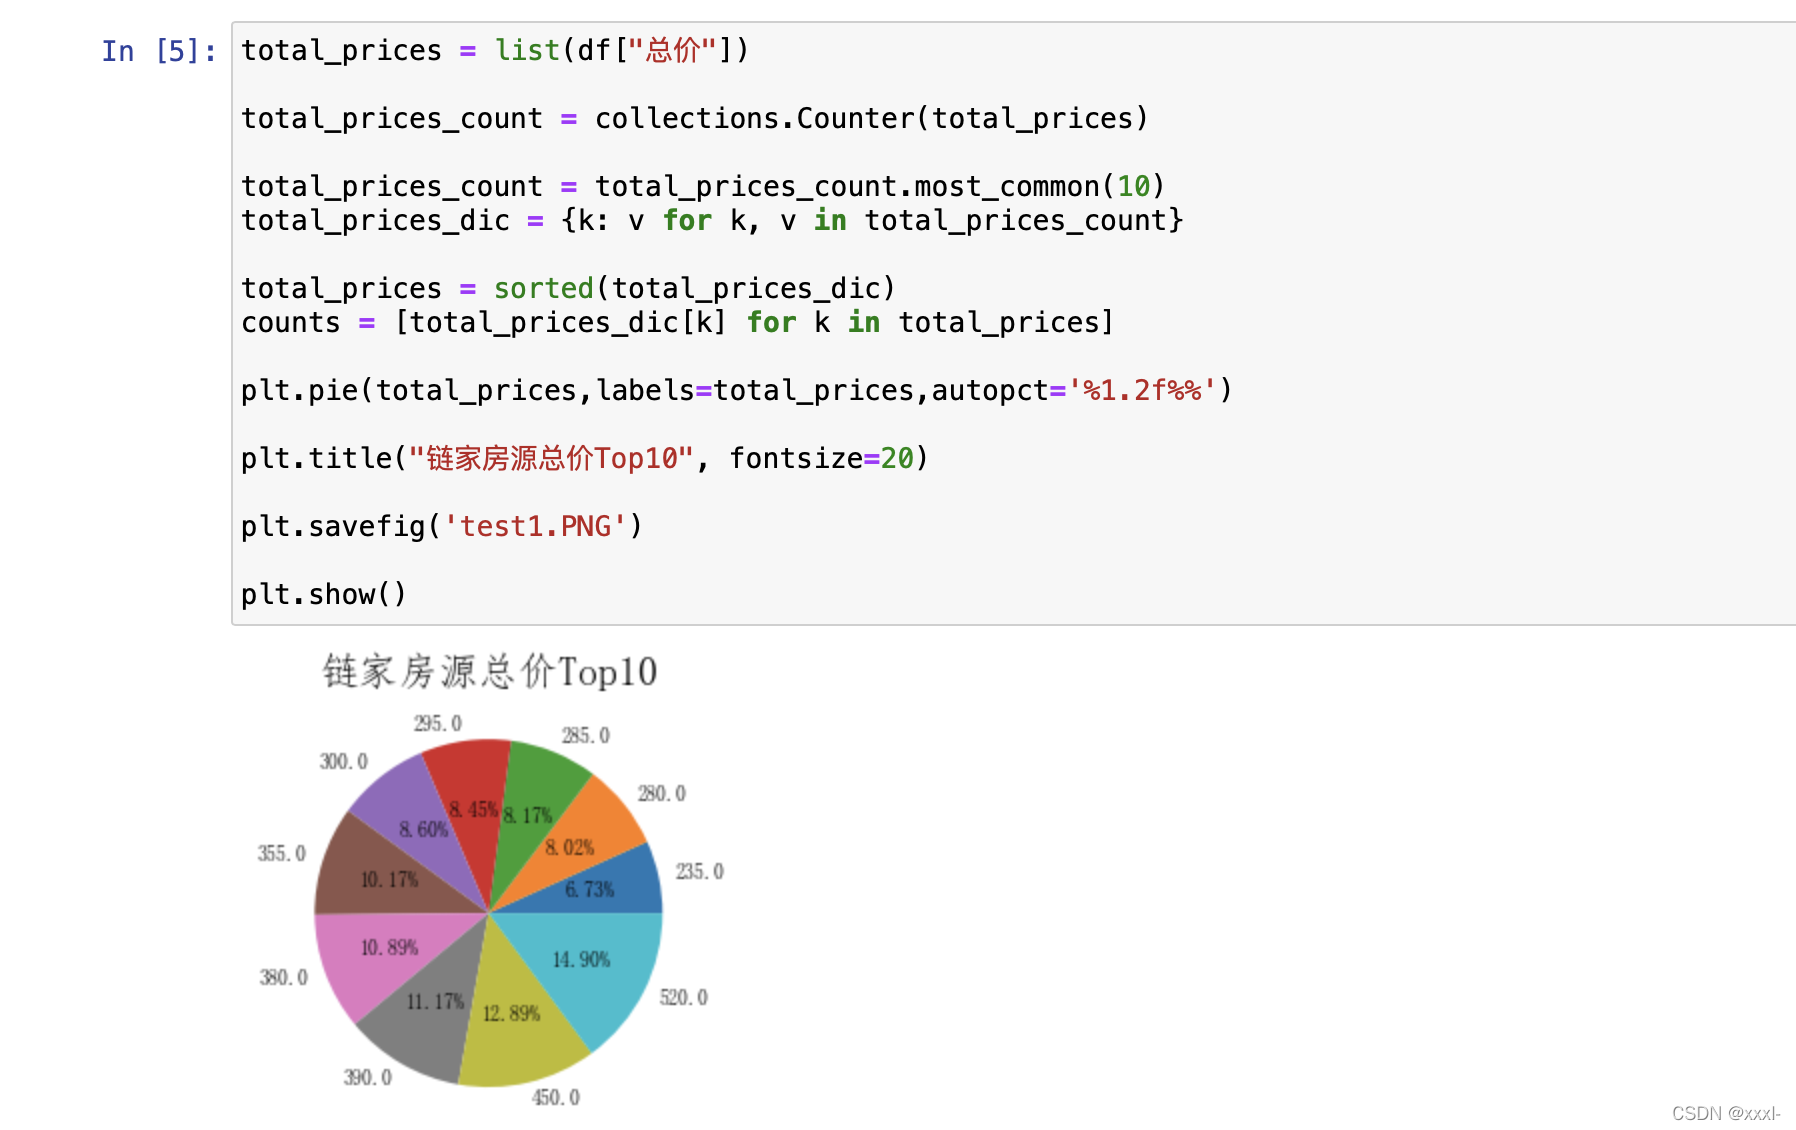
用matplot库完成普普通通总价饼状图:
total_prices = list(df["总价"])total_prices_count = collections.Counter(total_prices)total_prices_count = total_prices_count.most_common(10)
total_prices_dic = {k: v for k, v in total_prices_count}total_prices = sorted(total_prices_dic)
counts = [total_prices_dic[k] for k in total_prices]plt.pie(total_prices,labels=total_prices,autopct='%1.2f%%')plt.title("链家房源总价Top10", fontsize=20)plt.savefig('test1.PNG')plt.show()
将文本中词语出现的频率作为一个参数绘制词云图:
jieba–分词
wordcloud–词云
word_counts=list(df["标题"])
word = len(list(jieba.cut(str(word_counts), cut_all=False)))
from matplotlib.pyplot import imread
bg_pic = imread('爱心.jpg')
plt.imshow(bg_pic)
wordlist=''
for item in word_counts:wordlist+=item[0]+' '
wc = wordcloud.WordCloud(width=2000, height=800, font_path='simhei.ttf',                         background_color="white",                         max_words=1000,                                 max_font_size=50,       mask=bg_pic,   )wc.generate(wordlist)
wc.to_file('big.jpg')
plt.imshow(wc)
plt.axis('off')                                        plt.savefig('test3.PNG')
plt.show()


!!!注意:以上代码是在2021年5月完成的,现在不确定是否还能无差错爬取,如果链家网站之后有了变化,可以根据新的class名称进行爬取。
爬虫、数据清洗、数据可视化的思路分享给大家。
这篇关于二手房网站信息数据分析、数据可视化-基于python的crawl,jupyter notebook进行数据清洗和可视化。的文章就介绍到这儿,希望我们推荐的文章对编程师们有所帮助!


