本文主要是介绍NASA数据集——1983 ——2016 年期间北美森林地点的野外地块特征数据、衍生的地上和地下燃烧碳以及获取的火灾气象指数(FWI),希望对大家解决编程问题提供一定的参考价值,需要的开发者们随着小编来一起学习吧!
文件修订日期:2022-05-04
数据集版本: 1
简介
该数据集综合了 1983 年至 2016 年期间美国阿拉斯加、西北地区和加拿大萨斯喀彻温省被烧毁的北方森林地点的野外地块特征数据、衍生的地上和地下燃烧碳以及获取的火灾气象指数(FWI)系统组件。此外还包括未烧毁地块的数据。编译的地块级特征数据包括林分年龄、干扰历史、树木密度和树木生物物理测量值,用于计算地上(ag)和地下(bg)生物量/碳库、火灾前和火灾后残余土壤有机层(SOL)深度以及树木结构等级的燃烧估计值。此外,还提供了每个地点的测量坡度和坡向,以及根据地形分配的湿度等级。数据来自 1019 个燃烧过的地点和 152 个未燃烧过的地点。通过对燃烧的农业碳库和生物质碳库以及 SOL 损失的估算,计算出每个地块燃烧的总碳量、燃烧前碳量的比例以及燃烧后碳量占总碳量的比例。根据全球火灾气象数据库中的地块位置、燃烧年份和动态启动日期(燃烧日,DOB),从现有数据源获取每个地块的 FWI 系统组件,包括湿度和干旱代码以及火灾危险指数。土壤特性数据包含在一个单独的文件中。
野外研究横跨北美西部北方森林的六个生态区,捕捉了火灾前树木生产力、林龄和生态系统碳储存条件的广泛梯度。它还包括以 DOB 和 FWI 系统指数为代表的气象控制,以及火灾后残余土壤有机层深度的测量和燃烧深度的重建,以及上部和下部碳燃烧的重建。
该数据集包含两个逗号分隔(.csv)格式的数据文件。
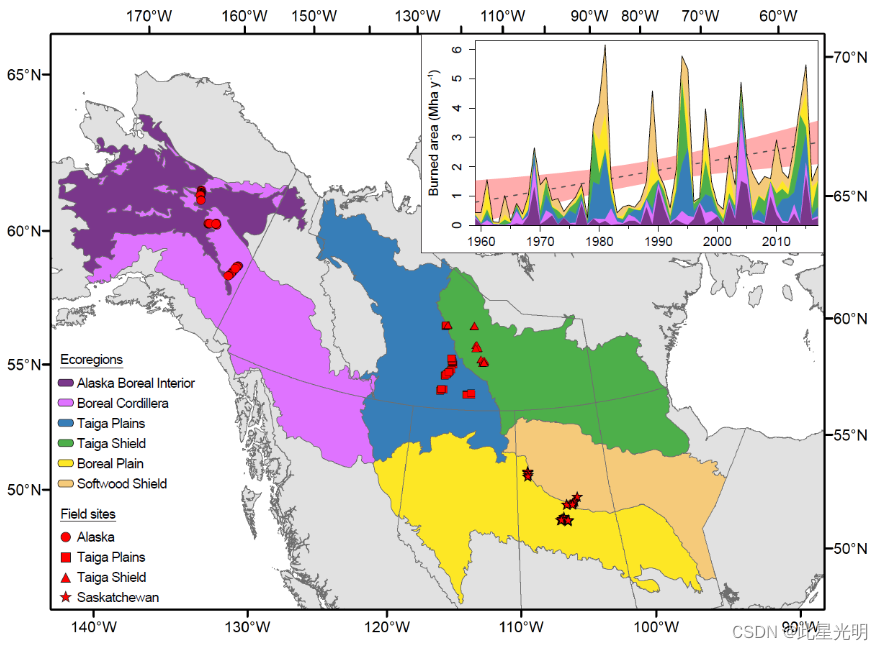
野外地点、生态区和研究区域内每个生态区的烧毁总面积(百万公顷)随时间变化的情况。插图中的灰色虚线表示所有生态区烧毁面积的简单线性回归,红色阴影表示 95% 的置信区间。分析使用野外地点分组完成,这些地点位于 EPA 北美二级生态区所定义的六个生态区内。资料来源:Walker 等人,2020 年:Walker 等人,2020 年。
数据特征
空间覆盖范围: 阿拉斯加和加拿大
上方参考位置:
域:核心和扩展
州/地区: 阿拉斯加和加拿大阿拉斯加和加拿大
网格单元(ABoVE 域中有 108 个单元):
ABoVE grid cells
| Ah1Av1Bh6Bv6Ch41Cv36 | Ah1Av1Bh7Bv7Ch42Cv45 | Ah1Av0Bh6Bv5Ch36Cv32 |
| Ah1Av0Bh7Bv3Ch44Cv23 | Ah1Av0Bh7Bv4Ch42Cv24 | Ah1Av0Bh7Bv4Ch43Cv24 |
| Ah1Av0Bh6Bv4Ch40Cv25 | Ah1Av0Bh6Bv4Ch41Cv26 | Ah1Av0Bh6Bv4Ch40Cv27 |
| Ah1Av0Bh6Bv4Ch40Cv28 | Ah1Av0Bh6Bv4Ch41Cv28 | Ah1Av0Bh6Bv4Ch38Cv29 |
| Ah1Av0Bh6Bv4Ch40Cv29 | Ah1Av0Bh6Bv4Ch41Cv29 | Ah1Av0Bh7Bv4Ch45Cv29 |
| Ah1Av0Bh6Bv5Ch39Cv30 | Ah1Av0Bh6Bv5Ch40Cv30 | Ah1Av0Bh6Bv5Ch41Cv30 |
| Ah1Av0Bh6Bv5Ch40Cv31 | Ah1Av0Bh6Bv5Ch38Cv32 | Ah1Av0Bh6Bv5Ch39Cv32 |
| Ah1Av0Bh6Bv5Ch40Cv32 | Ah1Av0Bh6Bv5Ch41Cv32 | Ah1Av0Bh7Bv5Ch42Cv32 |
| Ah1Av0Bh6Bv5Ch40Cv33 | Ah1Av0Bh7Bv5Ch43Cv33 | Ah1Av0Bh7Bv5Ch44Cv33 |
| Ah1Av0Bh7Bv5Ch45Cv33 | Ah1Av0Bh6Bv5Ch40Cv34 | Ah1Av0Bh6Bv5Ch41Cv34 |
| Ah1Av0Bh7Bv5Ch42Cv34 | Ah1Av0Bh7Bv5Ch45Cv34 | Ah1Av1Bh6Bv6Ch40Cv37 |
| Ah1Av1Bh6Bv6Ch40Cv38 | Ah1Av1Bh6Bv6Ch41Cv39 | Ah1Av1Bh6Bv6Ch41Cv40 |
| Ah1Av1Bh7Bv6Ch42Cv40 | Ah1Av1Bh7Bv6Ch46Cv40 | Ah1Av1Bh6Bv6Ch41Cv41 |
| Ah1Av1Bh7Bv6Ch43Cv41 | Ah1Av1Bh7Bv6Ch44Cv41 | Ah1Av1Bh7Bv6Ch45Cv41 |
| Ah1Av1Bh6Bv7Ch41Cv42 | Ah1Av1Bh7Bv7Ch42Cv42 | Ah1Av1Bh7Bv7Ch43Cv42 |
| Ah1Av1Bh7Bv7Ch42Cv43 | Ah1Av1Bh8Bv7Ch49Cv44 | Ah1Av1Bh7Bv7Ch43Cv45 |
| Ah1Av1Bh11Bv11Ch70Cv67 | Ah1Av1Bh11Bv11Ch71Cv68 | Ah2Av1Bh12Bv11Ch75Cv71 |
| Ah2Av1Bh12Bv11Ch76Cv71 | Ah2Av1Bh13Bv9Ch79Cv59 | Ah2Av1Bh13Bv9Ch80Cv59 |
| Ah2Av1Bh14Bv10Ch84Cv61 | Ah2Av1Bh13Bv10Ch83Cv64 | Ah2Av1Bh14Bv10Ch84Cv64 |
| Ah2Av1Bh13Bv10Ch79Cv65 | Ah2Av1Bh13Bv10Ch83Cv65 | Ah2Av1Bh14Bv10Ch84Cv65 |
| Ah2Av1Bh13Bv11Ch78Cv66 | Ah2Av1Bh13Bv11Ch79Cv66 | Ah2Av1Bh13Bv11Ch83Cv66 |
| Ah2Av1Bh14Bv11Ch84Cv66 | Ah2Av1Bh13Bv11Ch78Cv67 | Ah2Av1Bh13Bv11Ch79Cv67 |
| Ah2Av1Bh13Bv11Ch83Cv67 | Ah2Av1Bh14Bv11Ch84Cv67 | Ah2Av1Bh12Bv11Ch77Cv68 |
| Ah2Av1Bh13Bv11Ch78Cv68 | Ah2Av1Bh14Bv11Ch84Cv68 | Ah2Av1Bh12Bv11Ch73Cv69 |
| Ah2Av1Bh12Bv11Ch76Cv69 | Ah2Av1Bh12Bv11Ch74Cv70 | Ah2Av1Bh12Bv11Ch75Cv70 |
| Ah2Av1Bh12Bv11Ch76Cv70 | Ah2Av1Bh12Bv11Ch77Cv71 | Ah2Av2Bh13Bv12Ch79Cv73 |
| Ah2Av2Bh13Bv12Ch80Cv73 | Ah2Av2Bh13Bv12Ch80Cv74 | Ah2Av2Bh13Bv12Ch80Cv75 |
| Ah2Av2Bh13Bv12Ch81Cv75 | Ah2Av2Bh14Bv4Ch87Cv88 | Ah2Av2Bh13Bv4Ch82Cv89 |
| Ah2Av2Bh14Bv4Ch87Cv89 | Ah2Av2Bh13Bv5Ch82Cv90 | Ah2Av2Bh14Bv5Ch87Cv90 |
| Ah2Av2Bh15Bv5Ch95Cv95 | Ah2Av2Bh15Bv6Ch94Cv96 | Ah2Av2Bh15Bv6Ch92Cv97 |
| Ah2Av2Bh15Bv6Ch93Cv97 | Ah2Av2Bh15Bv6Ch94Cv97 | Ah2Av2Bh14Bv6Ch88Cv98 |
| Ah2Av2Bh15Bv6Ch91Cv99 | Ah2Av2Bh15Bv6Ch91Cv100 | Ah2Av2Bh15Bv6Ch92Cv100 |
| Ah2Av2Bh15Bv6Ch91Cv101 | Ah2Av2Bh15Bv6Ch92Cv101 | Ah2Av2Bh15Bv7Ch92Cv102 |
| Ah2Av2Bh12Bv12Ch75Cv72 | Ah2Av2Bh12Bv12Ch77Cv72 | Ah2Av2Bh13Bv12Ch78Cv72 |
| Ah3Av2Bh18Bv15Ch108Cv95 | Ah3Av2Bh18Bv5Ch109Cv95 | Ah3Av2Bh18Bv6Ch109Cv96 |
| Ah3Av2Bh21Bv7Ch128Cv104 | Ah3Av2Bh21Bv7Ch129Cv104 | Ah3Av2Bh21Bv7Ch129Cv105 |
空间分辨率:多点
时间覆盖范围1983-01-01 至 2016-08-08
时间分辨率可变
研究区域(所有经纬度均以十进制度表示)
| Site | Westernmost Longitude | Easternmost Longitude | Northernmost Latitude | Southernmost Latitude |
|---|---|---|---|---|
| Alaska and Canada | -150.902 | -88.61199 | 67.22972 | 53.19106 |
数据文件信息
该数据集有两个逗号分隔(.csv)格式的数据文件。
AK_CA_Burned_Plot_Data_1983_2016.csv.该文件汇编了 1983 年至 2016 年期间从阿拉斯加和加拿大烧毁和未烧毁地点的地块中收集的数据,以及从这些变量中得出的数据。
AK_CA_Soil_Profile_Synthesis.csv。该文件汇编了从烧毁和未烧毁地点的地块中收集的土壤数据。
表 2.AK_CA_Burned_Plot_Data_1983_2016.csv 中的变量。注:说明中的 * 表示由调查人员计算或分配的变量。FWI 系统的组成部分是根据每日天气条件计算得出的,包括三个燃料水分代码和三个火灾行为指数。
| Variable | Units | Description |
|---|---|---|
| project_id | Unique id associated with this project | |
| project_name | Project name | |
| treatment | Burned or control plot | |
| site | Site name/number | |
| burn_name | Name of fire site | |
| burn_year | YYYY | Year of burn |
| ecoregion_name_l2 | US EPA Ecoregion Level 2 (Ecoregions | US EPA) | |
| latitude | decimal degrees | Latitude. GPS. Datum: WSG84 Position format: ddd.ddddd |
| longitude | decimal degrees | Longitude. GPS. Datum: WSG84 Position format: ddd.ddddd |
| accuracy_horizontal | meters | Horizontal accuracy |
| elevation | meters | GPS. Meters above sea level |
| accuracy_vertical | meters | vertical accuracy |
| slope | degrees | Slope in degrees |
| aspect | degrees | Slope aspect in compass degrees (0 to 360) - has not been corrected for declination |
| moisture | unitless | Ranking of plot moisture potential using the moisture key presented in the successional trajectories workbook (Johnstone). Values range from 1 to 6, where 1=xeric, 2=subxeric, 3=subxeric to mesic, 4=mesic, 5=submesic, 6=subhygric |
| stand_density | stems/m2 | Estimated density of pre-fire stems per m2 for the pre-fire stand. All trees and saplings that were alive at the time fires are included |
| stand_basal_area | cm2/cm2 | Total measured basal area (cm2) of pre-fire tree species expressed on a per m2 basis. Basal area was calculated from stem diameter at breast height (area of each tree=pie(dbh/2)2) |
| prop_black_spruce | 0-1 | Proportion of black spruce trees in a site (range 0-1) |
| stand_age | year | Age of stand at time of fire - based on tree ring counts |
| stand_origin | Description of stand origin - e.g. fire, logging, unknown | |
| ag_biomass_prefire | g/m2 | Pre-fire aboveground biomass |
| ag_c_prefire | g C /m2 | Pre-fire above ground carbon pool |
| ag_biomass_combusted | g/m2 | Above-ground biomass combusted |
| ag_c_combusted | g C/m2 | Above-ground carbon pool combusted |
| prefire_sol | cm | Depth of pre-fire SOL calculated as the sum of the residual SOL and the SOL burn depth |
| mean_residual_org_layer_depth | cm | Mean of residual organic layer depth |
| burn_depth | cm | Depth of burn |
| prop_sol_combusted | 0-1 | Proportion of the soil organic layer combusted (depth of burn/pre-fire SOL) |
| residual_sol_c | g C/m2 | Residual SOL C |
| bg_c_prefire | g C/m2 | Pre-fire belowground carbon pool (g C m2) |
| bg_c_combusted | g C/m2 | Below-ground carbon combusted (g C m2) |
| prop_sol_c_combusted | 0-1 | Proportion of the soil organic layer C combusted (bg_c_combusted/bg_c_prefire) |
| total_c_pool_prefire | g c/m2 | Total pre-fire carbon pool. Sum of above and below ground pre-fire C pools |
| prop_prefire_bg_c | 0-1 | Proportion of the total pre-fire C pool attributed to the below-ground component (bg_c_prefire/total_c_pool_prefire) |
| total_c_combusted | g c/m2 | Total carbon combusted. Sum of above and below-ground C combusted * |
| prop_total_bg_c_combusted | 0-1 | Proportion of the total C combusted attributed to the below-ground component (bg_c_combusted/total_c_combusted) * |
| prop_total_prefire_c_combusted | 0-1 | Proportion of the total pre-fire C pool combusted (total_c_combusted/total_c_pool_prefire) * |
| dob | Day of Burn | |
| precipitation | mm | Precipitation - obtained from GFWED based on input variables from MERRA 2. MERRA 2 from Field et al. 2015 * |
| temperature | degree C | Temperature - obtained from GFWED based on input variables from MERRA 2. MERRA 2 from Field et al. 2015 * |
| relative_humidity | % | Relative Humidity - obtained from GFWED based on input variables from MERRA 2. MERRA 2 from Field et al. 2015 * |
| wind_speed | m/s | Wind speed obtained from GFWED based on input variables from MERRA 2. MERRA 2 from Field et al. 2015 * |
| drought_code | Drought Code (DC) - obtained from GFWED based on input variables from MERRA 2. MERRA 2 from Field et al. 2015 * | |
| drought_moisture_code | Drought Moisture Code (DMC) - obtained from GFWED based on input variables from MERRA 2. MERRA 2 from Field et al. 2015 * | |
| fine_fuel_moisture_code | Fine Fuel Moisture Code (FFMC) - obtained from GFWED based on input variables from MERRA 2. MERRA 2 from Field et al. 2015 * | |
| initial_spread_index | Initial Spread Index (ISI) - obtained from GFWED based on input variables from MERRA 2. MERRA 2 from Field et al. 2015 * | |
| buildup_index | Build-up Index (BUI) - obtained from GFWED based on input variables from MERRA 2. MERRA 2 from Field et al. 2015 * | |
| fire_weather_index | Fire Weather Index (FWI) - obtained from GFWED based on input variables from MERRA 2. MERRA 2 from Field et al. 2015 * | |
| daily_severity_rank | Daily Severity Ranking (DSR)- obtained from GFWED based on input variables from MERRA 2. MERRA 2 from Field et al. 2015 * |
AK_CA_Soil_Profile_Synthesis.csv 文件中的变量。
| Variable | Units | Description |
|---|---|---|
| site | Study site | |
| project_name | Project name of acquired data | |
| id | ID | |
| project_id | Unique id associated with this project | |
| plot | Plot name | |
| latitude | Decimal degrees | Latitude of site |
| longitude | Decimal degrees | Longitude of site |
| treatment | Burned or control (plot) | |
| profile | Soil profiles | |
| min_org | Mineral (min) or organic (org) soil. Mineral soil characteristics were only obtained from Boby et al. 2010 and were not included in any additional analyses | |
| horizon | Soil horizon | |
| raw_depth | cm | Depth in the profile (maximum depth in the profile) |
| adjusted_depth | cm | SOL profile depth measurements adjusted based on combusted (maximum depth in the profile) |
| sample_depth | cm | Sample depth |
| fine_coarse | How the soil was divided into coarse or fine fractions (0=no divide, 1=2mm) | |
| fine_bulk_density | g/cm3 | Fine soil bulk density |
| coarse_ bulk_density | g/cm3 | Coarse soil bulk density |
| total_ bulk_density | g/cm3 | Total bulk density |
| fine_carbon | % | Percent carbon content in fine soil |
| fine_nitrogen | % | Percent nitrogen content in fine soil |
| ph | Soil pH | |
| dry_matter | g/m2 | Grams of dry matter per m2= fine bulk density * sample depth *10 000 |
| carbon | g C/m2 | Grams of carbon per m2 = g.dry.matter.m2 * fine_c |
应用与推导
编制该数据集的目的是评估整个北美西北部寒带地区火灾碳排放的驱动因素。
质量评估
在所有研究中,计算基本遵循 Walker 等人 2018 年的方法。
数据采集、材料和方法
研究领域
研究人员从北美西部北方森林的 1,019 个烧毁地点和 152 个对照地点(即没有火灾历史记录)获取了数据,这些地点横跨六个不同的生态区,近几十年来,这些地区的烧毁面积有所增加(图 1)。研究地点位于阿拉斯加内陆北方地区、北方科迪勒拉山系、泰加平原、泰加盾林、软木盾林和北方平原等生态区域,这些生态区域在地质历史、土壤发育和母质以及年平均温度和降水量方面各不相同(Wang 等,2016 年)。 不同研究的地点选择和取样方法各不相同,但都提供了与火灾前树种组成、林龄、地形以及火灾前后地上和地下碳库相关的实地收集数据。
代码
!pip install leafmap
!pip install pandas
!pip install folium
!pip install matplotlib
!pip install mapclassifyimport pandas as pd
import leafmapurl = "https://github.com/opengeos/NASA-Earth-Data/raw/main/nasa_earth_data.tsv"
df = pd.read_csv(url, sep="\t")
dfleafmap.nasa_data_login()results, gdf = leafmap.nasa_data_search(short_name="ABoVE_Plot_Data_Burned_Sites_1744",cloud_hosted=True,bounding_box=(-150.9, 53.19, -88.61, 67.23),temporal=("2017-07-20", "2017-08-08"),count=-1,  # use -1 to return all datasetsreturn_gdf=True,
)gdf.explore()#leafmap.nasa_data_download(results[:5], out_dir="data")
引用
Walker, X.J., J.L. Baltzer, L.L. Bourgeau-Chavez, N.J. Day, W.J. De groot, C. Dieleman, E.E. Hoy, J.F. Johnstone, E.S. Kane, M.A. Parisien, S. Potter, B.M. Rogers, M.R. Turetsky, S. Veraverbeke, E. Whitman, and M.C. Mack. 2020. ABoVE: Synthesis of Burned and Unburned Forest Site Data, AK and Canada, 1983-2016. ORNL DAAC, Oak Ridge, Tennessee, USA. ABoVE: Synthesis of Burned and Unburned Forest Site Data, AK and Canada, 1983-2016, https://doi.org/10.3334/ORNLDAAC/1744
网址推荐
0代码在线构建地图应用
https://sso.mapmost.com/#/login?source_inviter=nClSZANO
机器学习
https://www.cbedai.net/xg
这篇关于NASA数据集——1983 ——2016 年期间北美森林地点的野外地块特征数据、衍生的地上和地下燃烧碳以及获取的火灾气象指数(FWI)的文章就介绍到这儿,希望我们推荐的文章对编程师们有所帮助!


