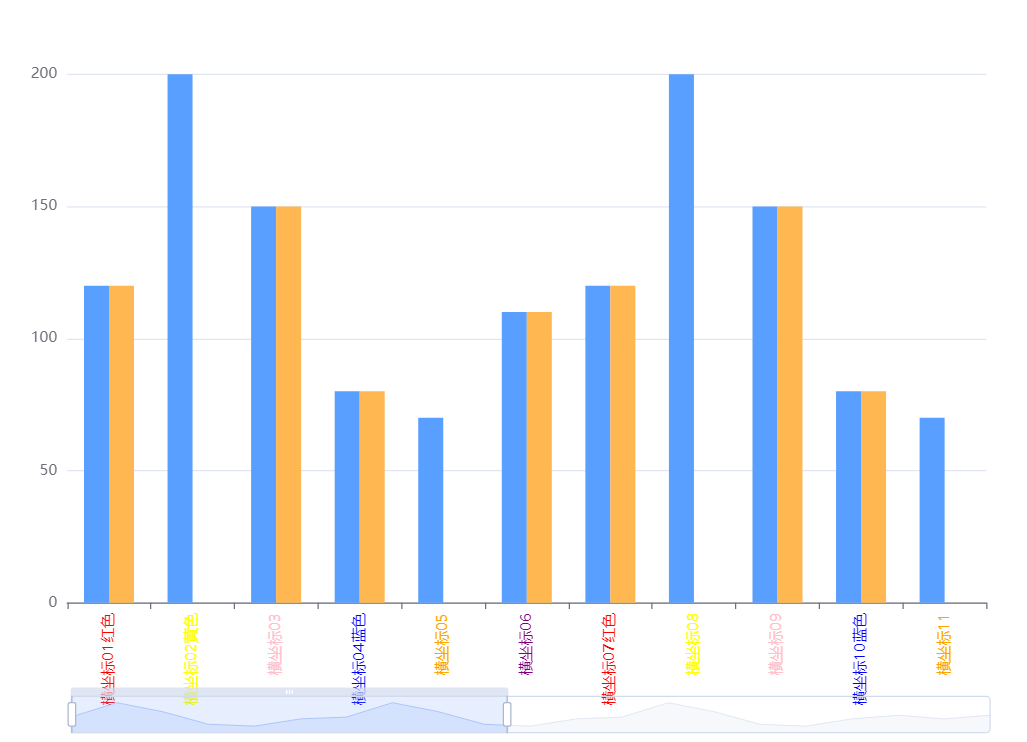
本文主要是介绍Echarts 添加横轴伸缩功能,并解决数据量过大情况下伸缩看起来错位问题,以及横坐标设置不同颜色,滑动时候文字颜色样式错位问题,希望对大家解决编程问题提供一定的参考价值,需要的开发者们随着小编来一起学习吧!
原有基础横轴伸缩功能
关键代码
dataZoom: [{type: 'inside',start: 0,end: 10},{start: 0,end: 10}],
完整代码,可以放到官方DEMO测试
myData = {nameData: [ // 橫坐標顯示的值'TEST-數據名字01','TEST-數據名字02','TEST-數據名字03','TEST-數據名字04','TEST-數據名字05','TEST-數據名字06', 'TEST-數據名字01','TEST-數據名字02','TEST-數據名字03','TEST-數據名字04','TEST-數據名字05','TEST-數據名字06', 'TEST-數據名字01','TEST-數據名字02','TEST-數據名字03','TEST-數據名字04','TEST-數據名字05','TEST-數據名字06','TEST-數據名字07'],pData: [120, 200, 150, 80, 70, 110,120, 200, 150, 80, 70, 110,120, 200, 150, 80, 70, 110, 130],rData: [120, 0, 150, 80, 0, 110, 120, 0, 150, 80, 0, 110, 120, 0, 150, 80, 0, 110, 130]}option = {toolbox: {feature: {saveAsImage: {}}},legend: {data: ['PP', 'RR'],right: 20,itemHeight: 10,itemWidth: 10,itemGap: 30,},// 配置了横坐标旋转,同一个X轴所属柱子间距,非同一个X轴柱子间距,上下左右距离,以及横坐标部分涂色tooltip: {trigger: 'axis',axisPointer: {type: 'cross',crossStyle: {color: '#999'}}},dataZoom: [{type: 'inside',start: 0,end: 30},{start: 0,end: 30}],grid: { top: '10%', left: '3%', right: '4%', bottom: '5%', containLabel: true },xAxis: {type: 'category',axisLabel: {interval: 0,rotate: 90,color: (value, index) => {// 柱狀圖用紅色框線return this.myData.rData[index] === 0 ? 'red' : 'black'}},data: this.myData.nameData},yAxis: {type: 'value'},series: [{name: 'Press',barWidth: 20, //设置柱子的宽度barGap: '0%' /*控制的是单个X坐标的多个柱子的间距*/,// barCategoryGap:'0%',/*控制非自己孩子之间的间距*/data: this.myData.pData,itemStyle: {normal: {color: '#599fff'}},type: 'bar'},{name: 'Robot',barWidth: 20, //设置柱子的宽度data: this.myData.rData,itemStyle: {normal: {color: '#ffb752'}},type: 'bar'}]}
官方在线调试 https://echarts.apache.org/examples/zh/editor.html?c=line-simple
今天是第二天,经过我们的测试,横坐标加颜色以及缩小放大的时候,这个功能会出现错位的情况,文字样式颜色不会随着数据位置变化,于是代码做了以下调整
方法:根据数据长度计算设定展开比例,然后锁定datazoom,同时单个设横坐标数据的textStyle就不会影响横坐标的名字颜色显示异常,同时我们可以考虑通过获取datazoom事件来获取坐标移动后的数据开始index和结束index来进行一些其他的需求处理
- 关键代码 设置比例,以及颜色要单独设置
- 备注:锁定datazoom可以根据需求去掉哦~~~

myData = {nameData: [{ value: '横坐标01红色', textStyle: { color: 'red' } },{ value: '横坐标02黄色', textStyle: { color: 'yellow' } },{ value: '横坐标03', textStyle: { color: 'pink' } },{ value: '横坐标04蓝色', textStyle: { color: 'blue' } },{ value: '横坐标05', textStyle: { color: 'orange' } },{ value: '横坐标06', textStyle: { color: 'purple' } },{ value: '横坐标07红色', textStyle: { color: 'red' } },{ value: '横坐标08', textStyle: { color: 'yellow' } },{ value: '横坐标09', textStyle: { color: 'pink' } },{ value: '横坐标10蓝色', textStyle: { color: 'blue' } },{ value: '横坐标11', textStyle: { color: 'orange' } },{ value: '横坐标12红色', textStyle: { color: 'red' } },{ value: '横坐标13', textStyle: { color: 'yellow' } },{ value: '横坐标14', textStyle: { color: 'pink' } },{ value: '横坐标15蓝色', textStyle: { color: 'blue' } },{ value: '横坐标16', textStyle: { color: 'orange' } },{ value: '横坐标17红色', textStyle: { color: 'red' } },{ value: '横坐标18', textStyle: { color: 'yellow' } },{ value: '横坐标19', textStyle: { color: 'pink' } },{ value: '横坐标20蓝色', textStyle: { color: 'blue' } },{ value: '横坐标21', textStyle: { color: 'orange' } },],pData: [120,200,150,80,70,110,120,200,150,80,70,110,120,200,150,80,70,110,130,110,130,],rData: [120,0,150,80,0,110,120,0,150,80,0,110,120,0,150,80,0,110,130,0,0,],
}
// 默认展示10条数据,多于20条就控制一下比例
dataZoom_end =myData.nameData.length > 10 ? (10 / myData.nameData.length) * 100 : 100
//默认显示10条数据(当数据多余20条时)soption = {toolbox: {feature: {saveAsImage: {},},},legend: {data: ['PP', 'RR'],right: 20,itemHeight: 10,itemWidth: 10,itemGap: 30,},// 配置了横坐标旋转,同一个X轴所属柱子间距,非同一个X轴柱子间距,上下左右距离,以及横坐标部分涂色tooltip: {trigger: 'axis',axisPointer: {type: 'cross',crossStyle: {color: '#999',},},},dataZoom: [{type: 'slider',show: true,xAxisIndex: [0],start: 0,zoomLock: true,end: dataZoom_end,},{type: 'inside',show: true,xAxisIndex: [0],start: 0,zoomLock: true,end: dataZoom_end,},],grid: {top: '10%',left: '3%',right: '4%',bottom: '5%',containLabel: true,},xAxis: {type: 'category',axisLabel: {interval: 0,rotate: 90,color: (value, index) => {// 柱狀圖用紅色框線return myData.rData[index] === 0 ? 'red' : 'black'},},data: myData.nameData,},yAxis: {type: 'value',},series: [{name: 'Press',barWidth: 20, //设置柱子的宽度barGap: '0%' /*控制的是单个X坐标的多个柱子的间距*/,//   barCategoryGap:'0%',/*控制非自己孩子之间的间距*/data: this.myData.pData,itemStyle: {normal: {color: '#599fff',},},type: 'bar',},{name: 'Robot',barWidth: 20, //设置柱子的宽度data: this.myData.rData,itemStyle: {normal: {color: '#ffb752',},},type: 'bar',},],
}
myChart.on('datazoom', (params) => {//监听echarts的拖动事件// that.dataZoomloading=trueconsole.log(myChart)let xAxis = myChart._model.option.dataZoom[0]let startrang = xAxis.startValuelet endrang = xAxis.endValueconsole.log('start', startrang)console.log('endrang', endrang)
})
这篇关于Echarts 添加横轴伸缩功能,并解决数据量过大情况下伸缩看起来错位问题,以及横坐标设置不同颜色,滑动时候文字颜色样式错位问题的文章就介绍到这儿,希望我们推荐的文章对编程师们有所帮助!


