本文主要是介绍文献速递:深度学习疾病预后--临床级计算病理学使用基于整张切片图像的弱监督深度学习,希望对大家解决编程问题提供一定的参考价值,需要的开发者们随着小编来一起学习吧!
Title
题目
Clinical-grade computational pathology using weakly supervised deep learning on whole slide images
临床级计算病理学使用基于整张切片图像的弱监督深度学习
01
文献速递介绍
The development of decision support systems for pathology and their deployment in clinical practice have been hindered by the need for large manually annotated datasets. To overcome this problem, we present a multiple instance learning-based deep learning system that uses only the reported diagnoses as labels for training, thereby avoiding expensive and time-consuming pixel-wise manual annotations. We evaluated this framework at scale on a dataset of 44,732 whole slide images from 15,187 patients without any form of data curation. Tests on prostate cancer, basal cell carcinoma and breast cancer metastases to axillary lymph nodes resulted in areas under the curve above 0.98 for all cancer types. Its clinical application would allow pathologists to exclude 65–75% of slides while retaining 100% sensitivity. Our results show that this system has the ability to train accurate classification models at unprecedented scale, laying the foundation for the deployment of computational decision support systems in clinical practice.
病理学决策支持系统的开发及其在临床实践中的部署受到了以下因素的阻碍 需要大量手工标注的数据集。为了克服这个问题,我们提出了一个基于多示例学习的深度学习系统,该系统仅使用报告诊断作为训练标签,从而避免了昂贵且耗时的像素级手动注释。我们在一个包含44,732张全幅切片图像、来自15,187名患者的数据集上对这一框架进行了大规模评估。在前列腺癌、基底细胞癌和乳腺癌转移至腋窝淋巴结的测试中,所有癌症类型的曲线下面积均超过0.98。其临床应用将允许病理医生在保持100%敏感性的同时排除65-75%的切片。我们的结果显示,这一系统具有在前所未有的规模上训练准确分类模型的能力,为在临床实践中部署计算机辅助决策支持系统奠定了基础。
Results
结果
Test performance of ResNet34 models trained with MIL for each tissue type. We trained ResNet34 models to classify tiles using MIL. At test time, a slide is predicted positive if at least one tile is pre dicted positive within that particular slide. This slide-level aggrega tion derives directly from the standard multiple instance assumption and is generally referred to as max-pooling. Performance on the test set was measured for models trained at different magnifications for each dataset (Extended Data Fig. 2). Histology contains informa tion at different scales, and pathologists review patient tissue on glass slides at varying zoom levels. For example, in prostate histo pathology, architectural and cytological features are both important for diagnosis and are more easily appreciated at different magni fications. For prostate, the highest magnification consistently gave better results (Extended Data Fig. 2a), while for BCC detection,5× magnification showed higher accuracy (Extended Data Fig. 2b). Interestingly, the error modes on the test set across magnifica tion conditions were complementary: in prostate, the 20× model performed better in terms of false negatives, while the 5× model performed better on false positives. Simple ensemble models were generated by max-pooling the response across the different magni fications. We note that these naive multiscale models outperformed the single-scale models for the prostate dataset in terms of accu racy and area under the curve (AUC), but not for the other datasets. Models trained at 20× achieved AUCs of 0.986, 0.986 and 0.965 on the test sets of the prostate, BCC and axillary lymph node datasets, respectively, highlighting the efficacy of the proposed method in discerning tumor regions from benign regions in a wide variety of tissue types.
针对每种组织类型使用MIL训练的ResNet34模型的测试性能。我们训练ResNet34模型使用MIL对瓦片进行分类。在测试时,如果一个幻灯片中至少有一个瓦片被预测为正,那么这个幻灯片被预测为正。这种幻灯片级别的聚合直接源于标准的多实例假设,通常被称为最大池化。在不同放大倍数下训练的模型的测试集上的性能被测量,针对每个数据集(扩展数据图2)。组织学包含不同尺度的信息,病理学家在不同的缩放级别下检查玻璃幻灯片上的患者组织。例如,在前列腺组织病理学中,建筑学和细胞学特征对诊断都很重要,并且在不同的放大倍数下更容易被识别。对于前列腺,最高放大倍数一致地提供了更好的结果(扩展数据图2a),而对于BCC检测,5×放大倍数显示出更高的准确性(扩展数据图2b)。
有趣的是,测试集上不同放大条件下的错误模式是互补的:在前列腺中,20×模型在假阴性方面表现得更好,而5×模型在假阳性上表现得更好。通过对不同放大倍数的响应进行最大池化,生成了简单的集成模型。我们注意到,这些简单的多尺度模型在准确性和曲线下面积(AUC)方面,超过了单尺度模型,对于前列腺数据集而言,但对于其他数据集则不是。在前列腺、BCC和腋窝淋巴结数据集的测试集上,以20×训练的模型分别达到了0.986、0.986和0.965的AUC,突显了所提出方法在鉴别多种组织类型中的肿瘤区域与良性区域的有效性。
Fig
图

Fig. 1 | Overview of the data and proposed deep learning framework presented in this study. a, Description of the datasets. This study is based on a total of 44,732 slides from 15,187 patients across three different tissue types: prostate, skin and axillary lymph nodes. The prostate dataset was divided into in-house slides and consultation slides to test for staining bias. The class imbalance varied from 1:4 for prostate to 1:3 for breast. A total of 17,661 slides were submitted to MSK from more than 800 outside institutions in 45 countries for a second opinion. To put the size of our dataset into context, the last column shows a comparison, in terms of the pixel count, with ImageNet—the state of the art in computer vision, containing over 14 million images. b, Left, hematoxylin and eosin slide of a biopsy showing prostatic adenocarcinoma. The diagnosis can be based on very small foci of cancer that account for <1% of the tissue surface. In the slide to the left, only about six small tumor glands are present. The right-most image shows an example of a malignant gland. Its relation to the entire slide is put in perspective to reiterate the difficulty of the task. c, The MIL training procedure includes a full inference pass through
the dataset, to rank the tiles according to their probability of being positive, and learning on the top-ranking tiles per slide. CNN, convolutional neural network. d, Slide-level aggregation with a recurrent neural network (RNN). The S most suspicious tiles in each slide are sequentially passed to the RNN to predict the final slide-level classification.
图1 | 本研究中提出的数据概览和深度学习框架。a,数据集的描述。本研究基于来自15,187名患者的44,732张幻灯片,涵盖三种不同的组织类型:前列腺、皮肤和腋窝淋巴结。前列腺数据集被分为内部幻灯片和咨询幻灯片,以测试染色偏差。类别不平衡从前列腺的1:4变化到乳腺的1:3。共有17,661张幻灯片从45个国家的800多个外部机构提交给MSK,以求第二意见。为了将我们的数据集大小放入上下文中,最后一列显示了与ImageNet(计算机视觉中的最新技术,包含超过1400万图像)的像素计数比较。b,左侧,一张生物切片的苏木精和伊红染色幻灯片,显示前列腺腺癌。诊断可以基于占组织表面<1%的非常小的癌症焦点。在左侧的幻灯片中,只有大约六个小肿瘤腺体。最右侧的图像展示了一个恶性腺体的例子。它与整个幻灯片的关系被放入视角中,以重申任务的难度。c,MIL训练程序包括通过数据集的完整推理过程,根据它们被判定为阳性的概率对瓦片进行排名,并在每张幻灯片的排名最高的瓦片上进行学习。CNN,卷积神经网络。d,使用循环神经网络(RNN)进行幻灯片级别聚合。每张幻灯片中最可疑的S个瓦片依次传递给RNN,以预测最终的幻灯片级别分类。
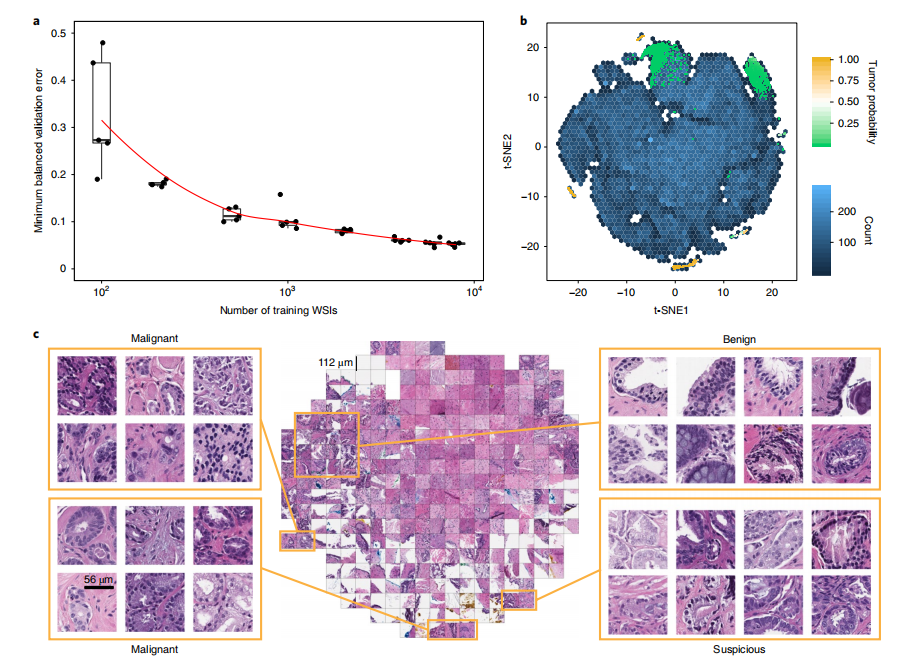
Fig. 2 | Dataset size impact and model introspection. a, Dataset size plays an important role in achieving clinical-grade MIL classification performance.
Training of ResNet34 was performed with datasets of increasing size; for every reported training set size, five models were trained, and the validation errors are reported as box plots (n= 5). This experiment underlies the fact that a large number of slides are necessary for generalization of learning under the MIL assumption. b,c, The prostate model has learned a rich feature representation of histopathology tiles. b, A ResNet34 model trained at 20×was used to obtain the feature embedding before the final classification layer for a random set of tiles in the test set (n= 182,912). The embedding was reduced to two dimensions with t-SNE and plotted using a hexagonal heat map. Top-ranked tiles coming from negative and positive slides are represented by points colored by their tumor probability. c, Tiles corresponding to points in the two-dimensional t-SNE space were randomly sampled from different regions. Abnormal glands are clustered together on the bottom and left sides of the plot. A region of tiles with a tumor probability of ~0.5 contains glands with features suspicious for prostatic adenocarcinoma. Normal glands are clustered on the top left region of the plot.a, Dataset size plays an important role in achieving clinical-grade MIL classification performance. Training of ResNet34 was performed with datasets of increasing size; for every reported training set size, five models were trained, and the validation errors are reported as box plots (n= 5). This experiment underlies the fact that a large number of slides are necessary for generalization of learning under the MIL assumption. b,c, The prostate model has learned a rich feature representation of histopathology tiles. b, A ResNet34 model trained at 20× was used to obtain the feature embedding before the final classification layer for a random set of tiles in the test set (n= 182,912). The embedding was reduced to two dimensions with t-SNE and plotted using a hexagonal heat map. Top-ranked tiles coming from negative and positive slides are represented by points colored by their tumor probability. c, Tiles corresponding to points in the two dimensional t-SNE space were randomly sampled from different regions. Abnormal glands are clustered together on the bottom and left sides of the plot. A region of tiles with a tumor probability of ~0.5 contains glands with features suspicious for prostatic adenocarcinoma. Normal glands are clustered on the top left region of the plot.
图2 | 数据集大小的影响及模型内省。a,数据集大小在实现临床级MIL分类性能中扮演着重要角色。
使用不断增大的数据集对ResNet34进行了训练;对于每个报告的训练集大小,训练了五个模型,并以箱线图报告验证错误(n=5)。这个实验表明,为了在MIL假设下实现学习的泛化,需要大量的幻灯片。b,c,前列腺模型学习到了组织病理学瓦片的丰富特征表示。b,一个在20×下训练的ResNet34模型被用来获取测试集中一组随机瓦片的最终分类层之前的特征嵌入(n=182,912)。这个嵌入被通过t-SNE降至二维,并使用六边形热图进行了绘制。来自阴性和阳性幻灯片的排名最高的瓦片由其肿瘤概率着色的点表示。c,对应于二维t-SNE空间中点的瓦片从不同区域随机抽样。异常腺体在图的底部和左侧聚集在一起。一个肿瘤概率约为0.5的瓦片区域包含具有前列腺腺癌可疑特征的腺体。正常腺体聚集在图的左上区域。

Fig. 3 | Weakly supervised models achieve high performance across all tissue types. The performances of the models trained at 20× magnification on the respective test datasets were measured in terms of AUC for each tumor type. a, For prostate cancer (n= 1,784) the MIL-RNN model significantly (P< 0.001) outperformed the model trained with MIL alone, resulting in an AUC of 0.991. b,c, The BCC model (n= 1,575) performed at 0.988 (b), while breast metastases detection (n= 1,473) achieved an AUC of 0.966 (c). For these latter datasets, adding an RNN did not significantly improve performance.Statistical significance was assessed using DeLong’s test for two correlated ROC curves.
data, but its performance was not better than that achieved by the single-scale model trained at 20×.
图3 | 弱监督模型在所有组织类型中实现高性能。以20×放大倍数训练的模型在各自的测试数据集上的表现,按照每种肿瘤类型的AUC来衡量。a,对于前列腺癌(n=1,784),MIL-RNN模型显著地(P<0.001)优于仅使用MIL训练的模型,结果显示AUC为0.991。b,c,BCC模型(n=1,575)的表现为0.988(b),而乳腺转移检测(n=1,473)实现了0.966的AUC(c)。对于这些后续数据集,增加RNN并没有显著提高性能。使用DeLong测试评估了两个相关ROC曲线的统计显著性。但其性能并不优于以20×单一尺度训练的模型。
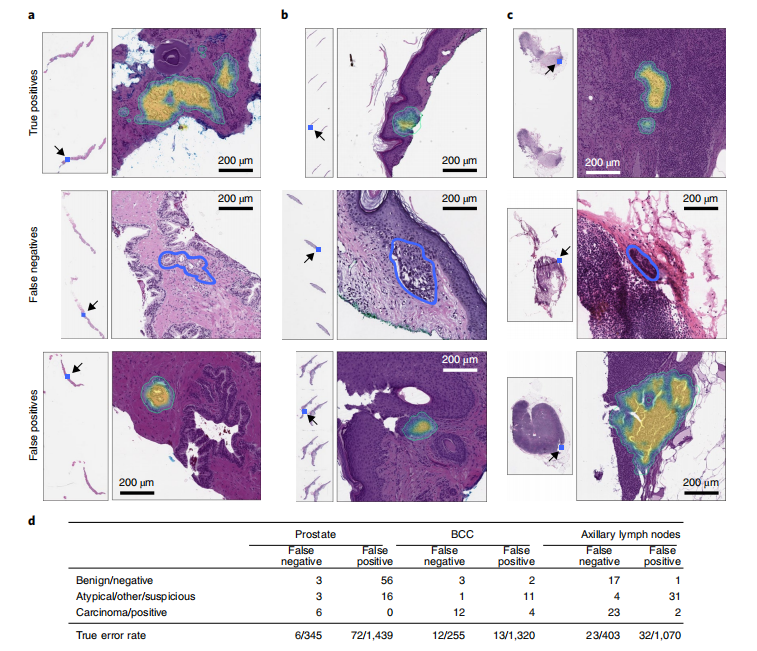
Fig. 4 | Pathology analysis of the misclassification errors on the test sets. a–c, Randomly selected examples of classification results on the test set. Examples of true positive, false negative and false positive classifications are shown for each tumor type. The MIL-RNN model trained at 20× magnification was run with a step size of 20 pixels across a region of interest, generating a tumor probability heat map. On every slide, the blue square represents the enlarged area. For the prostate dataset (a), the true positive represents a difficult diagnosis due to tumor found next to atrophy and inflammation; the false negative shows a very low tumor volume; and for the false positive the model identified atypical small acinar proliferation, showing a small focus of glands with atypical epithelial cells. For the BCC dataset (b), the true positive has a low tumor volume; the false negative has a low tumor volume; and for the false positive the tongue of the epithelium abutting from the base of the epidermis shows an architecture similar to BCC. For the axillary lymph nodes dataset (c), the true positive shows ITCs with a neoadjuvant chemotherapy treatment effect; the false negative shows a slightly out of focus cluster of ITCs missed due to the very low tumor volume and blurring; and the false positive shows displaced epithelium/benign papillary inclusion in a lymph node. d, Subspecialty pathologists analyzed the slides that were misclassified by the MIL-RNN models. While slides can either be positive or negative for a specific tumor, sometimes it is not possible to diagnose a single slide with certainty based on morphology alone. These cases were grouped into the categories ‘atypical’ and ‘suspicious’ for prostate and breast lesions, respectively. The ‘other’ category consisted of skin biopsies that contained tumors other than BCC. We observed that some of the misclassifications stem from incorrect ground truth labels.
图4 | 测试集上误分类错误的病理分析。a–c,测试集上分类结果的随机选定示例。每种肿瘤类型都展示了真阳性、假阴性和假阳性分类的示例。以20×放大倍数训练的MIL-RNN模型以20像素的步长在感兴趣区域上运行,生成肿瘤概率热图。在每张幻灯片上,蓝色方块代表放大区域。对于前列腺数据集(a),真阳性代表一个难以诊断的案例,因为肿瘤位于萎缩和炎症旁边;假阴性显示非常低的肿瘤体积;对于假阳性,模型识别了非典型小腺体增生,显示具有非典型上皮细胞的小腺体焦点。对于BCC数据集(b),真阳性的肿瘤体积低;假阴性的肿瘤体积低;对于假阳性,从表皮基底凸出的上皮舌显示了与BCC类似的结构。对于腋窝淋巴结数据集(c),真阳性显示有新辅助化疗治疗效果的ITCs;假阴性由于非常低的肿瘤体积和模糊而错过了略微失焦的ITCs簇;假阳性显示在淋巴结中位移的上皮/良性乳头状包含体。d,亚专业病理学家分析了被MIL-RNN模型误分类的幻灯片。虽然幻灯片可能对特定肿瘤呈阳性或阴性,但有时仅基于形态学就不可能确诊单张幻灯片。这些案例被归类为前列腺和乳腺病变的“非典型”和“可疑”类别。"其他"类别由包含非BCC肿瘤的皮肤活检组成。我们观察到,一些误分类源于不正确的真实标签。

Fig. 5 | Weak supervision on large datasets leads to higher generalization performance than fully supervised learning on small curated datasets. The generalization performance of the proposed prostate and breast models were evaluated on different external test sets. a, Results of the prostate modeltrained with MIL on MSK in-house slides and tested on: (1) the in-house test set (n= 1,784) digitized on Leica Aperio AT2 scanners; (2) the in-house test set digitized on a Philips Ultra Fast Scanner (n= 1,274); and (3) external slides submitted to MSK for consultation (n= 12,727). Performance in terms of AUC decreased by 3 and 6% for the Philips scanner and external slides, respectively. b, Comparison of the proposed MIL approach with state-of-the-art
fully supervised learning for breast metastasis detection in lymph nodes. Left, the model was trained on MSK data with our proposed method (MIL-RNN) and tested on the MSK breast data test set (n= 1,473) and on the test set of the CAMELYON16 challenge (n= 129), showing a decrease in AUC of 7%. Right, a fully supervised model was trained following ref. 18 on CAMELYON16 training data. While the resulting model would have won the CAMELYON16 challenge (n= 129), its performance drops by over 20% when tested on a larger test set representing real-world clinical cases (n= 1,473). Error bars represent 95% confidence intervals for the true AUC calculated by bootstrapping each test set.
图5 | 大数据集上的弱监督学习相比于小型精选数据集上的全监督学习导致更高的泛化性能。提出的前列腺和乳腺模型的泛化性能在不同的外部测试集上进行了评估。a,在MSK内部幻灯片上使用MIL训练的前列腺模型的结果,测试对象包括:(1)在Leica Aperio AT2扫描仪上数字化的内部测试集(n=1,784);(2)在Philips Ultra Fast Scanner上数字化的内部测试集(n=1,274);以及(3)提交给MSK咨询的外部幻灯片(n=12,727)。就AUC而言,性能分别对于Philips扫描仪和外部幻灯片下降了3%和6%。b,将提出的MIL方法与乳腺淋巴结转移检测的最新全监督学习方法进行比较。左侧,模型在MSK数据上采用我们提出的方法(MIL-RNN)进行训练,并在MSK乳腺数据测试集(n=1,473)以及CAMELYON16挑战的测试集(n=129)上进行测试,显示AUC下降了7%。右侧,一个全监督模型根据参考文献18在CAMELYON16训练数据上进行训练。尽管结果模型在CAMELYON16挑战中可能获胜(n=129),但当在代表真实世界临床案例的更大测试集(n=1,473)上测试时,其性能下降了超过20%。误差条表示通过对每个测试集进行自助采样计算得出的真实AUC的95%置信区间。
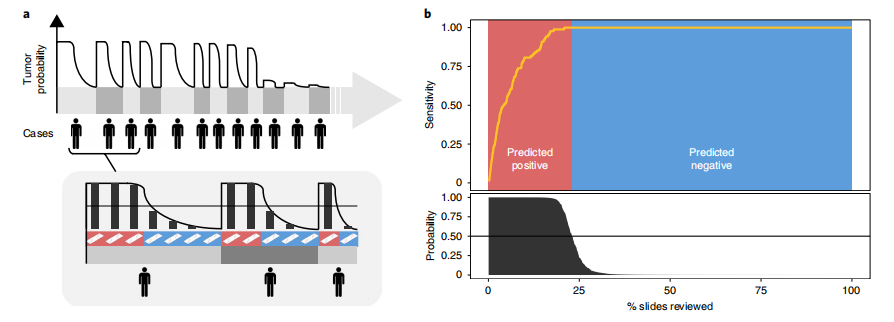
Fig. 6 | Impact of the proposed decision support system on clinical practice. a, By ordering the cases, and slides within each case, based on their tumor probability, pathologists can focus their attention on slides that are probably positive for cancer. b, Following the algorithm’s prediction would allow pathologists to potentially ignore more than 75% of the slides while retaining 100% sensitivity for prostate cancer at the case level (n= 1,784).
图6 | 提出的决策支持系统对临床实践的影响。a,通过基于它们的肿瘤概率对病例及每个病例内的幻灯片进行排序,病理学家可以将他们的注意力集中在可能对癌症呈阳性的幻灯片上。b,遵循算法的预测将允许病理学家在保留100%对前列腺癌的敏感性的情况下,潜在地忽略超过75%的幻灯片(n=1,784)。
这篇关于文献速递:深度学习疾病预后--临床级计算病理学使用基于整张切片图像的弱监督深度学习的文章就介绍到这儿,希望我们推荐的文章对编程师们有所帮助!


