本文主要是介绍Echart 极坐标 方位距离图 图标符号旋转以及大小 颜色渐变,希望对大家解决编程问题提供一定的参考价值,需要的开发者们随着小编来一起学习吧!
背景:
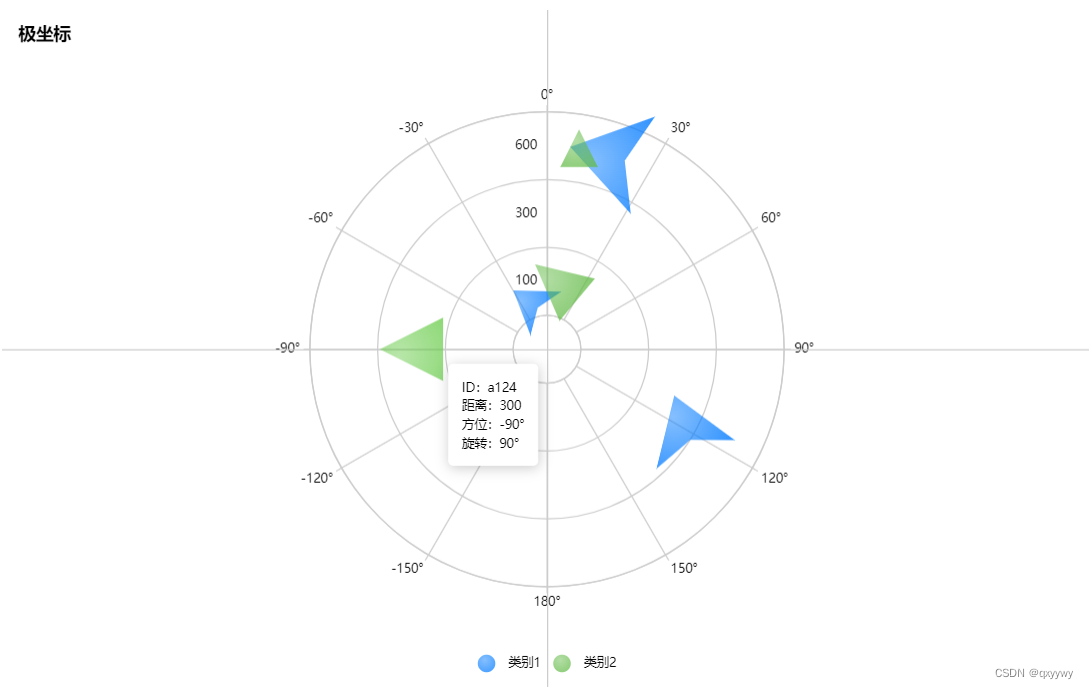
参与一个交互式图表项目,客户有一个极坐标对比需求,展示不同方位不同距离的不同类型的指标数据。具体到属性字段则是:
来源、距离、方位、ID、旋转角度、大小
先看效果图:
技术点:
图例说明:距离为图例的径向轴,方位为图例的角度轴,不同类型需要用不同颜色,不同图标符号进行展示且需要根据旋转角度旋转以及大小参数绘制。
这是一个非常规极坐标图,首先要解决的是角度问题,从0到180(-180)再到0,按照常规思维极坐标的角度应该是一个排序规则而且默认是由小到大,此处的解决思路是:
1.方位问题
方位范围为0°到180°(-180°)再到0°,及整体的极坐标为360°,在此原则下需要注意一下问题:
a.角度轴(angleAxis)的刻度按照要求30°为一个刻度,则在角度小于等于180°保留原值,大于等于180°的需要减去360°。即:
"angleAxis": {max:360,min:0,"axisLabel": {"show": true,"color": "#000000","fontSize": 10,"rotate": 0,"formatter":function (value, index) {if(value>180){return value-360 + '°';}else{return value + '°';}}},
}
b. 角度轴(angleAxis)的值(用户传递过来的方位)在0到180°时保留原值,-180°到0°时需要加上360°。
2.分组、图标、旋转、大小、颜色渐变
这些就是对应echart的相关属性
分组就是series不同数组即可。
图标对应的是series的symbol属性,如:"symbol": "arrow",
旋转对应的是series里具体数据的symbolRotate,如: "symbolRotate":76,
大小对应的是series的symbolSize,如:
"symbolSize":function(val){if(val[4]<3)return 3;elsereturn val[4]*2},颜色渐变:
"itemStyle": {"color": {"type": "radial","x": 0.4,"y": 0.3,"r": 1,"colorStops": [{"offset": 0,"color": "rgba(1,122,255,0.6)"},{"offset": 1,"color": "rgba(1,122,255,1)"}],"global": false}},整理完以上技术点,结合测试数据就可以完成这个特殊极坐标的处理。
完整代码
option = {"title": {"text": "极坐标","textStyle": {"fontWeight": "bold","fontSize": 14,"color": "#000000","fontStyle": "normal"},"show": true,"left": "8px","top": "8px"},"grid": {"x": 0,"y": 0,"x2": 0,"y2": 0},"xAxis": {"min": -100,"max": 100,"axisTick": {"show": false},"axisLine": {"show": true,"lineStyle": {"color": "#CCCCCC","width": 1,"style": "solid"}},"axisLabel": {"show": false},"splitLine": {"show": false}},"yAxis": {"min": -100,"max": 100,"axisTick": {"show": false},"axisLine": {"show": true,"lineStyle": {"color": "#CCCCCC","width": 1,"style": "solid"}},"axisLabel": {"show": false},"splitLine": {"show": false}},"angleAxis": {max:360,min:0,"axisLabel": {"show": true,"color": "#000000","fontSize": 10,"rotate": 0,"formatter":function (value, index) {if(value>180){return value-360 + '°';}else{return value + '°';}}},"splitLine": {"show": true,"lineStyle": {"color": "#CCCCCC","width": 1,"style": "solid"}},"axisLine": {"show": true,"lineStyle": {"color": "#cccccc","width": 1,"style": "solid"}},"show": true,"axisTick": {"show": true,"lineStyle": {"color": "#cccccc","width": 1,"style": "solid"}}},"radiusAxis": {"type": "category","data": ["100","300","600"],"z": 10,"axisLabel": {"show": true,"color": "#000000","fontSize": 10,"rotate": 0,"formatter": "{value}"},"axisTick": {"show": false,"lineStyle": {"color": "#cccccc","width": 1,"style": "solid"}},"axisLine": {"show": false,"lineStyle": {"color": "#cccccc","width": 1,"style": "solid"}},"boundaryGap": true,"splitLine": {"show": true,"lineStyle": {"color": "#CCCCCC","width": 1,"style": "solid"}},"show": true,"position": "left","name": "","nameTextStyle": {"color": "#000000","fontSize": 10}},"polar": {"radius": ["10%","70%"]},"series": [{"name": "类别1","type": "scatter","data": [{"value": ["100",-30,'a128',55,16],"symbolRotate":55,"dimensionList": [{"id": "58295c72-e13a-4bf5-80e6-16d4253dec53","value": "100"}],"quotaList": [{"id": "84c1ad50-f031-4ee3-99d5-343761639e98"}],},{"value": ["300",110,'a127',20,25],"symbolRotate":20,"dimensionList": [{"id": "58295c72-e13a-4bf5-80e6-16d4253dec53","value": "300"}],"quotaList": [{"id": "84c1ad50-f031-4ee3-99d5-343761639e98"}]},{"value": ["600",6.54,'a126',76,30],"symbolRotate":76,"dimensionList": [{"id": "58295c72-e13a-4bf5-80e6-16d4253dec53","value": "600"}],"quotaList": [{"id": "84c1ad50-f031-4ee3-99d5-343761639e98"}]}],"itemStyle": {"color": {"type": "radial","x": 0.4,"y": 0.3,"r": 1,"colorStops": [{"offset": 0,"color": "rgba(1,122,255,0.6)"},{"offset": 1,"color": "rgba(1,122,255,1)"}],"global": false}},"symbol": "arrow","symbolSize":function(val){if(val[4]<3)return 3;elsereturn val[4]*2},"label": {"show": false,"position": "inside","color": "#000000","fontSize": 10,"formatter": "{c}","gaugeFormatter": "{value}","labelLine": {"show": true},"gaugeLabelFormatter": {"type": "value","unit": 1,"suffix": "","decimalCount": 2,"thousandSeparator": true},"reserveDecimalCount": 2,"labelContent": ["dimension","proportion"],"modifyName": "show","propertyName": "label-selector"},"z": 100,"coordinateSystem": "polar","selectedMode": true,"select": {"itemStyle": {"shadowBlur": 2}},},{"name": "类别2","type": "scatter","data": [{"value": ["100",7.77,'a123',50,22],"symbolRotate":50,"dimensionList": [{"id": "58295c72-e13a-4bf5-80e6-16d4253dec53","value": "100"}],"quotaList": [{"id": "acee783e-c4e7-4616-8fbf-e1e5b8e6f411"}]},{"value": ["300",-90,'a124',90,23],"symbolRotate":90,"dimensionList": [{"id": "58295c72-e13a-4bf5-80e6-16d4253dec53","value": "300"}],"quotaList": [{"id": "acee783e-c4e7-4616-8fbf-e1e5b8e6f411"}]},{"value": ["600",9.08,'a125',0,15],"symbolRotate":0,"dimensionList": [{"id": "58295c72-e13a-4bf5-80e6-16d4253dec53","value": "600"}],"quotaList": [{"id": "acee783e-c4e7-4616-8fbf-e1e5b8e6f411"}]}],"itemStyle": {"color": {"type": "radial","x": 0.4,"y": 0.3,"r": 1,"colorStops": [{"offset": 0,"color": "rgba(98,186,70,0.6)"},{"offset": 1,"color": "rgba(98,186,70,1)"}],"global": false}},"symbol": "triangle","symbolSize":function(val){if(val[4]<3)return 3;elsereturn val[4]*2},"label": {"show": false,"position": "inside","color": "#000000","fontSize": 10,"formatter": "{c}","gaugeFormatter": "{value}","labelLine": {"show": true},"gaugeLabelFormatter": {"type": "value","unit": 1,"suffix": "","decimalCount": 2,"thousandSeparator": true},"reserveDecimalCount": 2,"labelContent": ["dimension","proportion"],"modifyName": "show","propertyName": "label-selector"},"z": 100,"coordinateSystem": "polar","selectedMode": true,"select": {"itemStyle": {"shadowBlur": 2}}}],"legend": {"show": true,"data": ["类别1","类别2"],"textStyle": {"color": "#000000","fontSize": 10},"left": "center","bottom": "8px","orient": "horizontal","icon": "circle","pageIconColor": "#000000","pageIconInactiveColor": "#8c8c8c"},"color": ["#017AFF","#62BA46","#FFC601","#F7821B","#FF5257","#F74F9E","#CC9494","#955FBC","#A55057"],"tooltip": {"show": true,"trigger": "item","confine": true,"textStyle": {"fontSize": 10,"color": "#000000"},"formatter": function(params){console.log(params)return  "ID:"+params.value[2]+"<br />距离:"+params.value[0]+"<br />方位:"+params.value[1]+"°<br />旋转:"+params.value[3]+"°"},"backgroundColor": "#FFFFFF","modifyName": "trigger","propertyName": "tooltip-selector","borderColor": "#FFFFFF","appendToBody": true}
};
这篇关于Echart 极坐标 方位距离图 图标符号旋转以及大小 颜色渐变的文章就介绍到这儿,希望我们推荐的文章对编程师们有所帮助!


