本文主要是介绍Docker 环境下运行 Fast_LIO 进行三维建模的前/后处理设置,希望对大家解决编程问题提供一定的参考价值,需要的开发者们随着小编来一起学习吧!
Title: Docker 环境下运行 Fast_LIO 进行三维建模的前/后处理设置
文章目录
- 前言
- I. 扫图获取点云数据
- 一. Fast_LIO 扫图注意事项
- 二. 扫图操作脚本命令
- 三. 扫图时 Rviz 显示问题
- II. Docker 的安装、配置与运行
- 一. 安装 Docker
- 二. 创建 Docker 层
- 三. 启动容器
- 1. 第一个容器终端
- 2. 第二个容器终端
- 四. 在 Docker 和宿主机之间复制文件
- 1. 从主机复制到容器 (主机终端中运行)
- 2. 从容器复制到主机 (主机终端中运行)
- III. Docker 中 Fast_LIO 建图
- 一. 第一个容器终端中运行建图程序
- 二. 第二个容器终端中播放点云数据
- 三. 保存 PCD
- IV. 建图结果的 PCD 显示设置
- 一. PCD 点云颜色设置
- 二. PCD 点云透明度设置
- 三. PCD 点云坐标提取
- 四. PCD 录屏后视频处理
- 1. 视频切割
- 2. 视频倍速
- 总结
前言
按照测绘行业术语, 我们将建图视作后处理, 先 “外业” 扫图, 再 “内业” 建图.
内业建图基于 Docker 上部署的 Fast_LIO (https://github.com/hku-mars/FAST_LIO).
建图完成后还需要注意 PCD 点云显示的设置等后处理.
这里记录下一些设置以备忘.
相关博文介绍
Livox_ros_driver2 消息 (msg) 类型对 SLAM 应用程序的适配
I. 扫图获取点云数据
一. Fast_LIO 扫图注意事项
- 不要紧紧对着墙扫, 这是"退化" 环境
- 尽量走直角, 找直角、直线、平面夹角等特征
- 转弯时, 要慢一点且速度均匀
- 尽量少的原地转来转去
- 前方特征多时, 就对着往前边走边扫
- 如果整个建模区域很狭窄, 可以尝试往后退着扫描, 尽量使得前方视野开阔 (使得包含的特征多)
- 退着扫时, 要逐渐转弯, 也是保证多一些特征, 以避开 “退化” 环境
二. 扫图操作脚本命令
为了方便作业, 而不是一个一个终端敲命令, 汇总到一个简单 Shell 脚本中.
#!/bin/bash#time sync
gnome-terminal --tab -- bash -c "\
echo $PASSWORD |sudo -S ptpd -M -i enp0s31f6 -C;\
exec bash"
sleep 20s#launch IMU
gnome-terminal --tab -- bash -c "\
source ~/catkin_ws/devel/setup.bash;\
echo source environme;\
echo $PASSWORD | sudo service udev reload;\
echo $PASSWORD | sudo service udev restart;\
sleep 2s;\
roslaunch fdilink_ahrs ahrs_data.launch;\
exec bash"
sleep 5s#launch Lidar
gnome-terminal --tab -- bash -c "\
source ~/catkin_ws/devel/setup.bash;\
echo source environme;\
roslaunch livox_ros_driver livox_lidar_msg-100Hz.launch;\
exec bash"
sleep 5s#record rosbag /livox/lider /imu
gnome-terminal --tab -- bash -c "\
source ~/catkin_ws/devel/setup.bash;\
echo source environme;\
rosbag record /livox/lidar /imu -o BIM_recorder;\
exec bash"
sleep 1s
三. 扫图时 Rviz 显示问题
录制建图所用的激光数据时, Rviz 无法显示. 这是因为 Livox 中设置了使用定制的点云格式了.
参考:https://github.com/Livox-SDK/livox_ros_driver/issues/41
The /livox/CustomMsg is not supportted by rviz!
Modify the arg “xfer_format” to “0” in launch file if you want to display pointcloud by rviz please!
II. Docker 的安装、配置与运行
一. 安装 Docker
Ubuntu 上安装 Ros 的 Melodic 版本
sudo docker pull osrf/ros:melodic-desktop-full
参考链接 (https://roboticseabass.com/2021/04/21/docker-and-ros/)
二. 创建 Docker 层
docker run --gpus all -it --ipc=host --net=host --privileged -e DISPLAY=unix$DISPLAY -v /tmp/.X11-unix:/tmp/.X11-unix:rw -e NVIDIA_DRIVER_CAPABILITIES=all osrf/ros:melodic-desktop-full /bin/bash
命令 docker run 是在镜像上创建一个 Docker layer, 创建的时候这些参数一定要写正确写全.
其中
-e DISPLAY=unix$DISPLAY 修改环境变量DISPLAY
-v /tmp/.X11-unix:/tmp/.X11-unix:rw 表示共享本地unix端口, Docker 可以知道本地宿主主机上安装的 X11 界面服务
-e NVIDIA_DRIVER_CAPABILITIES=all 设置显示环境变量
这些参数含义可由
- “docker run --help” 查看
- 官网查看 (https://docs.docker.com/engine/reference/run/#runtime-privilege-and-linux-capabilities)
- 众多博文参考 (如 A Guide to Docker and ROS 或 Docker容器运行GUI程序的配置方法)
三. 启动容器
一旦 Docker layer 创建以后, 就可以运行和启动容器
1. 第一个容器终端
xhost +				# 开放权限, 允许所有用户(当然包括 Docker) 访问 X11 的显示接口# 后面在 Docker 中运行有图形界面的程序时, 就和本地程序一样自由地显示了
docker ps -a 		# 查看上一步已创建的 dockerID
docker start *  	# 这里 * 就是 dockerID, 用自己的 dockerID 代替
docker attach * 	# 这里 * 就是 dockerID, 第一个终端可以用 attach# 第二终端再用这个 attach 的话, 两个终端输出一模一样
命令 docker attach 进入容器正在执行的终端, 不会启动新的进程.
2. 第二个容器终端
xhost +
docker exec -it * /bin/bash  		# 这里 * 就是 dockerID, 这样可避免第二个终端输出和第一个终端的输出一模一样
-i, --interactive Keep STDIN open even if not attached (标准输入打开, 实现交互)
-t, --tty Allocate a pseudo-TTY (分配一个伪终端)
上面这条命令就是进入容器内部执行 /bin/bash 命令, 会在运行的容器上创建进程执行新的命令.
四. 在 Docker 和宿主机之间复制文件
1. 从主机复制到容器 (主机终端中运行)
sudo docker cp host_path containerID:container_path
2. 从容器复制到主机 (主机终端中运行)
sudo docker cp containerID:container_path host_path
III. Docker 中 Fast_LIO 建图
获得激光扫描数据包后, 在已部署的 Docker 里面运行 Fast_LIO 建图.
一. 第一个容器终端中运行建图程序
cd /home/catkin_ws/
source ./devel/setup.bash
roslaunch fast_lio mapping_avia.launch
二. 第二个容器终端中播放点云数据
rosbag play -r 1 -s 1 *.bag # -r 播放倍率; -s 那一秒开始播放
三. 保存 PCD
Rviz 中大规模点云易出现卡顿, 可以设置参数为: 不显示点云数据, 只生成 PCD 文件.
FAST_LIO/PCD文件夹下得到建图后的点云数据文件 (.PCD文件).
建图前需要在 config 目录下配置 yaml 文件, 如根据所接收的 imu 及激光扫描数据, 修改对应 preprocess 和 mapping 部分的参数等.
针对显示和保存的设置有:
path_en: true 				# (显示路径)
dense_publish_en: false 	# (为应对大规模点云渲染易卡顿)
pcd_save_en: true 			# (保存点云结果以便后续离线可视化操作)
在运行 Fast_LIO 的终端窗口中, “ctrl+c” 结束 Fast_LIO 运行后, 自动保存结果文件 scans.pcd 于 “/home/catkin_ws/src/FAST_LIO/PCD” 文件夹下.
当然最好改一下名, 免得下次被覆盖.
IV. 建图结果的 PCD 显示设置
一. PCD 点云颜色设置
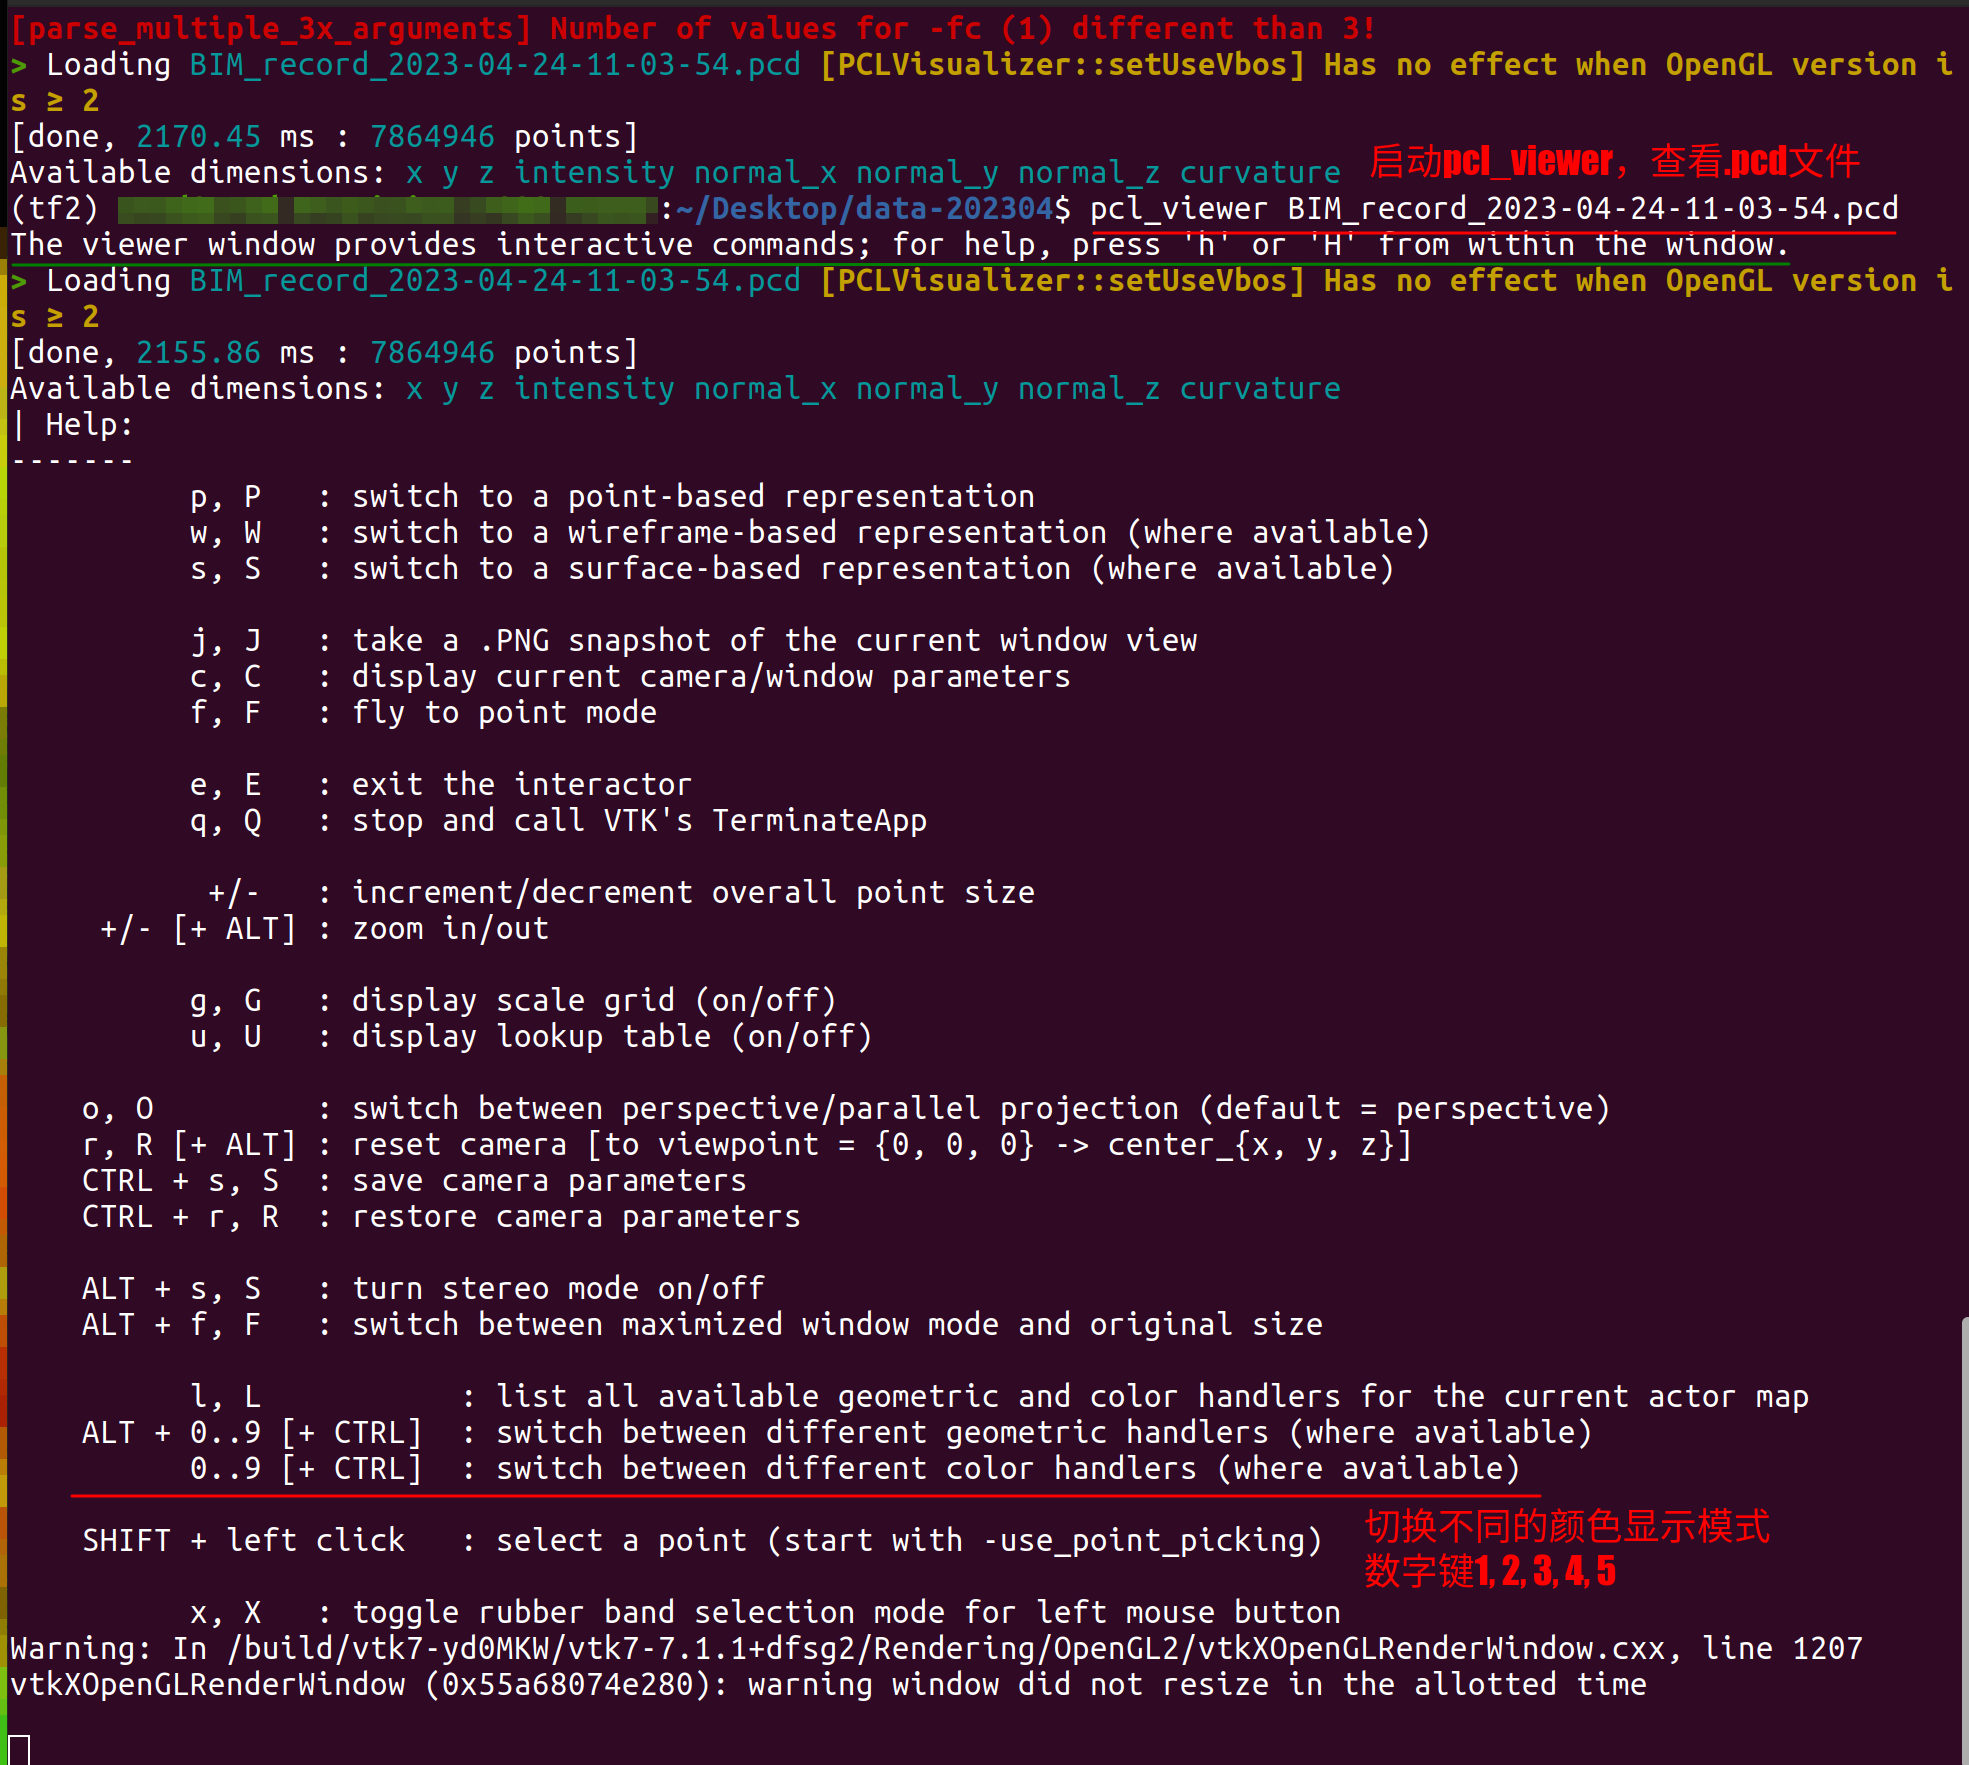
打开 pcl_viewer, 命令
pcl_viewer ./*.pcd
选中 PCD 点云显示界面, 按 “h” 键. 在终端界面中会出现显示设置的提示.
如为了显示金灿灿的效果, 选中 PCD 点云显示界面后按数字键 “5”.
change what to visualize/color by pressing 1, 2, 3, 4, 5
1 is all random
2 is X values
3 is Y values
4 is Z values
5 is intensity
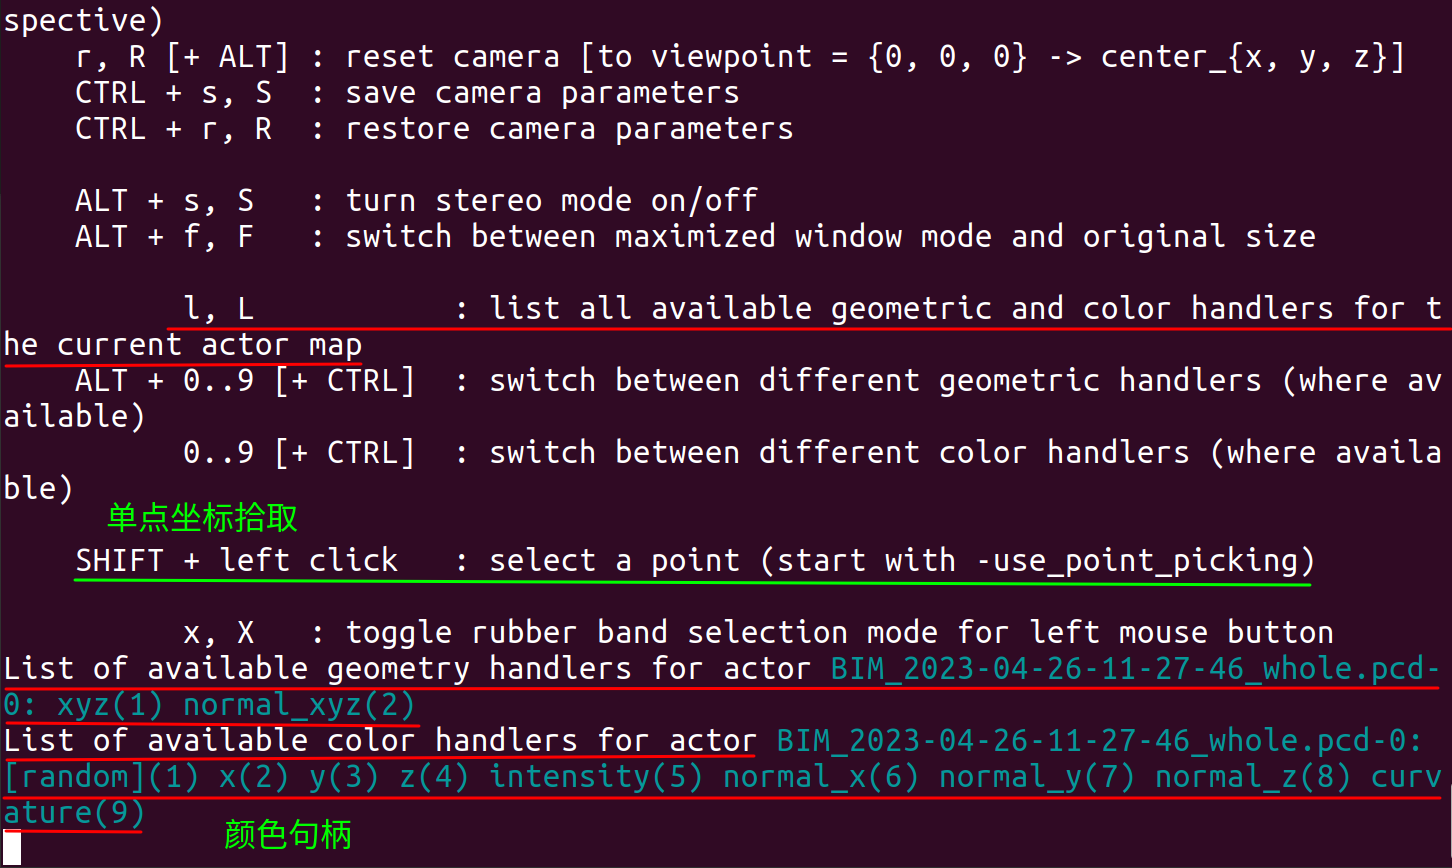
PCD 点云显示界面, 按 “L” 键, 获得几何句柄 (Geometry handlers) 和颜色句柄 (Color handlers). 几何句柄可用于点云的精细计算.
List of available geometry handlers for actor BIM_2023-04-26-11-27-46_whole.pcd-0: xyz(1) normal_xyz(2)
List of available color handlers for actor BIM_2023-04-26-11-27-46_whole.pcd-0: random x(2) y(3) z(4) intensity(5) normal_x(6) normal_y(7) normal_z(8) curvature(9)
以上显示往往比较粗糙, 我们需要对 pcl_viewer 进行多些设置.
二. PCD 点云透明度设置
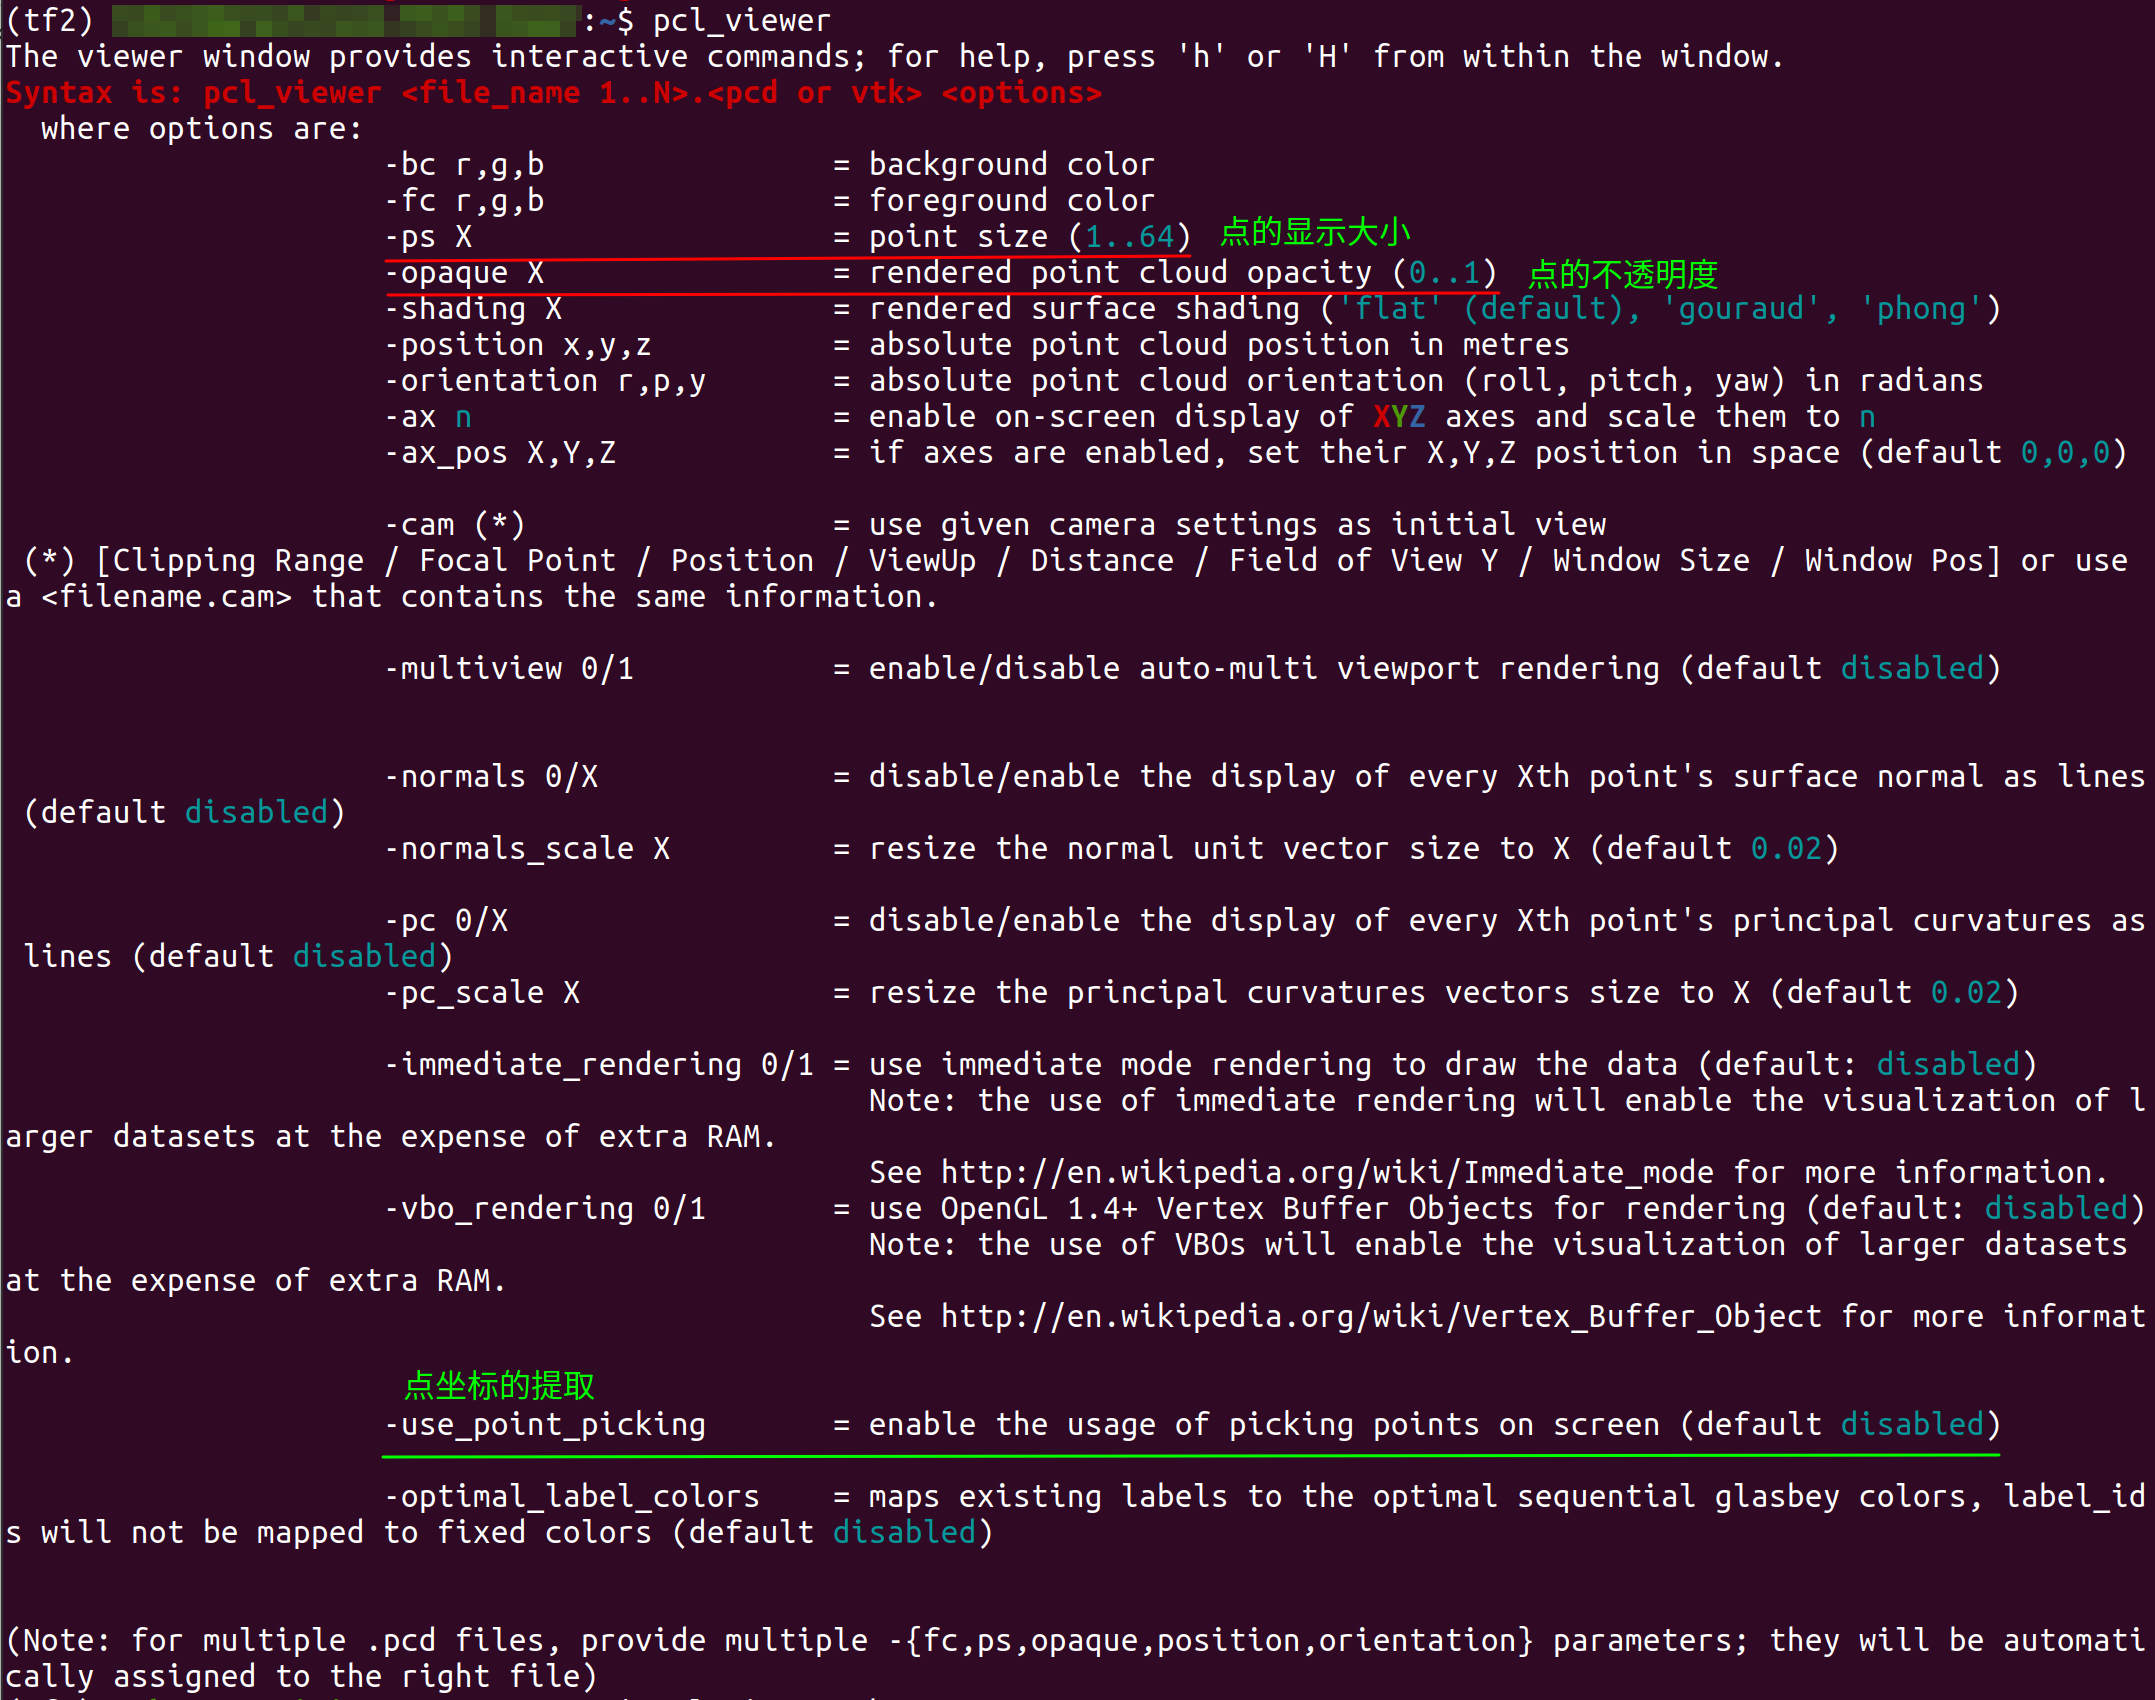
PCL 库源码中 (https://github.com/otherlab/pcl/blob/master/visualization/tools/pcd_viewer.cpp) 找到文件 pcd_viewer.cpp.
pcl_viewer 各种显示参数的设置如下, 其中有关于点云中点的大小、不透明度的设置, 也有关于点云坐标拾取使能的设置.
void
printHelp (int, char **argv)
{print_error ("Syntax is: %s <file_name 1..N>.<pcd or vtk> <options>\n", argv[0]);print_info ("  where options are:\n");print_info ("                     -bc r,g,b                = background color\n");print_info ("                     -fc r,g,b                = foreground color\n");print_info ("                     -ps X                    = point size ("); print_value ("1..64"); print_info (") \n");print_info ("                     -opaque X                = rendered point cloud opacity ("); print_value ("0..1"); print_info (")\n");print_info ("                     -shading X               = rendered surface shading ("); print_value ("'flat' (default), 'gouraud', 'phong'"); print_info (")\n");print_info ("                     -position x,y,z          = absolute point cloud position in metres\n");print_info ("                     -orientation r,p,y       = absolute point cloud orientation (roll, pitch, yaw) in radians\n");print_info ("                     -ax "); print_value ("n"); print_info ("                    = enable on-screen display of ");print_color (stdout, TT_BRIGHT, TT_RED, "X"); print_color (stdout, TT_BRIGHT, TT_GREEN, "Y"); print_color (stdout, TT_BRIGHT, TT_BLUE, "Z");print_info (" axes and scale them to "); print_value ("n\n");print_info ("                     -ax_pos X,Y,Z            = if axes are enabled, set their X,Y,Z position in space (default "); print_value ("0,0,0"); print_info (")\n");print_info ("\n");print_info ("                     -cam (*)                 = use given camera settings as initial view\n");print_info (stderr, " (*) [Clipping Range / Focal Point / Position / ViewUp / Distance / Field of View Y / Window Size / Window Pos] or use a <filename.cam> that contains the same information.\n");print_info ("\n");print_info ("                     -multiview 0/1           = enable/disable auto-multi viewport rendering (default "); print_value ("disabled"); print_info (")\n");print_info ("\n");print_info ("\n");print_info ("                     -normals 0/X             = disable/enable the display of every Xth point's surface normal as lines (default "); print_value ("disabled"); print_info (")\n");print_info ("                     -normals_scale X         = resize the normal unit vector size to X (default "); print_value ("0.02"); print_info (")\n");print_info ("\n");print_info ("                     -pc 0/X                  = disable/enable the display of every Xth point's principal curvatures as lines (default "); print_value ("disabled"); print_info (")\n");print_info ("                     -pc_scale X              = resize the principal curvatures vectors size to X (default "); print_value ("0.02"); print_info (")\n");print_info ("\n");print_info ("                     -immediate_rendering 0/1 = use immediate mode rendering to draw the data (default: "); print_value ("disabled"); print_info (")\n");print_info ("                                                Note: the use of immediate rendering will enable the visualization of larger datasets at the expense of extra RAM.\n");print_info ("                                                See http://en.wikipedia.org/wiki/Immediate_mode for more information.\n");print_info ("                     -vbo_rendering 0/1       = use OpenGL 1.4+ Vertex Buffer Objects for rendering (default: "); print_value ("disabled"); print_info (")\n");print_info ("                                                Note: the use of VBOs will enable the visualization of larger datasets at the expense of extra RAM.\n");print_info ("                                                See http://en.wikipedia.org/wiki/Vertex_Buffer_Object for more information.\n");print_info ("\n");print_info ("                     -use_point_picking       = enable the usage of picking points on screen (default "); print_value ("disabled"); print_info (")\n");print_info ("\n");print_info ("                     -optimal_label_colors    = maps existing labels to the optimal sequential glasbey colors, label_ids will not be mapped to fixed colors (default "); print_value ("disabled"); print_info (")\n");print_info ("\n");print_info ("\n(Note: for multiple .pcd files, provide multiple -{fc,ps,opaque,position,orientation} parameters; they will be automatically assigned to the right file)\n");
}
或终端中
pcl_viewer
得到帮助提示
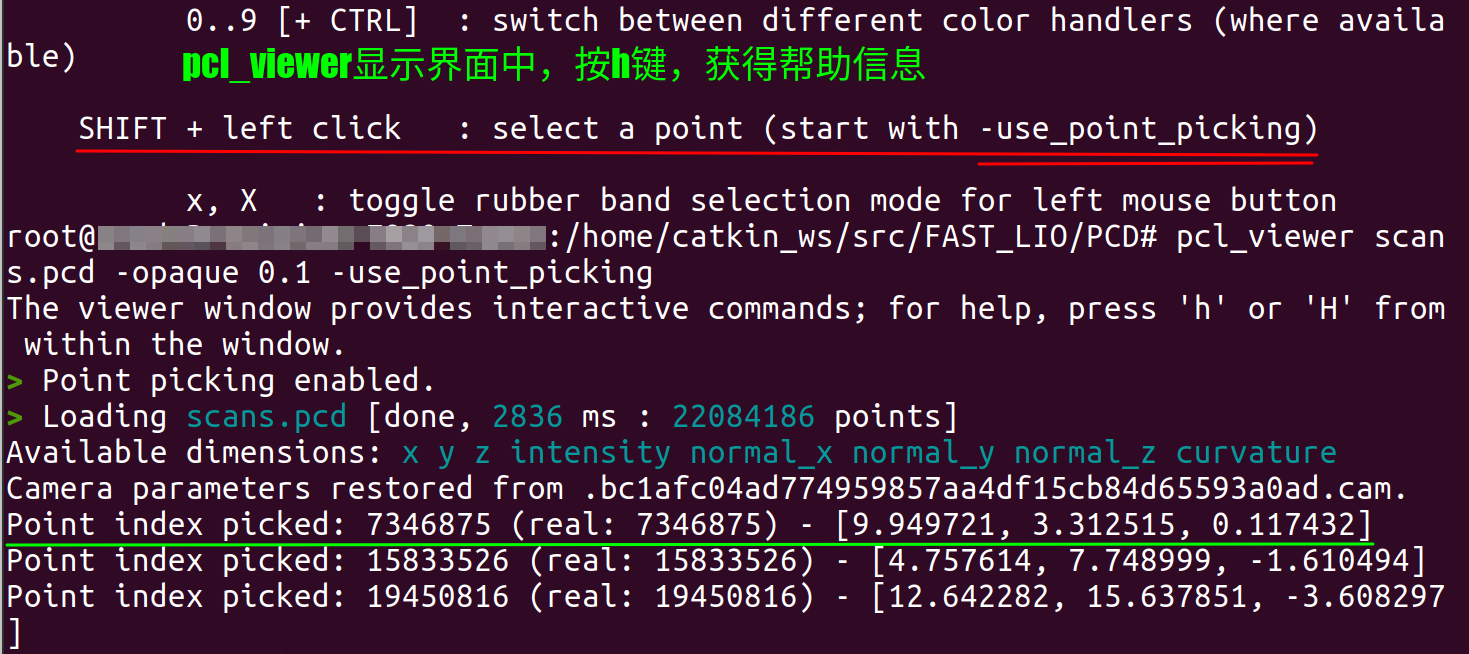
那么我们运行
pcl_viewer *.pcd -opaque 0.1 -use_point_picking
可以获得较细腻的点云显示. 同时也可以直接鼠标拾取单个点的坐标值.
三. PCD 点云坐标提取
拾取动作: Shift+鼠标左键
四. PCD 录屏后视频处理
结果出来后, 难免需要作工作展示, 可能需要将点云显示效果进行录屏和视频处理.
1. 视频切割
用 ffmpeg
参考: https://shotstack.io/learn/use-ffmpeg-to-trim-video/
e.g.
ffmpeg -i field3_manhole_b.mp4 -ss 00:00:13.03 -to 00:00:47.00 -c:v copy -c:a copy field3_manhole_b_cutted.mp4
2. 视频倍速
参考: https://write.corbpie.com/speed-up-and-slow-down-video-with-ffmpeg/
ffmpeg -i test.mp4 -filter:v "setpts=0.5*PTS" test-0.5.mp4
视频速度调整取决于 setpts 视频滤波器的数值, 支持的范围是 0.25-4. 数值越小速度越快, 两倍速是 0.5, 四倍速是 0.25, 以此类推.
注意音频倍速也有参数, 我们这里没涉及.
总结
以上只是一些简单记录.
(如有问题, 请指出)
这篇关于Docker 环境下运行 Fast_LIO 进行三维建模的前/后处理设置的文章就介绍到这儿,希望我们推荐的文章对编程师们有所帮助!


