本文主要是介绍echarts 柱状图(带柱平移动画、进度条效果柱状、动态增长排序)、折线图(曲线图),希望对大家解决编程问题提供一定的参考价值,需要的开发者们随着小编来一起学习吧!
柱状图:1、x轴和y轴设置:水平方向柱状图:x轴和y轴内容互换xAxis:{type:'category', 类目轴,即x方向按不同内容分类data:xData, 类目轴数据boundaryGap:false, 设置x第一个节点值,从y轴开始,默认有间距splitLine:{ 去掉坐标轴的水平虚线指示线show:false},},yAxis:{type:'value' type='value'不需要设置data,会根据series中的数据显示scale:true, 让y轴的值不从0开始splitNumber:5, 坐标轴分割的段数,只是预估值,会根据实际值的可读程度而改变minInterval:5, 坐标轴的最小刻度尺单位,会被splitNumber分割成的刻度而影响maxInterval:5 坐标轴的最大刻度尺单位,强制限定},2、设置数据的显示方式和数据内容series:[{name:'系列名称',type:'bar', 数据显示方式,line为折线图data:yData, y轴数据和鼠标放上显示内容markPoint:{ 标记点,可以标记最大值和最小值以及任意点data:[{type:'max',name:'最大值',},{type:'min',name:'最小值'},{type:'average',name:'平均值'}]},markLine:{ 标注线data:[{type:'average',name:'平均值'}]},markArea:{ 标志指定区间阴影data: [[{name:'区间1',xAxis:'张三',},{xAxis: '彭万里',}],[{name: '60分到80分',yAxis: 60},{yAxis: 80}],]},label:{ 数值标签show:true, 每个柱显示y轴对应值rotate:60,position:'inside'},barWidth:40, 图的宽度}]3、柱状图平移动画(1)通过dataZoom设置startValue和endValue设置(2)动态改变startValue和endValue的值,即可进行筛选平移4、进度条效果柱状(1)根据方向设置两个x轴/y轴(2)第二个x/y轴的数据是相同且大于第一个x/y轴的数据(3)设置第二个x/y轴对应的柱状样式,如边框和颜色为空在series中通过xAxisIndex/yAxisIndex来指定控制对应的轴5、设置不同类型的bar,以及多个图表坐标轴分离option = {legend: {},tooltip: {},dataset: {source: [['product', '2012', '2013', '2014', '2015'],['Matcha Latte', 41.1, 30.4, 65.1, 53.3],['Milk Tea', 86.5, 92.1, 85.7, 83.1],['Cheese Cocoa', 24.1, 67.2, 79.5, 86.4]]},xAxis: [{type: 'category', gridIndex: 0},{type: 'category', gridIndex: 1}],yAxis: [{gridIndex: 0},{gridIndex: 1}],grid: [{bottom: '55%'},{top: '55%'}],series: [// 这几个系列会在第一个直角坐标系中,每个系列对应到 dataset 的每一行。{type: 'bar', seriesLayoutBy: 'row'},{type: 'bar', seriesLayoutBy: 'row'},{type: 'bar', seriesLayoutBy: 'row'},// 这几个系列会在第二个直角坐标系中,每个系列对应到 dataset 的每一列。{type: 'bar', xAxisIndex: 1, yAxisIndex: 1},{type: 'bar', xAxisIndex: 1, yAxisIndex: 1},{type: 'bar', xAxisIndex: 1, yAxisIndex: 1},{type: 'bar', xAxisIndex: 1, yAxisIndex: 1}]}6、动态排序增长柱状图yAxis.inverse 设为true,表示Y轴从下往上是从小到大的排列,否则相反yAxis.animationDuration 建议设为300,表示第一次柱条排序动画的时长yAxis.animationDurationUpdate 建议设为300,表示第一次后柱条排序动画的时长yAxis.max 只显示前n名,将yAxis.max设为n - 1,否则显示所有柱条xAxis.max 建议设为'dataMax'表示用数据的最大值作为X轴最大值,视觉效果更好series.realtimeSort 设为true,表示开启Y 轴的动态排序效果series.label.valueAnimation 如果想要实时显示标签,需要将series.label.valueAnimation设为trueanimationDuration 设为0,表示第一份数据不需要从0开始动画(如果希望从0开始则建议设为和animationDurationUpdate 相同的值)animationDurationUpdate 建议设为3000表示每次更新动画时长,这一数值应与调用setOption改变数据的间隔时间相同以animationDurationUpdate的频率调用setInterval,更新数据值,显示下一个时间点对应的柱条排序折线图:基础配置和柱状图相同series:[{type:'line',smooth:true, 设置平滑曲线stack:'all', 堆叠图,stack可以是任意值,则第二个图就会在第一个图的每个数据*2的高度上进行绘制,避免交叉重叠lineStyle:{ 线条样式color:'purple',type:'dashed'},areaStyle:{ 绘制线条对应的到x轴的区域面积color:'orange'},},{type:'line',stack:'all', stack可以是任意值,则第二个图就会在第一个图的每个数据*2的高度上进行绘制,避免重叠}]
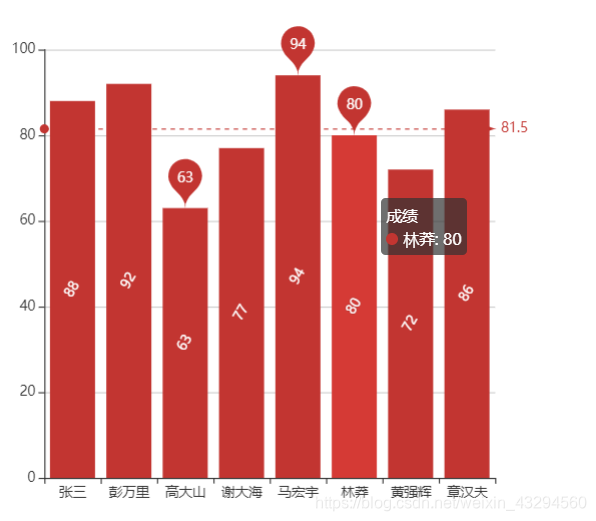
效果图:


代码示例:
柱状图:
<template><div id="app"><div class='map'></div><!-- <router-view/> --></div>
</template><script>
import echarts from 'echarts';export default {name: 'App',mounted:function(){var myMap=echarts.init(document.querySelector('.map'));var xData=['张三','彭万里','高大山','谢大海','马宏宇','林莽','黄强辉','章汉夫']var yData=[88,92,63,77,94,80,72,86];var option = {xAxis:{type:'category',//类目轴data:xData //类目轴数据},yAxis:{type:'value'  //type='value'不需要设置data,会根据series中的数据显示},// xAxis:{//    type:'value'  //type='value'不需要设置data,会根据series中的数据显示// },// yAxis:{//   type:'category',//类目轴//   data:xData //类目轴数据// },series:[ {name:'成绩',type:'bar', //数据显示方式,bar柱状图data:yData,  //y轴数据和鼠标放上显示内容markPoint:{ //标记点,可以标记最大值和最小值以及任意点data:[{type:'max',name:'最大值',},{type:'min',name:'最小值'},{type:'average',name:'平均值'}]},markLine:{ //标注线data:[{type:'average',name:'平均值'}]},label:{ //数值标签show:true,  //每个柱显示y轴对应值rotate:60,position:'inside'},barWidth:40,}],tooltip:{trigger:'item'}};myMap.setOption(option);}
}
</script><style>
.map{height:500px;width:500px;
}
</style>
柱状图平移动画实现:
<template><div class='s-c'><div class='s-chart' ref='range'></div></div>
</template><script>export default {name:'trender',data(){return{myMap:null,data:[],startValue:0,endValue:9,timer:null}},mounted(){this._initChart();this._getData();window.onresize=this._resize;//第一次适配调用this._resize();},destroyed(){window.removeEventListener('resize',this._resize);clearInterval(this.timer);},methods:{_initChart(){this.myMap=this.$echarts.init(this.$refs.range,'chalk');const option={title: {text: '▎ 地区销售排行',left: 20,top: 20},grid: {top: '40%',left: '5%',right: '5%',bottom: '5%',containLabel: true},tooltip: {show: true},xAxis:{type:'category'},yAxis:{type:'value',splitLine:{  show:false},},series:[{type:'bar',}]};this.myMap.setOption(option);this._listen();},async _getData(){let res = await this.$axios.get('/api/rank');this.data=res.data;this.data.sort((a,b)=>{return b.value-a.value;})this._updateChart();},_updateChart(){const xData=this.data.map((item)=>{return item.name;})const yData=this.data.map((item)=>{return item.value;})const colorArr = [['#0BA82C', '#4FF778'],['#2E72BF', '#23E5E5'],['#5052EE', '#AB6EE5']]const option={xAxis:{data:xData},dataZoom:[{show:false,startValue:this.startValue,endValue:this.endValue}],series:[{data:yData,itemStyle:{color:e=>{let targetColorArr = nullif (e.value > 300) {targetColorArr = colorArr[0]} else if (e.value > 200) {targetColorArr = colorArr[1]} else {targetColorArr = colorArr[2]}return new this.$echarts.graphic.LinearGradient(0, 0, 0, 1, [{offset: 0,color: targetColorArr[0]},{offset: 1,color: targetColorArr[1]}])}}}]};this.myMap.setOption(option);this._panMove();},_resize(){const container = this.$refs.range.offsetWidth;const titleFontSize=container/100*3.6const option={title:{textStyle:{fontSize:titleFontSize}},series:[{barWidth:titleFontSize,itemStyle:{barBorderRadius:[titleFontSize/2,titleFontSize/2,0,0]}}]};this.myMap.setOption(option);this.myMap.resize();},//定时器平移柱_panMove(){if(this.timer){clearInterval(this.timer);}this.timer=setInterval(()=>{this.startValue++;this.endValue++;if(this.endValue>this.data.length-1){this.startValue=0;this.endValue=9;}this._updateChart();},2000)},//监听移入移出_listen(){this.myMap.on('mouseover',()=>{clearInterval(this.timer);})this.myMap.on('mouseout',()=>{this._panMove();})}}}
</script><style lang='less' scoped>
.s-c{width: 100%;height:100%;.s-chart{width: 100%;height:100%;}
}
</style>
进度条效果柱状:
<template><div class="map" ref='bartech'>dd</div>
</template><script>export default {name:'bartech',data(){return{myMap:null}},mounted(){this._initMap();window.onresize=this._resize;},destroyed(){window.removeEventListener('resize',this._resize);},methods:{//0.25rem;_initMap(){this.myMap=this.$echarts.init(this.$refs.bartech);this._updataChart();   },_updataChart(){var data = [70, 34, 60, 78, 69];var titlename = ["HTML5", "CSS3", "javascript", "VUE", "NODE"];var valdata = [702, 350, 610, 793, 664];var myColor = ["#1089E7", "#F57474", "#56D0E3", "#F8B448", "#8B78F6"];let option={title:{text:'技能掌握',textStyle:{color:'white',fontWeight: 400},left:'center'},grid: {left: "0%",top: "30px",right: "0%",bottom: "4%",containLabel: true},xAxis:{type:'value',show:false,},yAxis:[{type:'category',inverse:true,data:titlename,splitLine:{show:false},axisLabel: {color: "#fff",rich: {lg: {backgroundColor: "#339911",color: "#fff",borderRadius: 15,// padding: 5,align: "center",width: 15,height: 15}}},axisTick: {show: false},axisLine: {show: false},},{show: true,inverse: true,data: valdata,axisLabel: {textStyle: {fontSize: 12,color: "#fff"}}}],series:[{type:'bar',data:data,barWidth: "35%",itemStyle: {barBorderRadius: 5},yAxisIndex:0,barCategoryGap: 50,label: {show: true,position: "inside",formatter: "{c}%"},itemStyle:{barBorderRadius: 20,color:function(params){var num=myColor.length;return myColor[params.dataIndex%num]}}},{type:'bar',data:[100, 100, 100, 100, 100],yAxisIndex: 1,barWidth:'50%',itemStyle:{color:'none',borderColor:"#00c1de",borderWidth: 3,barBorderRadius: 15}}]}this.myMap.setOption(option);},_resize(){this.myMap.resize();}}}
</script><style lang='less' scoped>
.map{height: 100%;width:100%;}
</style>
动态排序增长柱状图:
var data = [];
for (let i = 0; i < 5; ++i) {data.push(Math.round(Math.random() * 200));
}option = {xAxis: {max: 'dataMax',},yAxis: {type: 'category',data: ['A', 'B', 'C', 'D', 'E'],inverse: true,animationDuration: 300,animationDurationUpdate: 300,max: 2 // only the largest 3 bars will be displayed},series: [{realtimeSort: true,name: 'X',type: 'bar',data: data,label: {show: true,position: 'right',valueAnimation: true}}],legend: {show: true},animationDuration: 0,animationDurationUpdate: 3000,animationEasing: 'linear',animationEasingUpdate: 'linear'
};function run () {var data = option.series[0].data;for (var i = 0; i < data.length; ++i) {if (Math.random() > 0.9) {data[i] += Math.round(Math.random() * 2000);}else {data[i] += Math.round(Math.random() * 200);}}myChart.setOption(option);
}setTimeout(function() {run();
}, 0);
setInterval(function () {run();
}, 3000);
折线图:
<template><div id="app"><div class='map'></div><!-- <router-view/> --></div>
</template><script>
import echarts from 'echarts';export default {name: 'App',mounted:function(){var myMap=echarts.init(document.querySelector('.map'));var xData=['张三','彭万里','高大山','谢大海','马宏宇','林莽','黄强辉','章汉夫']var yData1=[88,92,63,77,94,80,72,86];var yData2=[80,90,60,70,90,70,62,76];var option = {title:{text:'标题显示',textStyle:{color:'red'},subtext:'副文本',subtarget:'blank',sublink:'https://www.baidu.com',borderWidth:10,left:40},xAxis:{type:'category',//类目轴data:xData, //类目轴数据boundaryGap:false,  //设置x第一个节点值,从y轴开始,默认有间距},yAxis:{type:'value',  //type='value'不需要设置data,会根据series中的数据显示scale:true,  //让y轴的值不从0开始splitNumber:5,  //坐标轴分割的段数,只是预估值,会根据实际值的可读程度而改变minInterval:5,  //坐标轴的最小刻度尺单位,会被splitNumber分割成的刻度而影响maxInterval: 5  //坐标轴的最大刻度尺单位,强制限定},// xAxis:{//    type:'value'  //type='value'不需要设置data,会根据series中的数据显示// },// yAxis:{//   type:'category',//类目轴//   data:xData //类目轴数据// },series:[ {name:'成绩',type:'line', //数据显示方式,bar柱状图data:yData1,  //y轴数据和鼠标放上显示内容stack:'all',  //stack可以是任意值,则第二个图就会在第一个图的每个数据*2的高度上进行绘制,避免重叠markPoint:{ //标记点,可以标记最大值和最小值以及任意点data:[{type:'max',name:'最大值',},{type:'min',name:'最小值'},{type:'average',name:'平均值'}]},markLine:{ //标注线data:[{type:'average',name:'平均值'}]},markArea:{ //标志指定区间阴影data: [[{name:'区间1',xAxis:'张三',},{xAxis: '彭万里',}],[{name: '60分到80分',yAxis: 60},{yAxis: 80}],]},smooth:true,lineStyle:{ //线条样式color:'purple',type:'dashed'},areaStyle:{ //绘制线条对应的到x轴的区域面积color:'orange'},label:{ //数值标签show:true,  //每个柱显示y轴对应值rotate:60,position:'inside'},barWidth:12,},{name:'其他',data:yData2,type:'line',stack:'all', label:{show:true}}],tooltip:{show:true,trigger:'axios',showContent:true,formatter: '{a}: {b}({c})' //自定义提示框显示内容},toolbox:{ //使视图带有导出图片,数据视图,动态类型切换,数据区域缩放,重置show:true,showTitle:true,feature:{ //开启功能saveAsImage:{}, //可以导出下载dataView:{},   //切换成数据视图restore:{},  //重置dataZoom:{},  //区域缩放magicType:{ //动态类型切换type:['bar','line']}   }},legend:{data:['成绩','其他成绩'],}};myMap.setOption(option);}
}
</script><style>
.map{height:500px;width:500px;
}
</style>
这篇关于echarts 柱状图(带柱平移动画、进度条效果柱状、动态增长排序)、折线图(曲线图)的文章就介绍到这儿,希望我们推荐的文章对编程师们有所帮助!


