本文主要是介绍react开发高德地图,展示特定的行政区,并实现海量标注,希望对大家解决编程问题提供一定的参考价值,需要的开发者们随着小编来一起学习吧!
一、JS API结合React使用
1、官网:https://lbs.amap.com/api/javascript-api-v2/guide/abc/amap-react
2、NPM 安装 Loader
npm i @amap/amap-jsapi-loader --save
3、功能需要申请加载地图相关的key和密钥,使用前读者需提前申请好。

二、实战开发
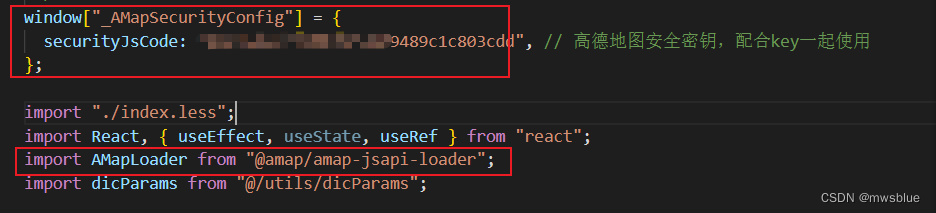
1、密钥的使用方式有多种,具体可以参考:https://lbs.amap.com/api/javascript-api-v2/guide/abc/jscode
2、本人这里是通过明文的方式设置的,并不是很安全。请在引入@amap/amap-jsapi-loader前就配置好密钥。
3、AMapLoader预加载所需地图插件,并实例化地图。只要实例化地图,就可以简单得展示一个地图了。

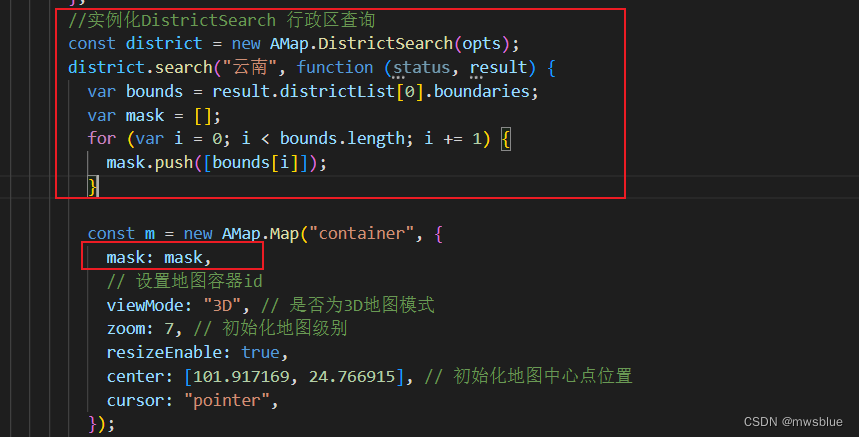
4、AMap.DistrictSearch插件行政区查询,该插件可以查询特定行政区的地域边界点。组装完边界值后,使用mask掩膜处理,就可以只展示该区域了。
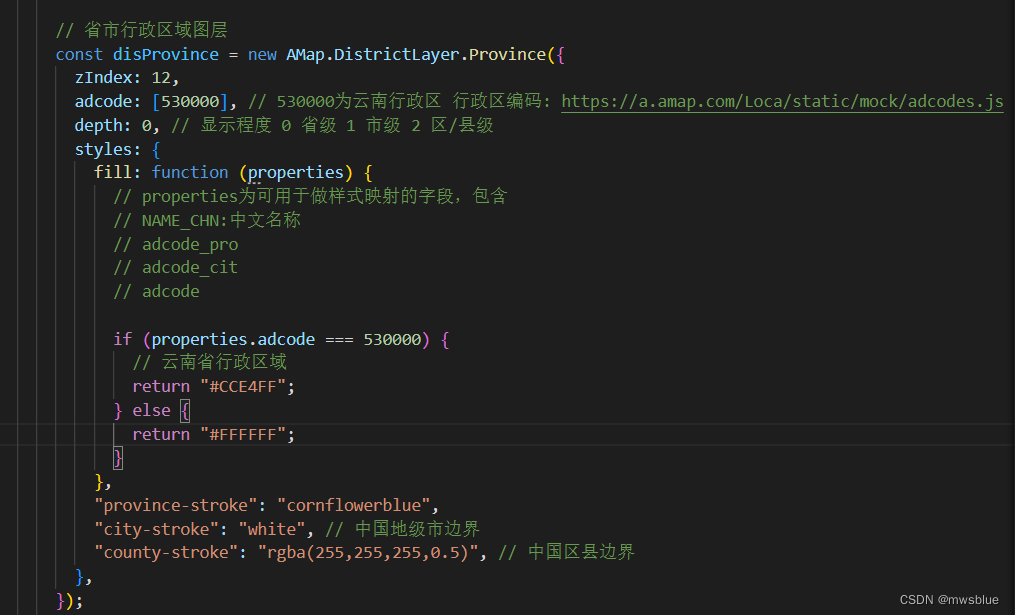
5、AMap.DistrictLayer.Province可以对选定的行政区做背景颜色的更改。
6、海量标注
1)AMap.LabelsLayer实例化,添加标注图层。
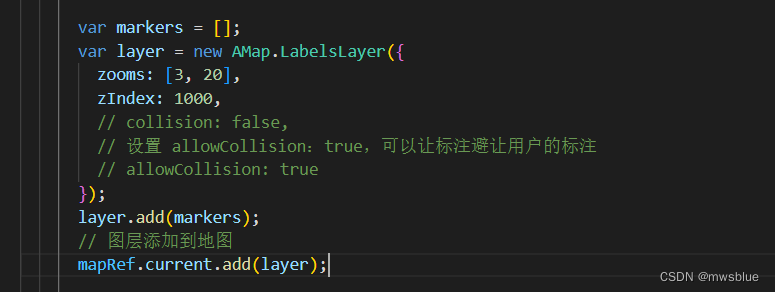
2)AMap.LabelMarker实例化,添加海量标注点。

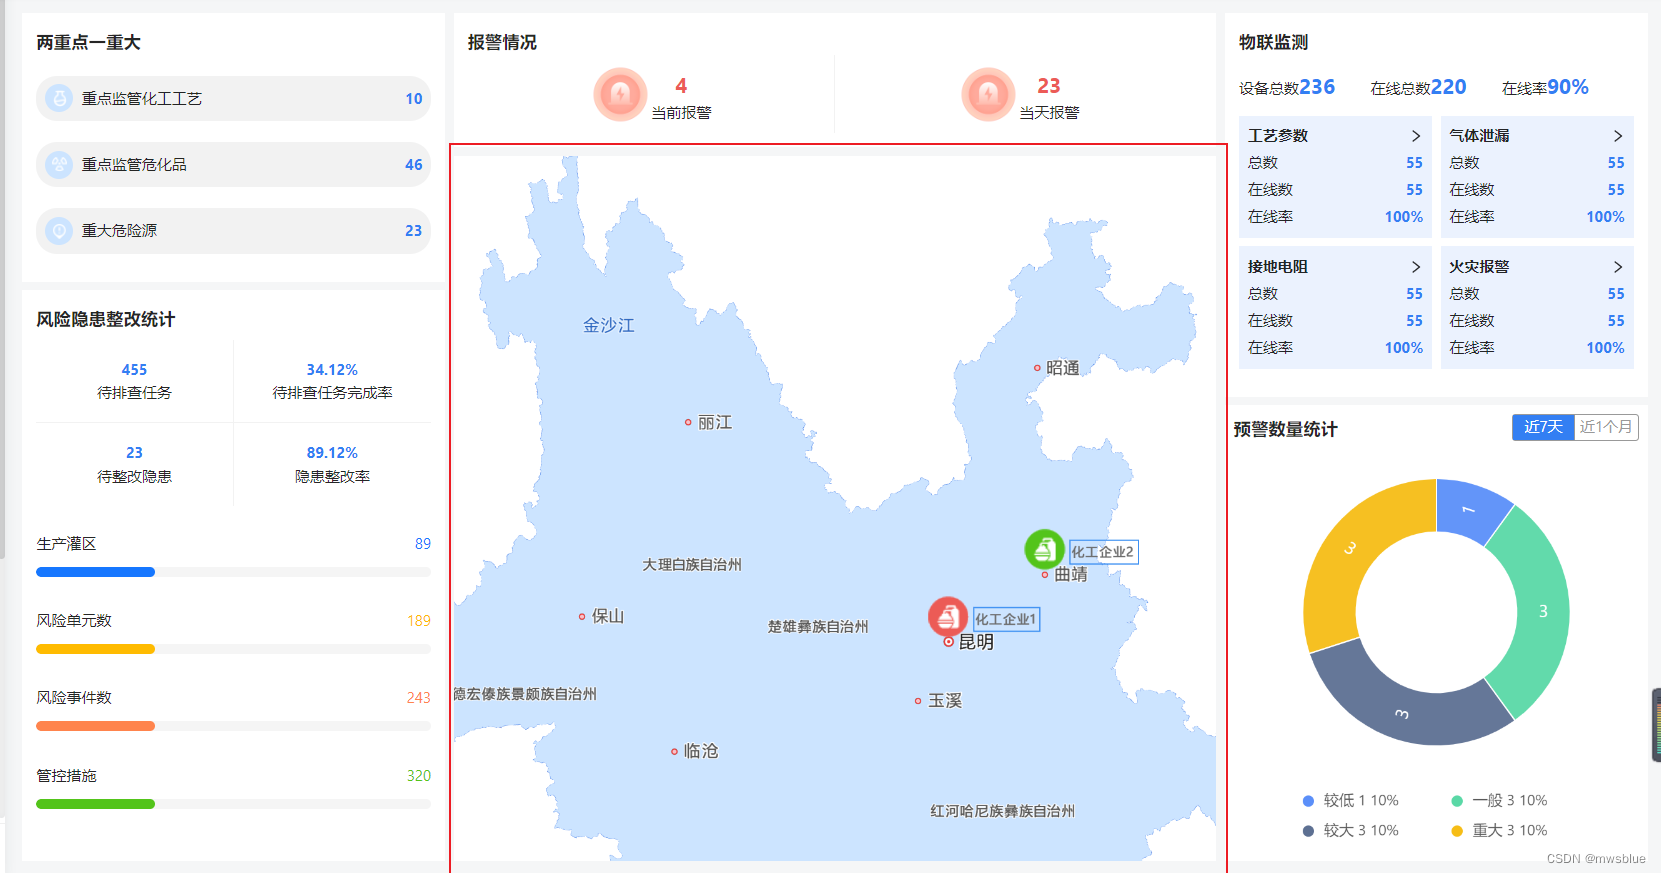
三、效果图
四、完整代码
const initMap = () => {AMapLoader.load({key: dicParams.mapKey, // 申请好的Web端开发者Key,首次调用 load 时必填version: "2.0", // 指定要加载的 JSAPI 的版本,缺省时默认为 1.4.15plugins: ["AMap.DistrictSearch", "AMap.DistrictLayer"], // 需要使用的的插件列表,如比例尺'AMap.Scale'等}).then((AMap) => {var opts = {subdistrict: 0, //返回下一级行政区extensions: "all", //返回行政区边界坐标组等具体信息};//实例化DistrictSearch 行政区查询const district = new AMap.DistrictSearch(opts);district.search("云南", function (status, result) {var bounds = result.districtList[0].boundaries;var mask = [];for (var i = 0; i < bounds.length; i += 1) {mask.push([bounds[i]]);}const m = new AMap.Map("container", {mask: mask,// 设置地图容器idviewMode: "3D", // 是否为3D地图模式zoom: 7, // 初始化地图级别resizeEnable: true,center: [101.917169, 24.766915], // 初始化地图中心点位置cursor: "pointer",});mapRef.current = m// 省市行政区域图层const disProvince = new AMap.DistrictLayer.Province({zIndex: 12,adcode: [530000], // 530000为云南行政区 行政区编码: https://a.amap.com/Loca/static/mock/adcodes.jsdepth: 0, // 显示程度 0 省级 1 市级 2 区/县级styles: {fill: function (properties) {// properties为可用于做样式映射的字段,包含// NAME_CHN:中文名称// adcode_pro// adcode_cit// adcodeif (properties.adcode === 530000) {// 云南省行政区域return "#CCE4FF";} else {return "#FFFFFF";}},"province-stroke": "cornflowerblue","city-stroke": "white", // 中国地级市边界"county-stroke": "rgba(255,255,255,0.5)", // 中国区县边界},});disProvince.setMap(m);var markers = [];var layer = new AMap.LabelsLayer({zooms: [3, 20],zIndex: 1000,// collision: false,// 设置 allowCollision:true,可以让标注避让用户的标注// allowCollision: true});layer.add(markers);// 图层添加到地图m.add(layer);// 将 marker 添加到图层layer.add(markers);});}).catch((e) => {console.log(e);});};// 报警、预警标注const markWarns = (data) => {if (mapRef.current) {// 没有报警时的图标对象var icon1 = {// 图标类型,现阶段只支持 image 类型type: "image",// 图片 urlimage: require("@/assets/images/comprehensiveBoard/noWarn.png"),// 图片尺寸size: [33, 33],// 图片相对 position 的锚点,默认为 bottom-centeranchor: "center",offset: [0, -20],};// 存在报警时的图标对象var icon2 = {// 图标类型,现阶段只支持 image 类型type: "image",// 图片 urlimage: require("@/assets/images/comprehensiveBoard/hasWarn.png"),// 图片尺寸size: [33, 33],// 图片相对 position 的锚点,默认为 bottom-centeranchor: "center",offset: [0, -20],};// 文本标注var textStyle = {fontSize: 10,fontWeight: "normal",fillColor: "#6C6C6C",fold: true,padding: "2, 5",borderColor: "#3D90F2",borderWidth: 1,};var LabelsData: any[] = []for(var i = 0; i < data.length; i++) {const item = data[i]const obj = {name: item.name,position: item.position,zooms: [3, 20], // 标注显示级别范围, 可选值:[3,20]opacity: 1,zIndex: 10,fold: false, // 文字是否折行(6个字一折行)icon: item.warnCount || item.earlyWarnCount ? icon2 : icon1,text: {// 要展示的文字内容content: item.company,// 文字方向,有 icon 时为围绕文字的方向,没有 icon 时,则为相对 position 的位置direction: "right",// 在 direction 基础上的偏移量offset: [0, -20],// 文字样式style: textStyle,},}LabelsData.push(obj)}var markers = [];var layer = new AMap.LabelsLayer({zooms: [3, 20],zIndex: 1000,// collision: false,// 设置 allowCollision:true,可以让标注避让用户的标注// allowCollision: true});layer.add(markers);// 图层添加到地图mapRef.current.add(layer);// 初始化 labelMarkerfor (var i = 0; i < LabelsData.length; i++) {var curData = LabelsData[i];const current = data[i]curData["extData"] = {index: i,};var labelMarker = new AMap.LabelMarker(curData);markers.push(labelMarker);// 给marker绑定事件 回显报警数量和预警数量labelMarker.on("mouseover", function (e) {var position = e.data.data && e.data.data.position;if (position && (current.warnCount || current.earlyWarnCount)) {normalMarker.setContent(`<div class="amap-info-window">` +`<div class="warn-tip-box">` +`<span>当前报警</span>` +`<span class="warn-count">${current.warnCount}</span>` +`</div>` +`<div class="early-warn-tip-box">` +`<span>预警数</span>` +`<span class="early-warn-count">${current.earlyWarnCount}</span>` +`</div>` +`</div>`);normalMarker.setPosition(position);normalMarker.setOffset(new AMap.Pixel(58, 40));mapRef.current.add(normalMarker);}});labelMarker.on("mouseout", function () {mapRef.current.remove(normalMarker);});}// 将 marker 添加到图层layer.add(markers);// m.setFitView(null, false, [100, 150, 10,10]);// 普通点var normalMarker = new AMap.Marker({anchor: "bottom-center",offset: [0, -15],});}}
这篇关于react开发高德地图,展示特定的行政区,并实现海量标注的文章就介绍到这儿,希望我们推荐的文章对编程师们有所帮助!


