本文主要是介绍学习笔记——echarts图表半圆仪表盘占满盒子,希望对大家解决编程问题提供一定的参考价值,需要的开发者们随着小编来一起学习吧!
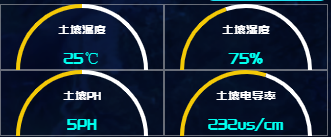
使用echarts图表绘制半圆仪表盘时,仪表盘太小无法塞满整个外层div盒子。
<!-- 导入echarts -->
<script src="/static/echarts.min.js"></script>
paintEchartsA("echarts1", 0.5)
paintEchartsA("echarts2", 0.4)
paintEchartsA("echarts3", 0.5)
paintEchartsA("echarts4", 0.6)// 绘制仪表图
function paintEchartsA(id, value) {let myChart = echarts.init(document.getElementById(id));let option = {tooltip: {formatter: '{a} <br/>{b} : {c}%'},grid: {left:0,top:0,right:0,bottom:0},pointer: {show: false},series: [{type: 'gauge',startAngle: 180,endAngle: -0,radius: "200%",center: ['50%', '100%'],splitLine: {show: false},axisTick: {show: false},pointer: {show: false},title: {show: false,textStyle: {fontSize: 10, //字体大小color: '#ffffff' //字体颜色}},detail: {color: "#fff",textBorderColor: '#327BFA',textBorderWidth: 4,textShadowColor: '#4A92EC',textShadowBlur: 14,offsetCenter: [0, 0],formatter: '{value}%',fontSize: 12,show: false},data: [{value: 0.5,}],axisLine: {show: true,lineStyle: {width: 4,color: [[value, '#F4C907'],[1, '#ffffff']]}},axisLabel: {show: false,color: "#fff"},itemStyle: {color: "#60acfc"}}]}myChart.setOption(option);
}其中,最重要的就是option配置中的radius和center属性。radius属性用来将半圆仪表盘放大两倍,再使用center调整仪表盘在盒子中的位置。
这篇关于学习笔记——echarts图表半圆仪表盘占满盒子的文章就介绍到这儿,希望我们推荐的文章对编程师们有所帮助!