本文主要是介绍【交互式阈值二进制图像】采用彩色或单色图像通过交互/手动方式阈值单色图像或彩色图像的单个色带研究(Matlab代码实现),希望对大家解决编程问题提供一定的参考价值,需要的开发者们随着小编来一起学习吧!
💥💥💞💞欢迎来到本博客❤️❤️💥💥
🏆博主优势:🌞🌞🌞博客内容尽量做到思维缜密,逻辑清晰,为了方便读者。
⛳️座右铭:行百里者,半于九十。
📋📋📋本文目录如下:🎁🎁🎁
目录
💥1 概述
📚2 运行结果
🎉3 参考文献
🌈4 Matlab代码实现

💥1 概述
【交互式阈值二进制图像】采用彩色或单色图像通过交互/手动方式阈值单色图像或彩色图像的单个色带
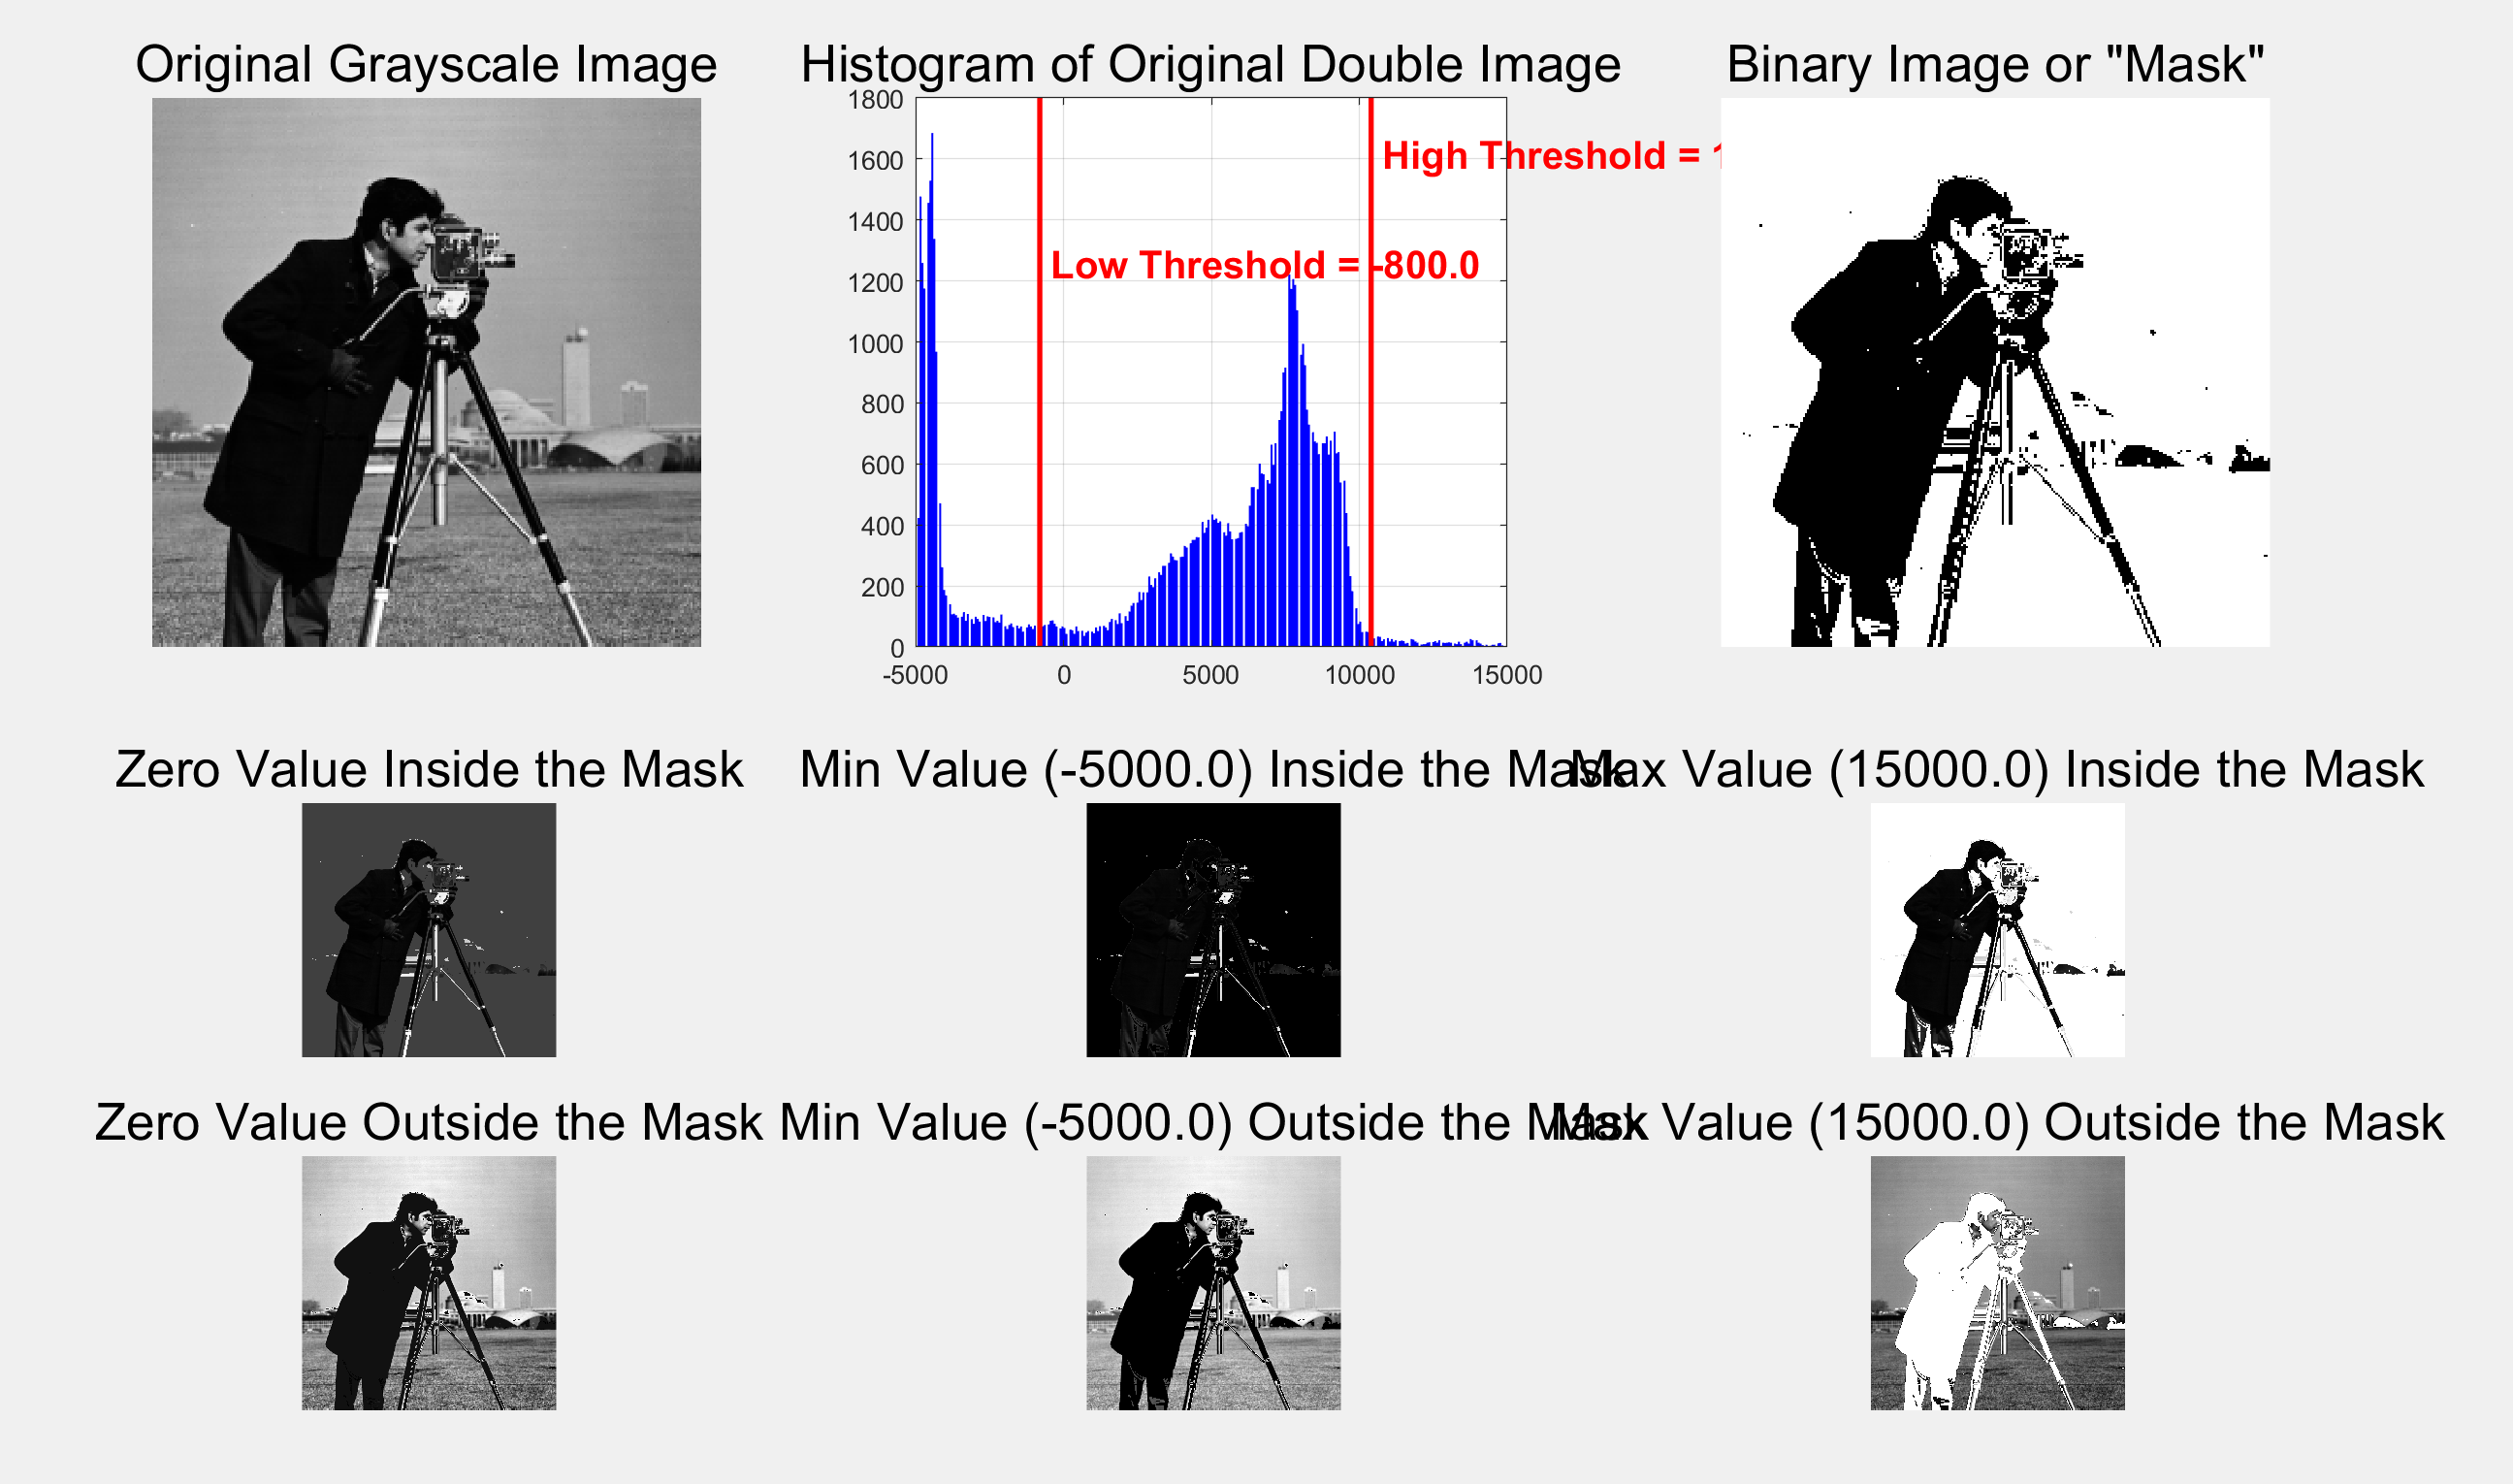
本文介绍了一种交互式阈值二进制图像的方法。该方法可以应用于彩色或单色图像,并且允许用户通过滑块的方式以交互/手动的方式设置图像的阈值范围。
阈值图像是一种二进制图像,可以用作其他图像的遮罩图像。在阈值范围内的像素将在中间图像中显示为二进制图像(黑/白),而原始图像的像素将在左侧图像中显示为遮罩(灰度或彩色)。用户可以通过设置最大和最小阈值来调整阈值范围,从而实现对图像的二值化处理。
该方法的输入包括要开始的低阈值和高阈值,以及图像文件名或图像矩阵。可以处理的图像类型包括整数类型(如uint8、uint16等)和浮点类型(如单精度、双精度)。
该方法的输出包括阈值范围和用于选择阈值的最后一个色带。用户可以根据自己的需求选择合适的阈值范围,并通过调整滑块来实现图像的二值化处理。
通过使用交互式阈值二进制图像的方法,用户可以更加灵活地处理彩色或单色图像,并根据需要调整阈值范围,从而得到满足自己需求的二值化图像。该方法具有简单、直观的操作界面,适用于各种图像处理应用场景。
📚2 运行结果


部分代码:
% Read in a standard MATLAB gray scale demo image.
folder = fileparts(which('cameraman.tif')); % Determine where demo folder is (works with all versions).
baseFileName = 'cameraman.tif';
fullFileName = fullfile(folder, baseFileName);
if ~exist(fullFileName, 'file')% File doesn't exist.  Try it without the folder.% It might be able to find it in a folder off the search path.fullFileName = baseFileName;if ~exist(fullFileName, 'file')% Can't find it off the search path either.errorMessage = sprintf('Error: cannot find demo image %s', baseFileName);uiwait(msgbox(errorMessage));return;end
end
grayImage = imread(fullFileName);
% Get the dimensions of the image.  numberOfColorBands should be = 1.
[rows, columns, numberOfColorBands] = size(grayImage);% Display the original gray scale image.
subplot(2, 3, 1);
imshow(grayImage, []);
axis off;
title('Original Grayscale Image', 'FontSize', fontSize);
% Set up figure properties.
set(gcf, 'Name', 'Thresholding Demo by ImageAnalyst', 'NumberTitle', 'off')
set(gcf, 'Toolbar', 'none', 'Menu', 'none');
set(gcf, 'Position', get(0,'Screensize')); % Enlarge figure to full screen.message = sprintf('Thresholding demo by ImageAnalyst.\n\nDo you want to use an integer image or a floating point image?');
button = questdlg(message, 'Image Type?', 'Integer', 'Floating Point', 'Cancel', 'Integer');
drawnow;	% Refresh screen to get rid of dialog box remnants.
if strcmpi(button, 'Cancel')close(gcf);	% Get rid of window.return;
end
if strcmpi(button, 'Floating Point')% Convert to double in the range -5000 to + 15000% Get input min and max.minGL = double(min(grayImage(:)));maxGL = double(max(grayImage(:)));% Scale the imageimageToThreshold = 20000 * mat2gray(grayImage) - 5000;% Verify themminDblGL = min(imageToThreshold(:));maxDblGL = max(imageToThreshold(:));fprintf('Before scaling, min gray level = %.1f, max gray level = %.1f\nAfter scaling,  min gray level = %.1f, max gray level = %.1f\n', ...minGL, maxGL, minDblGL, maxDblGL);startingLowThreshold = -800;startingHighThreshold = 10400;% Get the histogram[pixelCount, grayLevels] = hist(imageToThreshold(:), 300);subplot(2, 3, 2); bar(grayLevels, pixelCount, 'BarWidth', 1, 'FaceColor', 'b');title('Histogram of Original Double Image', 'FontSize', fontSize);xlim([minDblGL, maxDblGL]); % Scale x axis manually.
% Read in a standard MATLAB gray scale demo image.
folder = fileparts(which('cameraman.tif')); % Determine where demo folder is (works with all versions).
baseFileName = 'cameraman.tif';
fullFileName = fullfile(folder, baseFileName);
if ~exist(fullFileName, 'file')
% File doesn't exist. Try it without the folder.
% It might be able to find it in a folder off the search path.
fullFileName = baseFileName;
if ~exist(fullFileName, 'file')
% Can't find it off the search path either.
errorMessage = sprintf('Error: cannot find demo image %s', baseFileName);
uiwait(msgbox(errorMessage));
return;
end
end
grayImage = imread(fullFileName);
% Get the dimensions of the image. numberOfColorBands should be = 1.
[rows, columns, numberOfColorBands] = size(grayImage);
% Display the original gray scale image.
subplot(2, 3, 1);
imshow(grayImage, []);
axis off;
title('Original Grayscale Image', 'FontSize', fontSize);
% Set up figure properties.
set(gcf, 'Name', 'Thresholding Demo by ImageAnalyst', 'NumberTitle', 'off')
set(gcf, 'Toolbar', 'none', 'Menu', 'none');
set(gcf, 'Position', get(0,'Screensize')); % Enlarge figure to full screen.
message = sprintf('Thresholding demo by ImageAnalyst.\n\nDo you want to use an integer image or a floating point image?');
button = questdlg(message, 'Image Type?', 'Integer', 'Floating Point', 'Cancel', 'Integer');
drawnow; % Refresh screen to get rid of dialog box remnants.
if strcmpi(button, 'Cancel')
close(gcf); % Get rid of window.
return;
end
if strcmpi(button, 'Floating Point')
% Convert to double in the range -5000 to + 15000
% Get input min and max.
minGL = double(min(grayImage(:)));
maxGL = double(max(grayImage(:)));
% Scale the image
imageToThreshold = 20000 * mat2gray(grayImage) - 5000;
% Verify them
minDblGL = min(imageToThreshold(:));
maxDblGL = max(imageToThreshold(:));
fprintf('Before scaling, min gray level = %.1f, max gray level = %.1f\nAfter scaling, min gray level = %.1f, max gray level = %.1f\n', ...
minGL, maxGL, minDblGL, maxDblGL);
startingLowThreshold = -800;
startingHighThreshold = 10400;
% Get the histogram
[pixelCount, grayLevels] = hist(imageToThreshold(:), 300);
subplot(2, 3, 2);
bar(grayLevels, pixelCount, 'BarWidth', 1, 'FaceColor', 'b');
title('Histogram of Original Double Image', 'FontSize', fontSize);
xlim([minDblGL, maxDblGL]); % Scale x axis manually.
🎉3 参考文献
文章中一些内容引自网络,会注明出处或引用为参考文献,难免有未尽之处,如有不妥,请随时联系删除。
[1]龙建武,申铉京,陈海鹏.基于图像区域的交互式文本图像阈值分割算法[J].计算机研究与发展, 2012, 49(7):12.DOI:CNKI:SUN:JFYZ.0.2012-07-005.
[2]龙建武申铉京陈海鹏.基于图像区域的交互式文本图像阈值分割算法[J].计算机研究与发展, 2012, 49(7):1420-1431.
[3]兰红.多阈值优化的交互式医学图像分割方法[J].计算机科学, 2013, 40(9):4.DOI:10.3969/j.issn.1002-137X.2013.09.066.
🌈4 Matlab代码实现
这篇关于【交互式阈值二进制图像】采用彩色或单色图像通过交互/手动方式阈值单色图像或彩色图像的单个色带研究(Matlab代码实现)的文章就介绍到这儿,希望我们推荐的文章对编程师们有所帮助!


