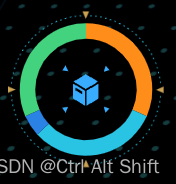
本文主要是介绍echarts利用graphic属性给饼图添加内圈图片及外圈图片(可自适应宽度位于饼图中心),希望对大家解决编程问题提供一定的参考价值,需要的开发者们随着小编来一起学习吧!
最终效果图:

目录
- 前言
- 资源
- 主要部分
- graphic介绍
- style介绍
- 代码
- 加载饼图方法(option所有的配置)
前言
思路是看到这个博客启发的:点击跳转查看博客,然后在graphic属性里改了我的实际需求,譬如图片的宽高、图片位置等。
资源
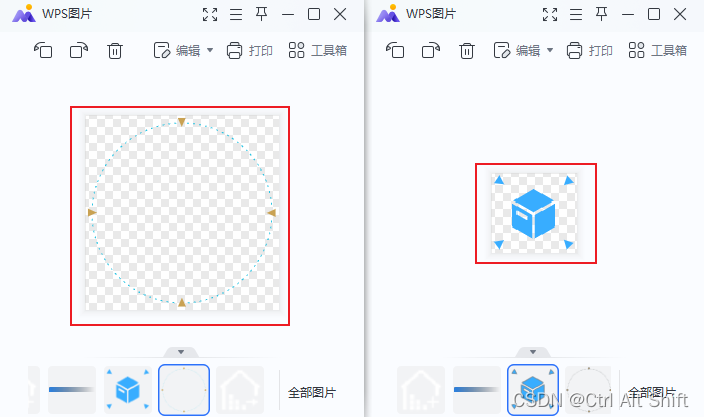
外围图片、内维图片可以自己定义。这里主要用到了两个图片:

主要部分
graphic介绍
在图表的option配置里,给graphic添加图片以及图片设置。left和top均设置为"center",可根据屏幕分辨率自动判断中心位置。
graphic用于添加自定义图形或文本元素到图表中的配置项,可添加文本、图形、图片等自定义元素,
这个属性通常用于创建一些特殊的标注或装饰,比如在特定位置添加一个文本标签、绘制一个自定义形状,或者放置一个图像等
常用的是添加文字和图片,下面是给图表通过graphic添加自定义文字的方法:
data.linebalance = 66.123;
option.graphic.push({type: "text",right: 155,top: 28,style: {text: "人工站线平衡率:",fill: "#fff", // 文字颜色fontSize: 14, // 文字大小},},{type: "text",right: 100,top: 28,style: {text: (data.linebalance * 100).toFixed(1) + "%",fill: "#fc8c1c", // 文字颜色fontSize: 14, // 文字大小},});
}
style介绍
style是其中一个常用的属性,用于设置图形元素的样式
image:指定图形元素所使用的图片资源,可以是图片的 URL 或者 dataURI。
width:指定图形元素的宽度。可以是整数值(像素),也可以是百分比值。如果需要自适应图表宽度,可以使用百分比值,但需要注意,有些情况下百分比值可能导致图片不显示,这可能是因为容器大小未正确设置或者其他原因。
height:指定图形元素的高度。同样可以是整数值(像素)或者百分比值。
opacity:指定图形元素的不透明度,取值范围为 0(完全透明)到 1(完全不透明)之间。
代码
通过graphic添加自定义图片的方法:
graphic: [{type: "image",id: "logo",//唯一值,不可与其他graphic里的id一致left: "center", //调整图片位置top: "center", //调整图片位置z: -10,//确保图片在饼图下方//设置图片样式style: {image: centerImg,// width: 80,// height: 80,width: ciclrImgChart.getWidth() - 105,height: ciclrImgChart.getWidth() - 105,opacity: 1,},},{type: "image",id: "logo2",//唯一值,不可与其他graphic里的id一致left: "center",top: "center",z: -10,//设置图片样式 width、height只能用整型值,不可用百分比(会导致图片不显示)style: {image: outCircleImg,// width: 200,// height: 200,width: ciclrImgChart.getWidth() + 5,height: ciclrImgChart.getWidth() + 5,opacity: 1,},},],
加载饼图方法(option所有的配置)
// 初始化圈形图initCircleImgFun() {var centerImg = require("./images/你的内圈图片路径.png");var outCircleImg = require("./images/你的外圈图片路径.png");if (ciclrImgChart != null && ciclrImgChart != "" && ciclrImgChart != undefined) {ciclrImgChart.dispose();}ciclrImgChart = echarts.init(document.getElementById("circleImgChart"));var option;option = {// 用于添加自定义图形或文本元素到图表中的配置项,可添加文本、图形、图片等自定义元素graphic: [{type: "image",id: "logo",left: "center", //调整图片位置top: "center", //调整图片位置z: -10,//设置图片样式style: {image: centerImg,// width: 80,// height: 80,width: ciclrImgChart.getWidth() - 105,height: ciclrImgChart.getWidth() - 105,opacity: 1,},},{type: "image",id: "logo2",//唯一值,不可与其他graphic里的id一致left: "center",top: "center",z: -10,//设置图片样式 width、height只能用整型值,不可用百分比(会导致图片不显示)style: {image: outCircleImg,// width: 200,// height: 200,width: ciclrImgChart.getWidth() + 5,height: ciclrImgChart.getWidth() + 5,opacity: 1,},},],series: [{type: "pie",radius: ["85%", "65%"],data: [{ value: 60, name: "4H未上架", percent: "30%" },{ value: 60, name: "0~2H未上架", percent: "30%" },{ value: 10, name: "2~4H未上架", percent: "10%" },{ value: 60, name: "正在检验", percent: "30%" },],hoverAnimation: false,label: {normal: {show: false,},},color: ["#ff8d1a", "#29c4e3", "#2a82e4", "#43cf7c"],},],};option && ciclrImgChart.setOption(option);},
这篇关于echarts利用graphic属性给饼图添加内圈图片及外圈图片(可自适应宽度位于饼图中心)的文章就介绍到这儿,希望我们推荐的文章对编程师们有所帮助!


