本文主要是介绍OpenTelemetry——What is OpenTelemetry,希望对大家解决编程问题提供一定的参考价值,需要的开发者们随着小编来一起学习吧!
What is OpenTelemetry?
什么是 OpenTelemetry?
A short explanation of what OpenTelemetry is and isn’t.
对 OpenTelemetry 是什么和不是什么的简短说明
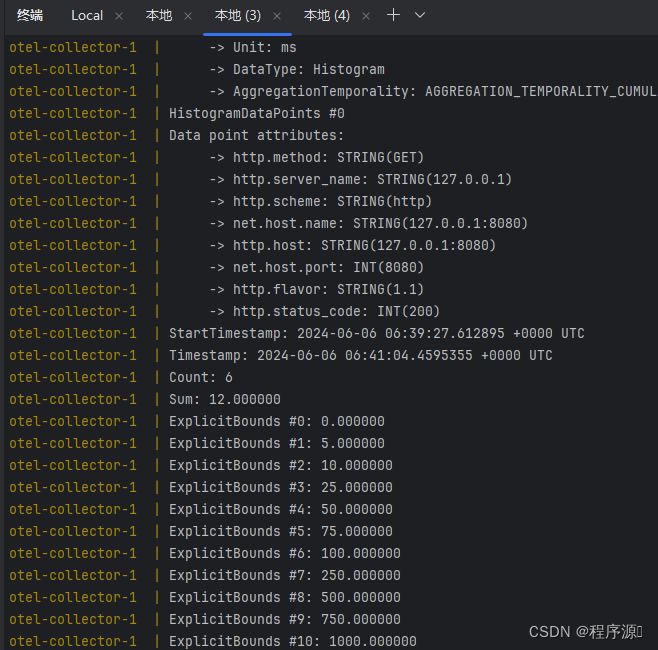
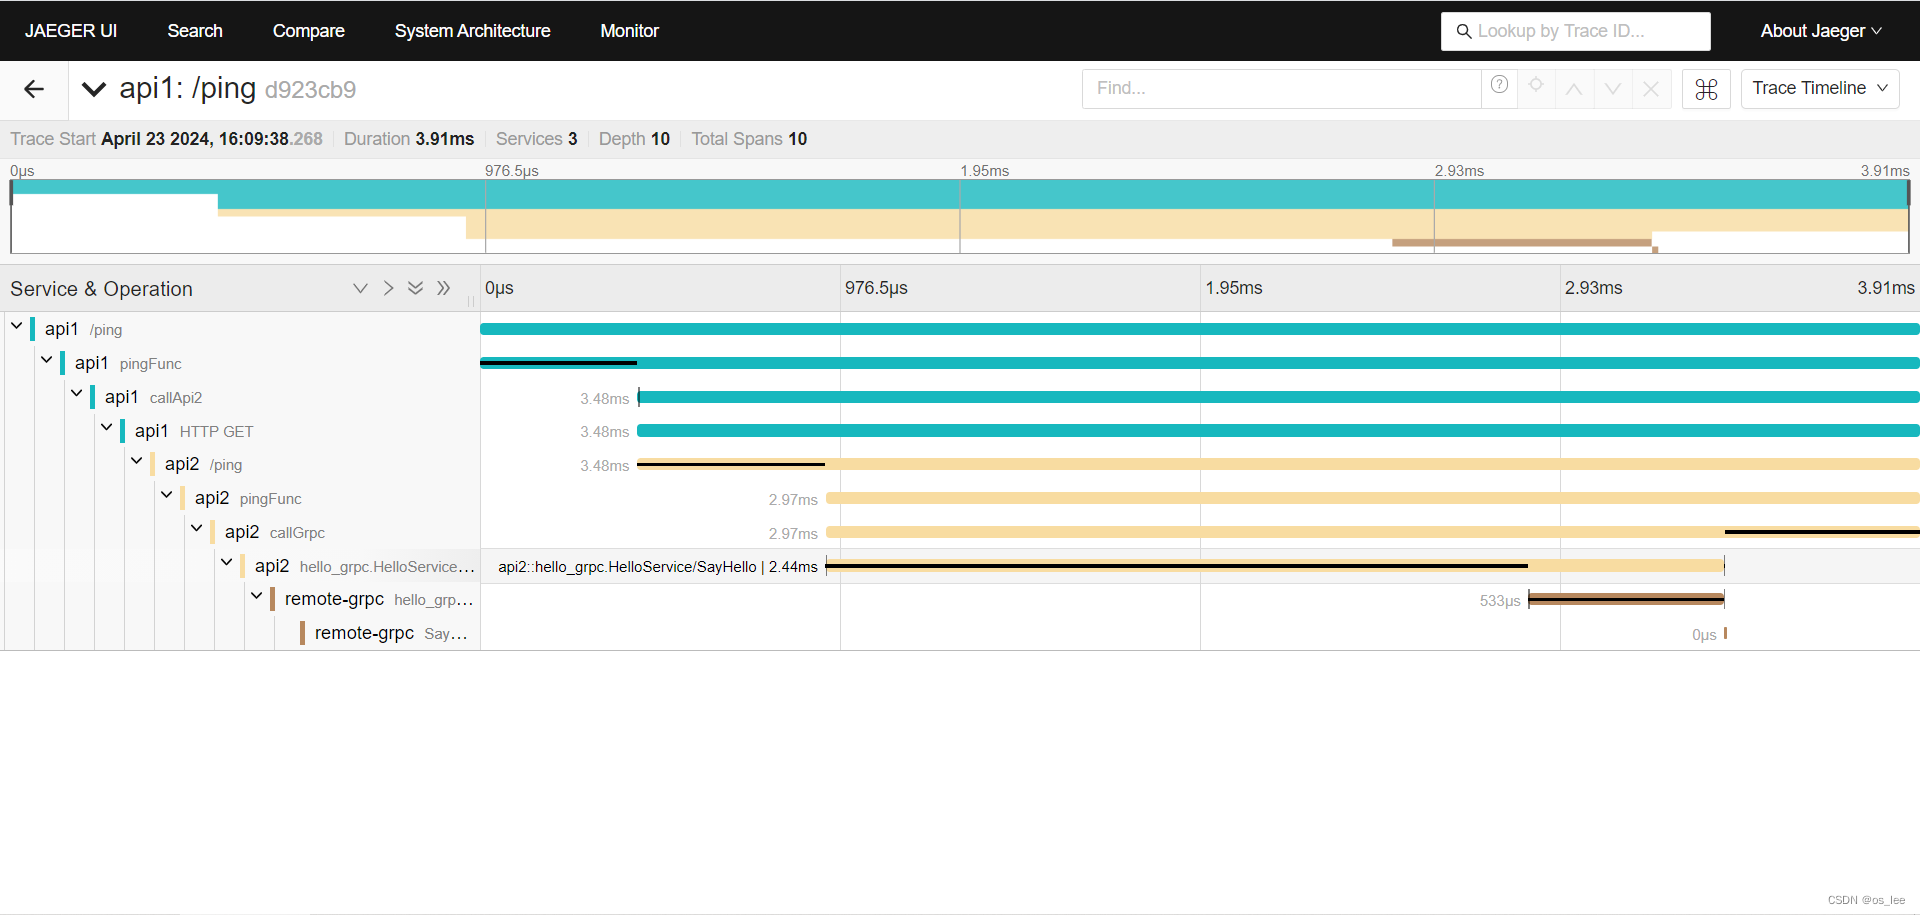
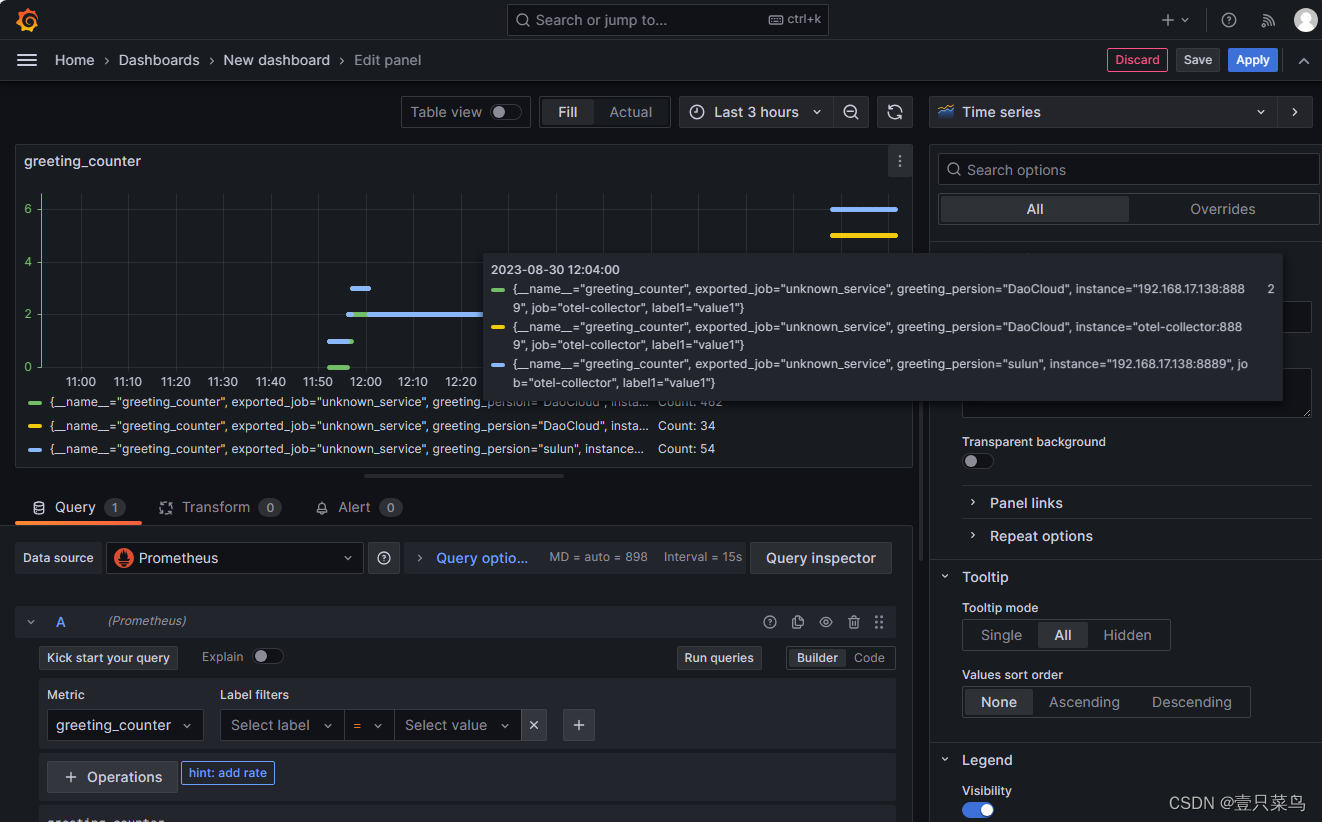
OpenTelemetry is an Observability framework and toolkit designed to create and manage telemetry data such as traces, metrics, and logs. Crucially, OpenTelemetry is vendor- and tool-agnostic, meaning that it can be used with a broad variety of Observability backends, including open source tools like Jaeger and Prometheus, as well as commercial offerings.
OpenTelemetry 是一个可观测性框架和工具包,旨在创建和管理telemetry数据,例如Traces、Metrics和Logs。至关重要的是,OpenTelemetry 是与(软件)供应商或工具无关的,这意味着它可以与各种可观测性后端一起使用,包括 Jaeger和 Prometheus 等开源工具,以及商业产品。
OpenTelemetry is not an observability backend like Jaeger, Prometheus, or other commercial vendors. OpenTelemetry is focused on the generation, collection, management, and export of telemetry. A major goal of OpenTelemetry is that you can easily instrument your applications or systems, no matter their language, infrastructure, or runtime environment. Crucially, the storage and visualization of telemetry is intentionally left to other tools.
OpenTelemetry 不像Jaeger、Prometheus或其他商业(软件)供应商。OpenTelemetry专注于生成、收集、管理和导出telemetry数据。OpenTelemetry 的一个主要目标是可以轻松测量您的应用程序或系统,无论其使用何种语言, 基础结构或运行时环境。至关重要的是,telemetry数据的存储和可视化被有意留给其他工具来实现。
What is observability?
什么是可观测性?
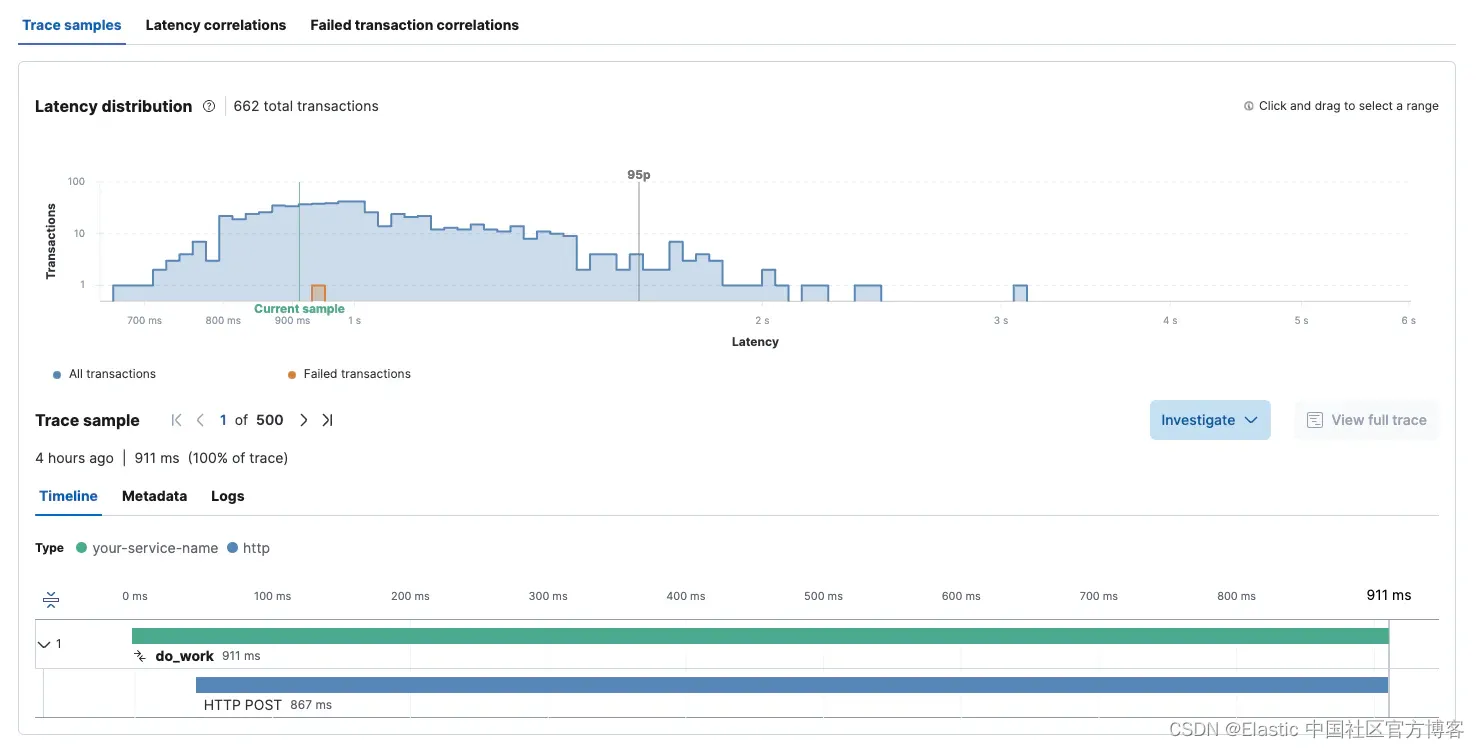
Observability is the ability to understand the internal state of a system by examining its outputs. In the context of software, this means being able to understand the internal state of a system by examining its telemetry data, which includes traces, metrics, and logs.
可观测性是通过检查系统的输出,来理解其内部状态的能力。在软件的背景下,这意味着能够通过检查系统的遥测数据来理解系统的内部状态,其中包括Trace、Metric和Logs。
To make a system observable, it must be instrumented. That is, the code must emit traces, metrics, or logs. The instrumented data must then be sent to an observability backend.
要使系统可观察,必须对其进行测量。也就是说,代码必须产生跟踪、指标或日志等信息。然后,将测量的数据发送到可观测性后端。
Why OpenTelemetry?
为什么选择 OpenTelemetry?
With the rise of cloud computing, microservices architectures, and increasingly complex business requirements, the need for software and infrastructure observability is greater than ever.
随着云计算、微服务架构的兴起,以及越来越多复杂的业务需求,对软件和基础设施可观测性的需求是比以往任何时候都更迫切。
OpenTelemetry satisfies the need for observability while following two key principles:
OpenTelemetry满足了对可观测性的需求,同时遵循两个关键原则:
- You own the data that you generate. There’s no vendor lock-in.
您拥有生成的数据。没有和供应商绑定。 - You only have to learn a single set of APIs and conventions.
您只需要学习一组 API 和约定。
Both principles combined grant teams and organizations the flexibility they need in today’s modern computing world.
在当今的现代计算世界中,这两项原则都为团队和组织提供了他们所需的灵活性 。
If you want to learn more, take a look at OpenTelemetry’s mission, vision, and values.
如果您想了解更多信息,请查看OpenTelemetry的使命、愿景和价值观。
Main OpenTelemetry components
OpenTelemetry主要的组件
OpenTelemetry consists of the following major components:
OpenTelemetry由以下主要组件组成:
- A specification for all components
- 所有组件的规范
- A standard protocol that defines the shape of telemetry data
- 定义遥测数据样式的标准协议
- Semantic conventions that define a standard naming scheme for common telemetry data types
- 为常见遥测数据类型定义标准命名方案的语义约定
- APIs that define how to generate telemetry data
- 定义如何生成遥测数据的API
- Language SDKs that implement the specification, APIs, and export of telemetry data
- 实现了规范、APIs和导出遥测数据功能的各种编程语言SDK
- A library ecosystem that implements instrumentation for common libraries and frameworks
- 实现了常见测量装置的库和框架的生态系统
- Automatic instrumentation components that generate telemetry data without requiring code changes
- 在不修改代码的场景下,生成遥测数据的自动测量装置组件
- The OpenTelemetry Collector, a proxy that receives, processes, and exports telemetry data
- OpenTelemetry Collector,一个接收处理和导出遥测数据的代理
- Various other tools, such as the OpenTelemetry Operator for Kubernetes, OpenTelemetry Helm Charts, and community assets for FaaS
- 各种其他工具,例如适用于 Kubernetes 的 OpenTelemetry Operator、OpenTelemetry Helm Charts 和 FaaS 的社区资产
OpenTelemetry is used by a wide variety of libraries, services and apps that have OpenTelemetry integrated to provide observability by default.
OpenTelemetry被大量的库、服务和应用使用。它们集成OpenTelemetry以提供可观测性。
OpenTelemetry is supported by numerous vendors, many of whom provide commercial support for OpenTelemetry and contribute to the project directly.
OpenTelemetry受到众多(软件)供应商的支持,其中许多供应商为OpenTelemetry提供了商业支持,并直接参与了该项目。
Extensibility
扩展
OpenTelemetry is designed to be extensible. Some examples of how it can be extended include:
OpenTelemetry被设计为可扩展的。下面的例子中包含了它是如何被扩展的:
- Adding a receiver to the OpenTelemetry Collector to support telemetry data from a custom source
- 给OpenTelemetry Collector添加一个接收器(receiver),用于接收自定义源的遥测数据。
- Loading custom instrumentation libraries into an SDK
- 将自定义测量装置库加载到软件开发包中。
- Creating a distribution of an SDK or the Collector tailored to a specific use case
- 创建针对特定用例量身定制的SDK或收集器。
- Creating a new exporter for a custom backend that doesn’t yet support the OpenTelemetry protocol (OTLP)
- 为尚不支持OpenTelemetry协议(OTLP)的自定义后端创建导出器。
- Creating a custom propagator for a nonstandard context propagation format
- 为非标准上下文传播格式创建自定义传播器。
Although most users might not need to extend OpenTelemetry, the project is designed to make it possible at nearly every level.
尽管大多数用户可能不需要扩展 OpenTelemetry,但该项目是旨在使它几乎在每个级别上都可以被扩展。
History
历史
OpenTelemetry is a Cloud Native Computing Foundation (CNCF) project that is the result of a merger between two prior projects, OpenTracing and OpenCensus . Both of these projects were created to solve the same problem: the lack of a standard for how to instrument code and send telemetry data to an Observability backend. As neither project was fully able to solve the problem independently, they merged to form OpenTelemetry and combine their strengths while offering a single solution.
OpenTelemetry 是一个云原生计算基金会 (CNCF) 项目。它是之前两个项目OpenTracing和OpenCensus合并的结果。 这两个项目都是为了解决同一个问题而创建的:缺乏一套如何测量代码并将Telemetry数据发送到可观测性后端的标准。由于这两个项目都无法完全独立解决问题,它们合并形成了 OpenTelemetry,并结合了它们的优势,同时也提供了单一解决方案。
If you are currently using OpenTracing or OpenCensus, you can learn how to migrate to OpenTelemetry in the Migration guide.
如果您当前正在使用 OpenTracing 或 OpenCensus,您可以了解迁移指南中的内容以迁移到 OpenTelemetry。
What next?
Getting started — jump right in!
Learn about OpenTelemetry concepts.
这篇关于OpenTelemetry——What is OpenTelemetry的文章就介绍到这儿,希望我们推荐的文章对编程师们有所帮助!