本文主要是介绍企业主流全链路监控系统 - OpenTelemetry(二),希望对大家解决编程问题提供一定的参考价值,需要的开发者们随着小编来一起学习吧!
OpenTelemetry 二
- 4. 部署(python)
- 准备工作(1/5)
- 创建 HTTP Server(2/5)
- Automatic instrumentation(3/5)
- 增加观测项(Manual)(4/5)
- 向 Collector 发送 OTLP 协议数据(5/5)
- 5. 部署 OpenTelemetry + Prometheus + Grafana
- 修改配置文件(1/5)
- 启动容器(2/5)
- 启动业务服务(3/5)
- 查看数据Prometheus(4/5)
- 查看grafana(5/5)

4. 部署(python)
现在来一步步为 demo 程序接入 OTel ,本文举例 Python 的 demo进行部署
准备工作(1/5)
第一步是环境的设置和包的安装。笔者用 centos7 安装了 Python 3.6.8 之后,用 pip 安装 Otel 所需的包。
pip3 install flask
pip3 install opentelemetry-distro
cd /opt/
mkdir otel-demo
cd otel-demo
opentelemetry-distro 将 API、SDK、opentelemetry-bootstrap、opentelemetry-instrument 这些包集合在一起,稍后都会用到。
创建 HTTP Server(2/5)
[root@node-138 otel-demo]# cat app.py
#!/usr/bin/python envfrom flask import Flask,requestapp=Flask(__name__)@app.route("/greeting")
def greeting():user = request.args.get("user", "DaoCloud")return "hello, Cloud Native! This is %s."%user
这里将先用 Automatic instrumentation 的方式为这个小 flask 应用接入 OTel。
Automatic instrumentation(3/5)
这种方式取代繁琐操作并自动生成一些基础观测数据,这里用最简单的方式。
opentelemetry-bootstrap -a install
这条命令会探测已经安装的库并自动地为开发人员安装 “接入” 所需的相关包。
[root@node-138 otel-demo]# opentelemetry-bootstrap
opentelemetry-instrumentation-aws-lambda==0.33b0
opentelemetry-instrumentation-dbapi==0.33b0
opentelemetry-instrumentation-logging==0.33b0
opentelemetry-instrumentation-sqlite3==0.33b0
opentelemetry-instrumentation-urllib==0.33b0
opentelemetry-instrumentation-wsgi==0.33b0
opentelemetry-instrumentation-flask==0.33b0
opentelemetry-instrumentation-jinja2==0.33b0
在 opentelemetry-instrument 的帮助中可以看到很多选项,这些选项都一一对应了 OTel 中可以配置的环境变量,并且命令行中输入的变量优先级会高于默认配置的变量。
[root@node-138 ~]# opentelemetry-instrument -h
usage: opentelemetry-instrument [-h][--attribute_count_limit ATTRIBUTE_COUNT_LIMIT][--attribute_value_length_limit ATTRIBUTE_VALUE_LENGTH_LIMIT]
...command ......--exporter_otlp_traces_certificate EXPORTER_OTLP_TRACES_CERTIFICATE--exporter_otlp_traces_compression EXPORTER_OTLP_TRACES_COMPRESSION--exporter_otlp_traces_endpoint EXPORTER_OTLP_TRACES_ENDPOINT
...--traces_exporter TRACES_EXPORTER--version             print version information...
到这一步应用其实完成了 OTel 的接入,来启动下服务看看效果。
opentelemetry-instrument --traces_exporter console --metrics_exporter console flask run
启动命令执行后,另起一个窗口向这个 HTTP Server 发送一个请求,来看看最终效果。
[root@node-138 ~]# curl 127.0.0.1:5000/greeting
hello, Cloud Native! This is DaoCloud.
主窗口
[root@node-138 otel-demo]# opentelemetry-instrument --traces_exporter console --metrics_exporter console flask run
You are using Python 3.6. This version does not support timestamps with nanosecond precision and the OpenTelemetry SDK will use millisecond precision instead. Please refer to PEP 564 for more information. Please upgrade to Python 3.7 or newer to use nanosecond precision.* Environment: productionWARNING: This is a development server. Do not use it in a production deployment.Use a production WSGI server instead.* Debug mode: off* Running on http://127.0.0.1:5000/ (Press CTRL+C to quit)
127.0.0.1 - - [30/Aug/2023 08:44:57] "GET /greeting HTTP/1.1" 200 -
{"name": "/greeting","context": {"trace_id": "0x72c633526437624bfb78df6f5e1210c3","span_id": "0x2b65163734329c43","trace_state": "[]"},"kind": "SpanKind.SERVER","parent_id": null,"start_time": "2023-08-30T00:44:57.362599Z","end_time": "2023-08-30T00:44:57.364329Z","status": {"status_code": "UNSET"},"attributes": {"http.method": "GET","http.server_name": "127.0.0.1","http.scheme": "http","net.host.port": 5000,"http.host": "127.0.0.1:5000","http.target": "/greeting","net.peer.ip": "127.0.0.1","http.user_agent": "curl/7.29.0","net.peer.port": 47178,"http.flavor": "1.1","http.route": "/greeting","http.status_code": 200},"events": [],"links": [],"resource": {"attributes": {"telemetry.sdk.language": "python","telemetry.sdk.name": "opentelemetry","telemetry.sdk.version": "1.12.0","telemetry.auto.version": "0.33b0","service.name": "unknown_service"},"schema_url": ""}
}
{"resource_metrics": [{"resource": {"attributes": {"telemetry.sdk.language": "python", "telemetry.sdk.name": "opentelemetry", "telemetry.sdk.version": "1.12.0", "telemetry.auto.version": "0.33b0", "service.name": "unknown_service"}, "schema_url": ""}, "scope_metrics": [{"scope": {"name": "opentelemetry.instrumentation.flask", "version": "0.33b0", "schema_url": ""}, "metrics": [{"name": "http.server.active_requests", "description": "measures the number of concurrent HTTP requests that are currently in-flight", "unit": "requests", "data": {"data_points": [{"attributes": {"http.method": "GET", "http.host": "127.0.0.1:5000", "http.scheme": "http", "http.flavor": "1.1", "http.server_name": "127.0.0.1"}, "start_time_unix_nano": 1693356297362655744, "time_unix_nano": 1693356352010139136, "value": 0}], "aggregation_temporality": 2, "is_monotonic": false}}, {"name": "http.server.duration", "description": "measures the duration of the inbound HTTP request", "unit": "ms", "data": {"data_points": [{"attributes": {"http.method": "GET", "http.host": "127.0.0.1:5000", "http.scheme": "http", "http.flavor": "1.1", "http.server_name": "127.0.0.1", "net.host.port": 5000, "http.status_code": 200}, "start_time_unix_nano": 1693356297364467968, "time_unix_nano": 1693356352010139136, "count": 1, "sum": 2, "bucket_counts": [0, 1, 0, 0, 0, 0, 0, 0, 0, 0, 0], "explicit_bounds": [0.0, 5.0, 10.0, 25.0, 50.0, 75.0, 100.0, 250.0, 500.0, 1000.0], "min": 2, "max": 2}], "aggregation_temporality": 2}}], "schema_url": ""}], "schema_url": ""}]}
上面分别是一次请求的 traces 和 metrics 信息,这些信息便是 automatic instrumentation 为用户”内置“的观测项。比如跟踪 /greeting 路由请求的生命周期数据,以及 http.server.active_requests、 http.server.duration 等指标数据。但实际生产中为应用构建可观测性这些数据还远远不够。
增加观测项(Manual)(4/5)
自动的集成为用户提供了一些基础的观测数据,但这些数据多来自系统 ”边缘“,比如带内或带外的 HTTP 请求,并不能给用户展示应用内部的情况,下面在 Automatic instrumentation 的基础上再手动增加一些观测能力。
- Traces
[root@node-138 otel-demo]# cat app.py
#!/usr/bin/python envfrom flask import Flask,request
from opentelemetry import traceapp=Flask(__name__)
tracer=trace.get_tracer(__name__)@app.route("/greeting")
def greeting():with tracer.start_as_current_span("greeting") as greeting_span:user = request.args.get("user", "DaoCloud")greeting_words = "hello, Cloud Native! This is %s."%usergreeting_span.set_attribute("greeting.content",greeting_words)greeting_span.set_attribute("greeting.person",user)return greeting_words
初始化出一个 tracer 并创建出一条 trace 数据(也就是 span,他属于自动集成所创建的 span 数据的子 span)。
再一次运行服务并请求。
[root@node-138 otel-demo]# opentelemetry-instrument --traces_exporter console -- metrics_exporter console flask run
You are using Python 3.6. This version does not support timestamps with nanoseco                                                          nd precision and the OpenTelemetry SDK will use millisecond precision instead. P                                                          lease refer to PEP 564 for more information. Please upgrade to Python 3.7 or new                                                          er to use nanosecond precision.* Environment: productionWARNING: This is a development server. Do not use it in a production deployme                                                          nt.Use a production WSGI server instead.* Debug mode: off* Running on http://127.0.0.1:5000/ (Press CTRL+C to quit)
127.0.0.1 - - [30/Aug/2023 08:57:40] "GET /greeting HTTP/1.1" 200 -
{"name": "greeting","context": {"trace_id": "0x5e489ef3e6d5ba767676bb23ff31842f","span_id": "0xb2fbc81eb8ae804d",								"trace_state": "[]"},"kind": "SpanKind.INTERNAL","parent_id": "0x7553887517e8ff6f",									#parent_id"start_time": "2023-08-30T00:57:40.131915Z","end_time": "2023-08-30T00:57:40.132000Z","status": {"status_code": "UNSET"},"attributes": {"greeting.content": "hello, Cloud Native! This is DaoCloud.",#新增属性"greeting.person": "DaoCloud"															#新增属性},"events": [],"links": [],"resource": {"attributes": {"telemetry.sdk.language": "python","telemetry.sdk.name": "opentelemetry","telemetry.sdk.version": "1.12.0","telemetry.auto.version": "0.33b0","service.name": "unknown_service"},"schema_url": ""}
}
{"name": "/greeting","context": {"trace_id": "0x5e489ef3e6d5ba767676bb23ff31842f","span_id": "0x7553887517e8ff6f",								#span_id"trace_state": "[]"},"kind": "SpanKind.SERVER","parent_id": null,"start_time": "2023-08-30T00:57:40.130697Z","end_time": "2023-08-30T00:57:40.132480Z","status": {"status_code": "UNSET"},"attributes": {"http.method": "GET","http.server_name": "127.0.0.1","http.scheme": "http","net.host.port": 5000,"http.host": "127.0.0.1:5000","http.target": "/greeting","net.peer.ip": "127.0.0.1","http.user_agent": "curl/7.29.0","net.peer.port": 47186,"http.flavor": "1.1","http.route": "/greeting","http.status_code": 200},"events": [],"links": [],"resource": {"attributes": {"telemetry.sdk.language": "python","telemetry.sdk.name": "opentelemetry","telemetry.sdk.version": "1.12.0","telemetry.auto.version": "0.33b0","service.name": "unknown_service"},"schema_url": ""}
}
可以看到手动创建的 greeting span 的 parent_id 和 /greeting 的 span_id 是一样,表示着父子关系。
- Metrics
[root@node-138 otel-demo]# cat app.py
#!/usr/bin/python envfrom flask import Flask,request
from opentelemetry import trace,metricsapp=Flask(__name__)
tracer=trace.get_tracer(__name__)
meter=metrics.get_meter(__name__)
greeting_counter=meter.create_counter("greeting_counter",description="The number of greeting times of each person",
)@app.route("/greeting")
def greeting():with tracer.start_as_current_span("greeting") as greeting_span:user = request.args.get("user", "DaoCloud")greeting_words = "hello, Cloud Native! This is %s."%usergreeting_span.set_attribute("greeting.content",greeting_words)greeting_span.set_attribute("greeting.person",user)greeting_counter.add(1, {"greeting.persion": user})return greeting_words
初始化出一个 meter 并创建一个 Counter,来对每一个 user 参数来计数(统计调用次数)。
再次运行服务,这次发送多个不同的请求。
curl http://localhost:5000/greeting  # 1
curl http://localhost:5000/greeting	 # 2
curl http://localhost:5000/greeting	 # 3
curl http://localhost:5000/greeting?user=sulun  # 4
观察结果
[root@node-138 otel-demo]# opentelemetry-instrument --traces_exporter console --                                                          metrics_exporter console flask run
...
{"resource_metrics": [{"resource": {"attributes": {"telemetry.sdk.language": "python", "telemetry.sdk.name": "opentelemetry", "telemetry.sdk.version": "1.12.0", "telemetry.auto.version": "0.33b0", "service.name": "unknown_service"}, "schema_url": ""}, "scope_metrics": [{"scope": {"name": "opentelemetry.instrumentation.flask", "version": "0.33b0", "schema_url": ""}, "metrics": [{"name": "http.server.active_requests", "description": "measures the number of concurrent HTTP requests that are currently in-flight", "unit": "requests", "data": {"data_points": [{"attributes": {"http.method": "GET", "http.host": "127.0.0.1:5000", "http.scheme": "http", "http.flavor": "1.1", "http.server_name": "127.0.0.1"}, "start_time_unix_nano": 1693357979607876096, "time_unix_nano": 1693357993432316672, "value": 0}, {"attributes": {"http.method": "GET", "http.host": "localhost:5000", "http.scheme": "http", "http.flavor": "1.1", "http.server_name": "127.0.0.1"}, "start_time_unix_nano": 1693357979607876096, "time_unix_nano": 1693357993432316672, "value": 0}], "aggregation_temporality": 2, "is_monotonic": false}}, {"name": "http.server.duration", "description": "measures the duration of the inbound HTTP request", "unit": "ms", "data": {"data_points": [{"attributes": {"http.method": "GET", "http.host": "127.0.0.1:5000", "http.scheme": "http", "http.flavor": "1.1", "http.server_name": "127.0.0.1", "net.host.port": 5000, "http.status_code": 200}, "start_time_unix_nano": 1693357979609903616, "time_unix_nano": 1693357993432316672, "count": 3, "sum": 4, "bucket_counts": [0, 3, 0, 0, 0, 0, 0, 0, 0, 0, 0], "explicit_bounds": [0.0, 5.0, 10.0, 25.0, 50.0, 75.0, 100.0, 250.0, 500.0, 1000.0], "min": 1, "max": 2}, {"attributes": {"http.method": "GET", "http.host": "localhost:5000", "http.scheme": "http", "http.flavor": "1.1", "http.server_name": "127.0.0.1", "net.host.port": 5000, "http.status_code": 200}, "start_time_unix_nano": 1693357979609903616, "time_unix_nano": 1693357993432316672, "count": 1, "sum": 1, "bucket_counts": [0, 1, 0, 0, 0, 0, 0, 0, 0, 0, 0], "explicit_bounds": [0.0, 5.0, 10.0, 25.0, 50.0, 75.0, 100.0, 250.0, 500.0, 1000.0], "min": 1, "max": 1}], "aggregation_temporality": 2}}], "schema_url": ""}, {"scope": {"name": "app", "version": "", "schema_url": ""}, "metrics": [{"name": "greeting_counter", "description": "The number of greeting times of each person", "unit": "", "data": {"data_points": [{"attributes": {"greeting.persion": "DaoCloud"}, "start_time_unix_nano": 1693357979609319424, "time_unix_nano": 1693357993432316672, "value": 3}, {"attributes": {"greeting.persion": "sulun"}, "start_time_unix_nano": 1693357979609319424, "time_unix_nano": 1693357993432316672, "value": 1}], "aggregation_temporality": 2, "is_monotonic": true}}], "schema_url": ""}], "schema_url": ""}]}
这次发送了3次默认调用,以及1次带 user 参数的调用,这个行为被之前设置的 Counter 统计到并生成了 metrics 数据。
以上步骤就是引入 OTel 以及手动增加 Traces 和 Metrics 数据的初步过程。至于 Logs 模块,因为刚刚选择了 export to console 的启动方式,而将 logs 输出到 console 就和正常打印一条日志的效果相同,所以本节先不演示,接下来结合 OTLP 的内容一起看下 OTel 中 Logs 模块的表现。
向 Collector 发送 OTLP 协议数据(5/5)
Collector 的关键作用在前面已经介绍过一些,下面列举一些 Collector 可以带来的好处:
- Collecter 可以使多种服务共用一个观测数据池,从而减少切换 Exporter 的开销。
- Collector 可以将跨主机的、跨服务的同一条 trace 数据聚合到一起。
- Collector 提供一个将数据吐到后端前的中转站,提供提前分析过滤数据的能力。
下面来演示对接一个简单的 Collector。
首先,在 app.py 文件的路径下,再创建一个 tmp/ 文件夹,并创建一个 otel-collector-config.yaml 文件。
[root@node-138 tmp]# cat otel-collector-config.yaml
receivers:otlp:protocols:grpc:
exporters:logging:loglevel: debug
processors:batch:
service:pipelines:traces:receivers: [otlp]exporters: [logging]processors: [batch]metrics:receivers: [otlp]exporters: [logging]processors: [batch]
接下来拉取 OTel 提供的基础 Collector 镜像,启动一个 Collector。
docker run -p 4317:4317 -v /opt/otel-demo/tmp/otel-collector-config.yaml:/etc/otel-collector-config.yaml otel/opentelemetry-collector:latest --config=/etc/otel-collector-config.yaml
命令不难理解,将配置文件挂载后,监听 Collector 默认的 4317 端口。
docker run -p 4317:4317 -v /opt/otel-demo/tmp/otel-collector-config.yaml:/etc/otel-collector-config.yaml  otel/opentelemetry-collector:latest  --config=/etc/otel-collector-config.yaml
2023-08-30T01:48:04.874Z        info    service/telemetry.go:84 Setting up own telemetry...
...
2023-08-30T01:48:04.878Z        info    otlpreceiver@v0.84.0/otlp.go:83 Starting GRPC server    {"kind": "receiver", "name": "otlp", "data_type": "metrics", "endpoint": "0.0.0.0:4317"}
然后需要将之前自动及手动抓取的观测数据,通过 OTLP 协议转换为标准格式,发送到 Collector。
这一步需要 OTLP 协议的 Exporter,而 OTel 社区也为用户准备好了安装包。
pip3 install opentelemetry-exporter-otlp
现在再启动一次应用。
opentelemetry-instrument flask run
这里已经不再需要指定--traces_exporter console等参数,因为这里也借助了 Automatic instrumentation 的能力,instrument agent 会自动的监测到刚刚安装的包,并在下一次启动时,为用户切换到 OTLP/gRPC 协议的 Exporter,默认目标端口也是 4317。
再次请求服务,Collector 进程会接收到 OTLP 标准数据,而原 Flask 进程不会再展示 telemetry 数据。
- Traces
Resource SchemaURL:
Resource attributes:-> telemetry.sdk.language: Str(python)-> telemetry.sdk.name: Str(opentelemetry)-> telemetry.sdk.version: Str(1.12.0)-> telemetry.auto.version: Str(0.33b0)-> service.name: Str(unknown_service)
ScopeSpans #0
ScopeSpans SchemaURL:
InstrumentationScope app
Span #0Trace ID       : 9d67e3b1f2e6f40a0925fd7951bc0942Parent ID      : f73a56bacf0c1a05ID             : 5e764b6a40cab9c3Name           : greetingKind           : InternalStart time     : 2023-08-30 01:49:22.416530944 +0000 UTCEnd time       : 2023-08-30 01:49:22.416732416 +0000 UTCStatus code    : UnsetStatus message :
Attributes:-> greeting.content: Str(hello, Cloud Native! This is DaoCloud.)-> greeting.person: Str(DaoCloud)
ScopeSpans #1
ScopeSpans SchemaURL:
InstrumentationScope opentelemetry.instrumentation.flask 0.33b0
Span #0Trace ID       : 9d67e3b1f2e6f40a0925fd7951bc0942Parent ID      :ID             : f73a56bacf0c1a05Name           : /greetingKind           : ServerStart time     : 2023-08-30 01:49:22.414059776 +0000 UTCEnd time       : 2023-08-30 01:49:22.417396224 +0000 UTCStatus code    : UnsetStatus message :
Attributes:-> http.method: Str(GET)-> http.server_name: Str(127.0.0.1)-> http.scheme: Str(http)-> net.host.port: Int(5000)-> http.host: Str(127.0.0.1:5000)-> http.target: Str(/greeting)-> net.peer.ip: Str(127.0.0.1)-> http.user_agent: Str(curl/7.29.0)-> net.peer.port: Int(47980)-> http.flavor: Str(1.1)-> http.route: Str(/greeting)-> http.status_code: Int(200){"kind": "exporter", "data_type": "traces", "name": "logging"}
2023-08-30T01:49:34.750Z        info    MetricsExporter {"kind": "exporter", "data_type": "metrics", "name": "logging", "resource metrics": 1, "metrics": 3, "data points": 3}
2023-08-30T01:49:34.751Z        info    ResourceMetrics #0
- metrics
Resource SchemaURL:
Resource attributes:-> telemetry.sdk.language: Str(python)-> telemetry.sdk.name: Str(opentelemetry)-> telemetry.sdk.version: Str(1.12.0)-> telemetry.auto.version: Str(0.33b0)-> service.name: Str(unknown_service)
ScopeMetrics #0
ScopeMetrics SchemaURL:
InstrumentationScope opentelemetry.instrumentation.flask 0.33b0
Metric #0
Descriptor:-> Name: http.server.active_requests-> Description: measures the number of concurrent HTTP requests that are currently in-flight-> Unit: requests-> DataType: Sum-> IsMonotonic: false-> AggregationTemporality: Cumulative
NumberDataPoints #0
Data point attributes:-> http.method: Str(GET)-> http.host: Str(127.0.0.1:5000)-> http.scheme: Str(http)-> http.flavor: Str(1.1)-> http.server_name: Str(127.0.0.1)
StartTimestamp: 2023-08-30 01:49:22.414117888 +0000 UTC
Timestamp: 2023-08-30 01:49:34.58335872 +0000 UTC
Value: 0
Metric #1
Descriptor:-> Name: http.server.duration-> Description: measures the duration of the inbound HTTP request-> Unit: ms-> DataType: Histogram-> AggregationTemporality: Cumulative
HistogramDataPoints #0
Data point attributes:-> http.method: Str(GET)-> http.host: Str(127.0.0.1:5000)-> http.scheme: Str(http)-> http.flavor: Str(1.1)-> http.server_name: Str(127.0.0.1)-> net.host.port: Int(5000)-> http.status_code: Int(200)
StartTimestamp: 2023-08-30 01:49:22.417513728 +0000 UTC
Timestamp: 2023-08-30 01:49:34.58335872 +0000 UTC
Count: 1
Sum: 3.000000
Min: 3.000000
Max: 3.000000
ExplicitBounds #0: 0.000000
ExplicitBounds #1: 5.000000
ExplicitBounds #2: 10.000000
ExplicitBounds #3: 25.000000
ExplicitBounds #4: 50.000000
ExplicitBounds #5: 75.000000
ExplicitBounds #6: 100.000000
ExplicitBounds #7: 250.000000
ExplicitBounds #8: 500.000000
ExplicitBounds #9: 1000.000000
Buckets #0, Count: 0
Buckets #1, Count: 1
Buckets #2, Count: 0
Buckets #3, Count: 0
Buckets #4, Count: 0
Buckets #5, Count: 0
Buckets #6, Count: 0
Buckets #7, Count: 0
Buckets #8, Count: 0
Buckets #9, Count: 0
Buckets #10, Count: 0
ScopeMetrics #1
ScopeMetrics SchemaURL:
InstrumentationScope app
Metric #0
Descriptor:-> Name: greeting_counter-> Description: The number of greeting times of each person-> Unit:-> DataType: Sum-> IsMonotonic: true-> AggregationTemporality: Cumulative
NumberDataPoints #0
Data point attributes:-> greeting.persion: Str(DaoCloud)
StartTimestamp: 2023-08-30 01:49:22.416660736 +0000 UTC
Timestamp: 2023-08-30 01:49:34.58335872 +0000 UTC
Value: 1{"kind": "exporter", "data_type": "metrics", "name": "logging"}
- Logs
Logs 的 SDK 以及相关组件还是开发状态,所以目前接入 app 以及对接 Collector 的过程并不像另外两类观测数据那样便捷。
编辑一下 otel-collector-config.yaml 文件。
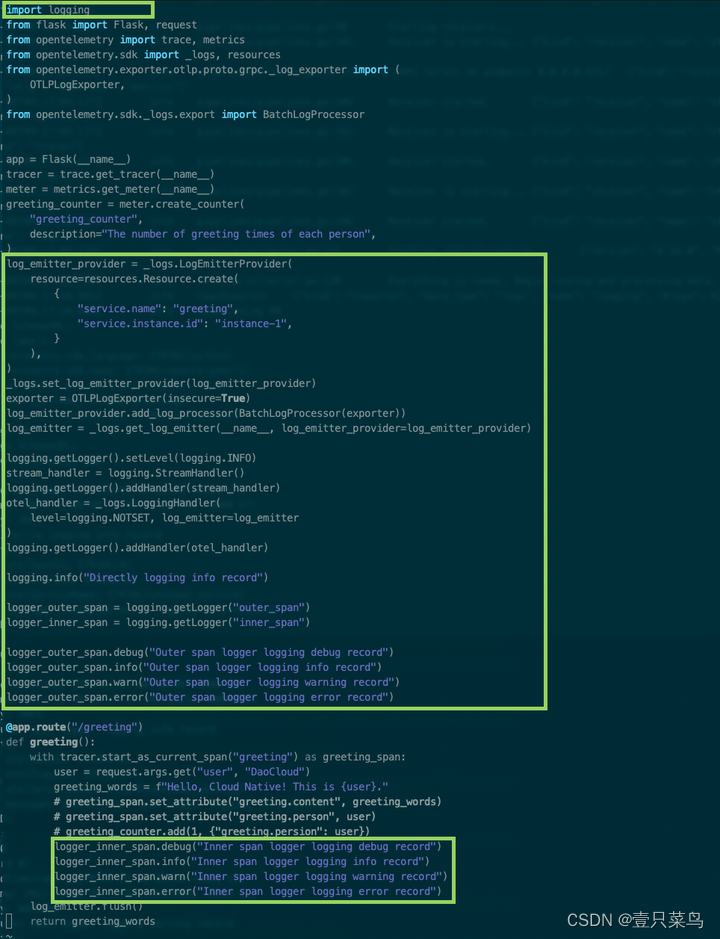
在上面的步骤中,依次创建了 log_emitter_provider、OTLP 协议的 exporter(这一步对 Collector 接受到应用程序输出的日志很重要)、log_emitter,并最终将用 log_emitter 创建出来的 LoggingHandler 实例加入到了 logging 的 handlers 中(注意在 Flask 应用中,需要将 Stream 类型的 handler 也加入到 logging handler,否则会影响 werkzeug 的信息输出)。
重新运行 Collector 容器和应用程序:
docker run -p 4317:4317 -v /opt/otel-demo/tmp/otel-collector-config.yaml:/etc/otel-collector-config.yaml otel/opentelemetry-collector:latest --config=/etc/otel-collector-config.yamlopentelemetry-instrument flask run
请求 /greeting 接口来看看 Collector 中的结果。
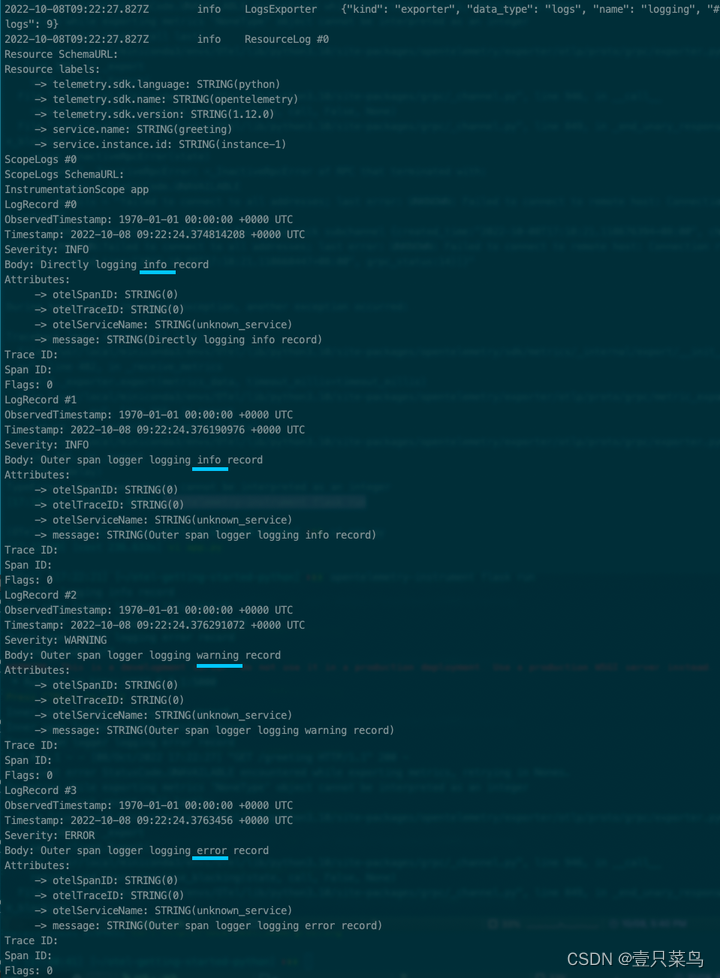
可以注意到 Collector 只收到了 INFO 及以上等级的日志消息,这是因为之前在 otel-collector-config.yaml 文件中设置了 loglevel=INFO。
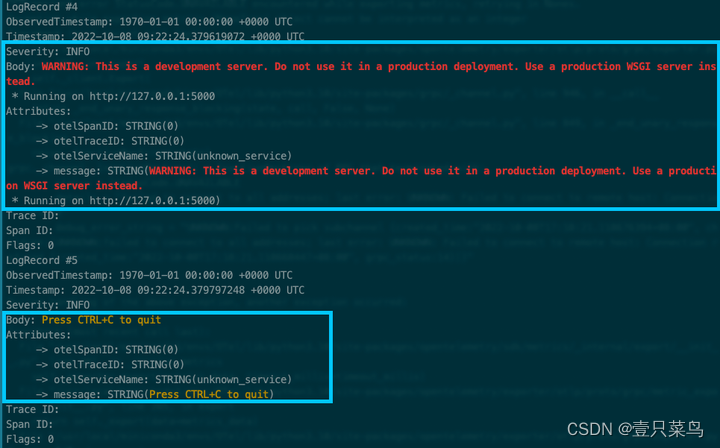
以 Flask 和 werkzeug 为例,其他库、框架或系统日志也会被发送到 Collector。
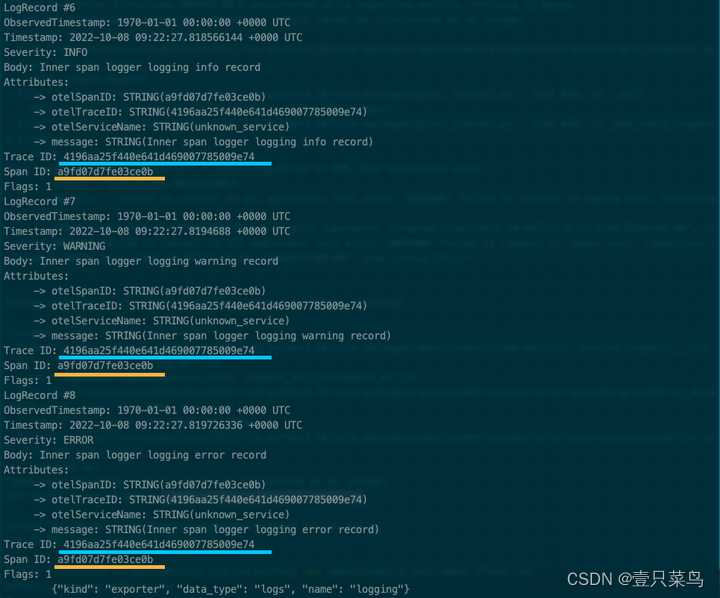
在 Span 上下文范围内记录的日志,经过 OTLP 协议的处理会带上 Trace ID 和 Span ID,使所有观测数据互相联结起来。
5. 部署 OpenTelemetry + Prometheus + Grafana
本次使用docker-compose快速部署
理论:通过OpenTelemetry-Collector收集trace和metrics数据,并将数据自动转为可观测型的格式提供给prometheus,最后由grafana进行展示
修改配置文件(1/5)
otel-collector-config.yaml
[root@node-138 tmp]# cat otel-collector-config.yaml
receivers:otlp:protocols:grpc:http:cors:allowed_origins:- http://*- https://*
exporters:logging:loglevel: debugprometheus:endpoint: "0.0.0.0:8889"const_labels:label1: value1
processors:batch:
service:pipelines:traces:receivers: [otlp]exporters: [logging]processors: [batch]metrics:receivers: [otlp]exporters: [prometheus]processors: [batch]logs:receivers: [otlp]exporters: [logging]
docker-compose.yaml
[root@node-138 tmp]# cat docker-compose.yaml
version: '3.3'services:otel-collector:image: otel/opentelemetry-collector:0.50.0command: ["--config=/etc/otel-collector-config.yaml"]volumes:- ./otel-collector-config.yaml:/etc/otel-collector-config.yamlports:- "1888:1888"   # pprof extension- "8888:8888"   # Prometheus metrics exposed by the collector- "8889:8889"   # Prometheus exporter metrics- "13133:13133" # health_check extension- "4317:4317"        # OTLP gRPC receiver- "4318:4318"        # OTLP http receiver- "55670:55679" # zpages extensionprometheus:container_name: prometheusimage: prom/prometheus:latestvolumes:- ./prometheus.yaml:/etc/prometheus/prometheus.ymlports:- "9090:9090"grafana:container_name: grafanaimage: grafana/grafanaports:- "3000:3000"
prometheus.yaml
[root@node-138 tmp]# cat prometheus.yaml
# my global config
global:scrape_interval: 15s # Set the scrape interval to every 15 seconds. Default is every 1 minute.evaluation_interval: 15s # Evaluate rules every 15 seconds. The default is every 1 minute.# scrape_timeout is set to the global default (10s).# Alertmanager configuration
alerting:alertmanagers:- static_configs:- targets:# - alertmanager:9093# Load rules once and periodically evaluate them according to the global 'evaluation_interval'.
rule_files:# - "first_rules.yml"# - "second_rules.yml"# A scrape configuration containing exactly one endpoint to scrape:
# Here it's Prometheus itself.
scrape_configs:# The job name is added as a label `job=<job_name>` to any timeseries scraped from this config.# metrics_path defaults to '/metrics'# scheme defaults to 'http'.- job_name: 'otel-collector'scrape_interval: 10sstatic_configs:- targets: ['192.168.17.138:8889']- targets: ['192.168.17.138:8888']
启动容器(2/5)
[root@node-138 tmp]# docker-compose up -d
[root@node-138 tmp]# docker ps
CONTAINER ID   IMAGE                                 COMMAND                  CREATED       STATUS       PORTS                                                                                                                                                       NAMES
417ec6e93078   otel/opentelemetry-collector:0.50.0   "/otelcol --config=/…"   2 hours ago   Up 2 hours   0.0.0.0:1888->1888/tcp, 0.0.0.0:4317-4318->4317-4318/tcp, 0.0.0.0:8888-8889->8888-8889/tcp, 0.0.0.0:13133->13133/tcp, 55678/tcp, 0.0.0.0:55670->55679/tcp   tmp_otel-collector_1
a2a8014cb136   grafana/grafana                       "/run.sh"                2 hours ago   Up 2 hours   0.0.0.0:3000->3000/tcp                                                                                                                                      grafana
1064669ca884   prom/prometheus:latest                "/bin/prometheus --c…"   2 hours ago   Up 2 hours   0.0.0.0:9090->9090/tcp                                                                                                                                      prometheus
启动业务服务(3/5)
还是使用上节的python flask程序,注意我们同样不需要指定参数,collector会为我们收集指标数据
[root@node-138 tmp]# cat ../app.py
#!/usr/bin/python envfrom flask import Flask,request
from opentelemetry import trace,metricsapp=Flask(__name__)
tracer=trace.get_tracer(__name__)
meter=metrics.get_meter(__name__)
greeting_counter=meter.create_counter("greeting_counter",description="The number of greeting times of each person",
)@app.route("/greeting")
def greeting():with tracer.start_as_current_span("greeting") as greeting_span:user = request.args.get("user", "DaoCloud")greeting_words = "hello, Cloud Native! This is %s."%usergreeting_span.set_attribute("greeting.content",greeting_words)greeting_span.set_attribute("greeting.person",user)greeting_counter.add(1, {"greeting.persion": user})return greeting_words
[root@node-138 tmp]# opentelemetry-instrument flask run
访问服务
curl http://localhost:5000/greeting  # 1
curl http://localhost:5000/greeting	 # 2
curl http://localhost:5000/greeting	 # 3
curl http://localhost:5000/greeting?user=sulun  # 4
查看数据Prometheus(4/5)
访问 prometheus网页 http://192.168.17.138:9090/
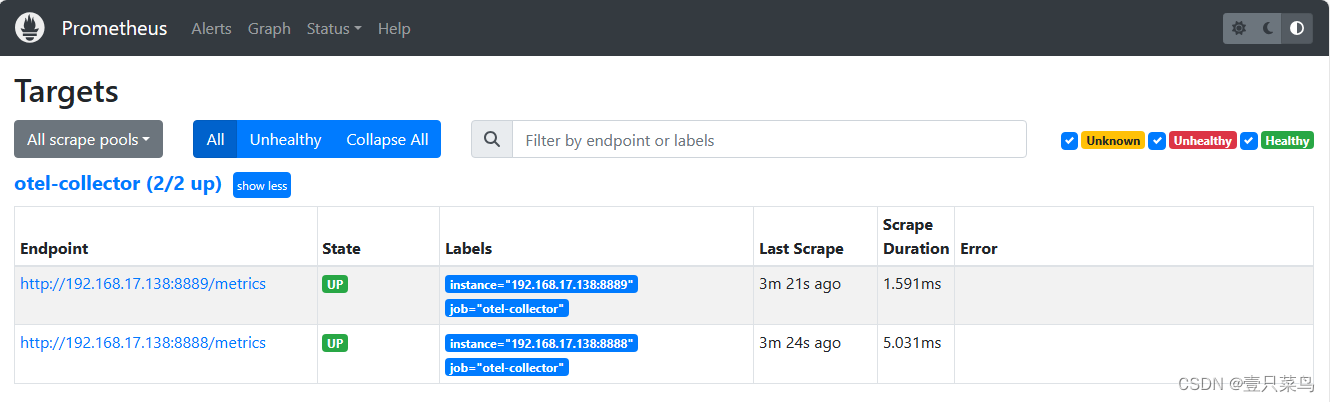 查看指标数据
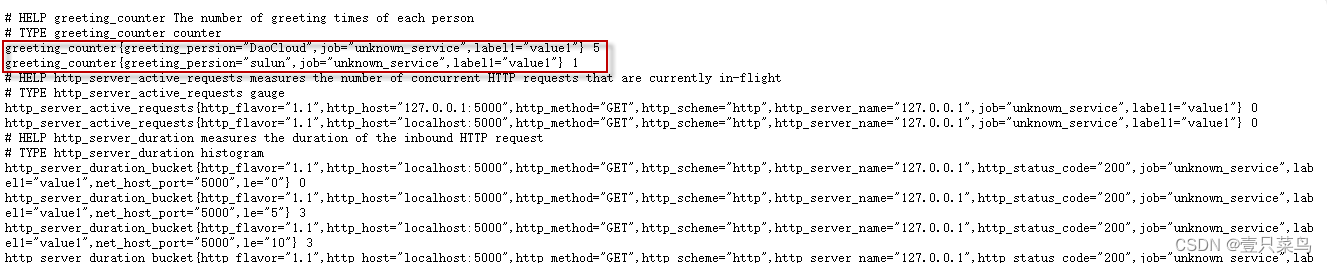 可以看到计数器的信息
查看grafana(5/5)
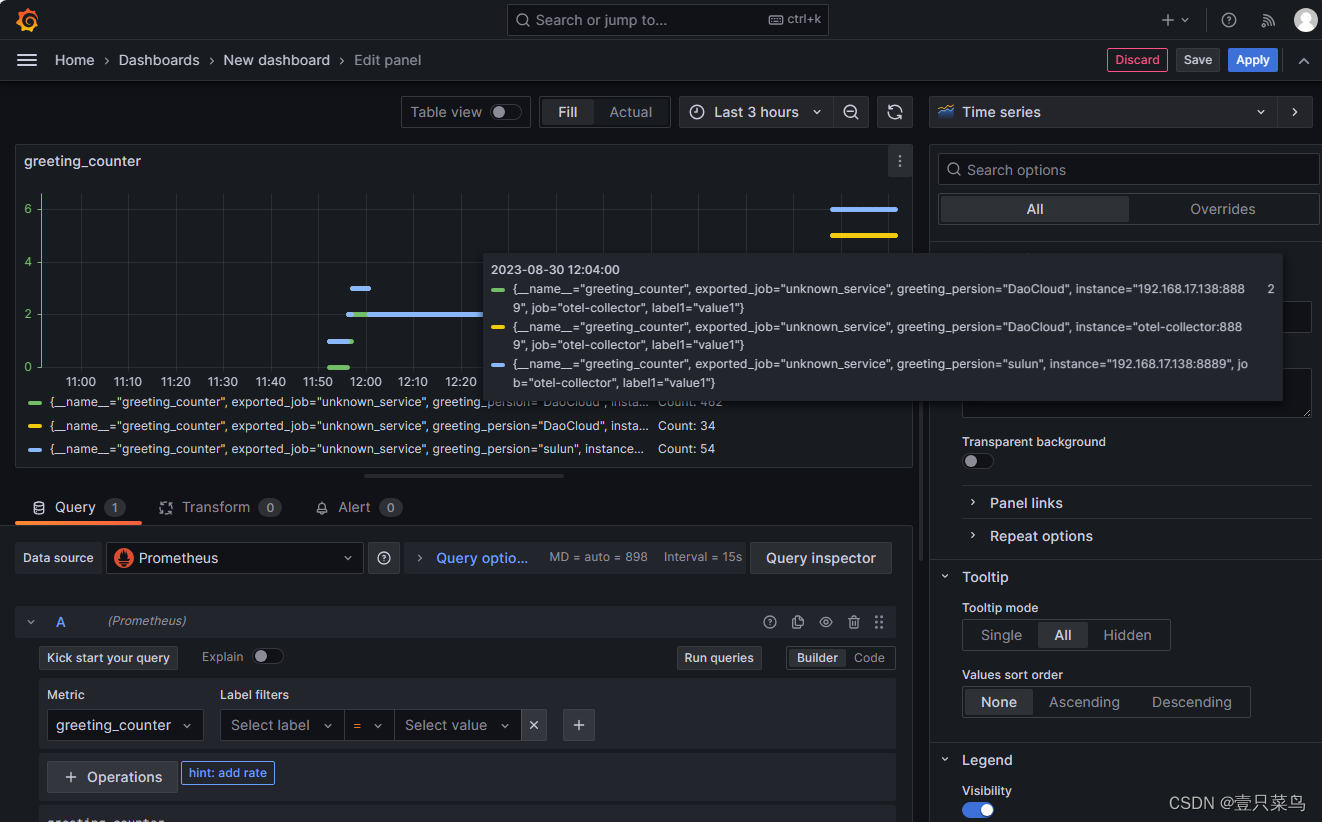
这篇关于企业主流全链路监控系统 - OpenTelemetry(二)的文章就介绍到这儿,希望我们推荐的文章对编程师们有所帮助!


