本文主要是介绍【白菜基础】蛋白组学之生信分析(1),希望对大家解决编程问题提供一定的参考价值,需要的开发者们随着小编来一起学习吧!
刚换了一个新课题组,新老板的研究方向为蛋白组学,从未接触过蛋白组学的我准备找一组模拟数据进行生信分析的入门学习。
蛋白组学数据挖掘流程图,参考公众号:蛋白质组学数据挖掘思路解析 (qq.com)
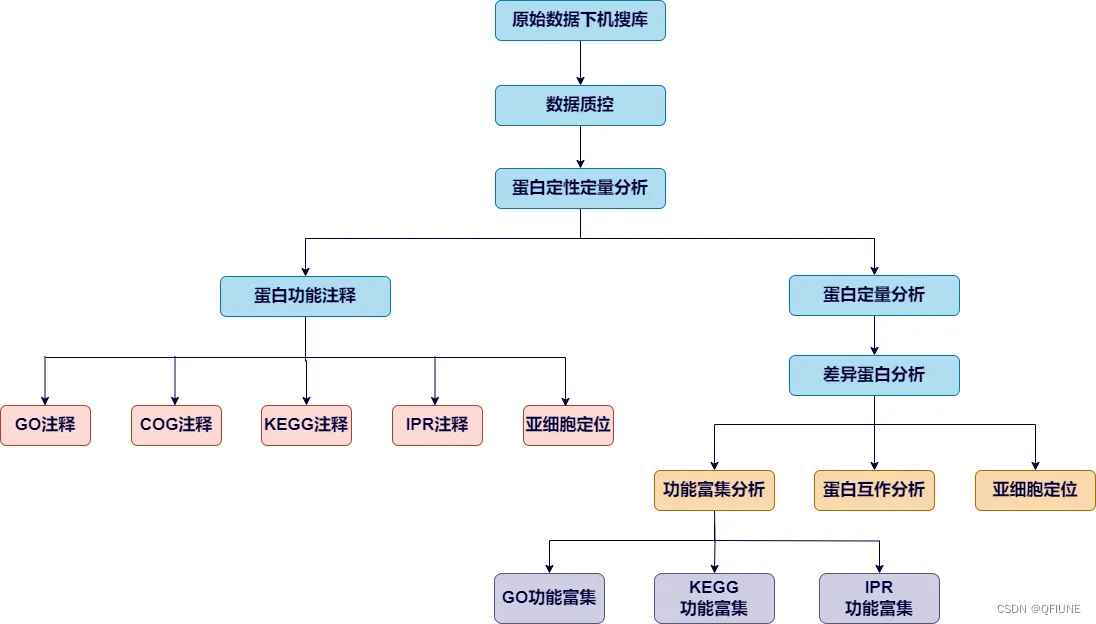
一、认识数据
我们组的数据主要是:MaxQuant搜库结果,我没有去实操一遍MaxQuant,所以这里引用网上资源蛋白质组学第6期 搜库软件之 MaxQuant 结果数据介绍-腾讯云开发者社区-腾讯云 (tencent.com)作为介绍吧!蛋白质鉴定和定量的全部结果都位于 ‘conbined/txt/’ 目录下。
MaxQuant是一种用于质谱数据分析的软件,通常用于蛋白质组学研究。通过MaxQuant分析获得的结果包含大量的生物信息学数据,例如蛋白质定量、修饰、蛋白质组成等。
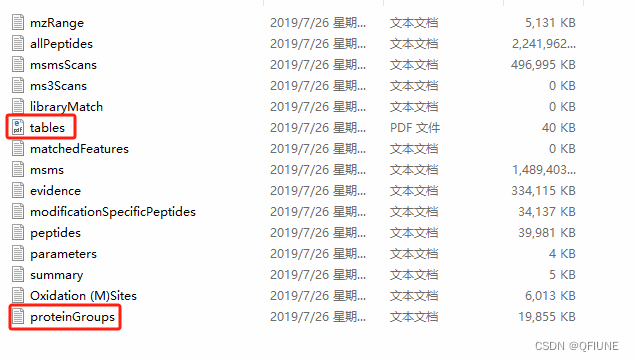
其中‘msms.txt’;‘peptides.txt’;‘proteinGroups.txt’ 分别为谱图、肽段和蛋白结果文件。另外 ‘summary.txt’ 文件记录了所有原始数据文件的总体信息;‘evidence.txt’ 文件记录了已鉴定肽段的所有信息。每个文件的表头信息需要查阅结果中 ‘tables.pdf’ 文件,所有文件都有详细解释。文件夹里有一个 'proteinGroup' 表格文件,就是我们的目标文件。用pandas.read_csv()打开文件:
file_in = 'C:/Users/KerryChen/Desktop/proteinGroups.txt'
df = pd.read_csv(file_in, sep='\t')# 查看列名
print(df.columns.tolist())
数据列名如下:

在这些列名中有很多信息,包括蛋白质标识、肽段计数、蛋白质名称、基因名称、序列长度、肽段序列等等。因此,需要确定感兴趣的分析目标,然后选择适当的列进行分析。
以下是一些可能的分析方向:
1.1 蛋白质鉴定和定量
- 分析 'Protein IDs' 列,了解鉴定到的蛋白质。
- 分析 'Peptide counts (all)' 或 'Peptide counts (unique)' 列,了解每个蛋白质的肽段计数情况。
- 分析 'Intensity' 列,了解蛋白质的丰度或表达水平。
1.2 蛋白质特性分析
- 分析 'Mol. weight [kDa]' 和 'Sequence length' 列,了解蛋白质的分子量和序列长度分布情况。
- 分析 'Sequence coverage [%]' 列,了解蛋白质的序列覆盖度。
1.3 差异表达分析
- 如果你有不同条件或组别的数据,可以进行差异表达分析。例如,比较两组样本之间的蛋白质丰度是否存在差异。
- 分析'Ratio M/L'、'Ratio H/L'等列,了解蛋白质在不同样本或条件下的定量比值。
1.4 蛋白质注释和功能分析
- 分析'Protein names'、'Gene names'等列,了解蛋白质的注释信息。
- 结合生物信息学数据库,如UniProt,对蛋白质进行聚类分析、差异表达分析、功能富集分析。
1.5 修饰位点分析
- MaxQuant可以识别蛋白质的多种修饰,如磷酸化、甲基化等。可以进一步使用生物信息学工具(如PhosphoSitePlus、PhosphoPep等)进行修饰位点的富集分析、修饰位点的保守性分析等。
1.6 通路和网络分析
- 使用生物信息学数据库(如KEGG、Reactome等)对蛋白质组数据进行通路分析,了解蛋白质在细胞通路中的功能和相互作用。
- 可以使用生物信息学软件(如Cytoscape)构建蛋白质相互作用网络,并进行网络拓扑分析、模块发现等。
二、预处理数据
表格数据中会出现一个 gene names 和 protein id 一对多,多对多的情况,因此需要构建一个字典确定哪些gene name 对应哪些 protein id,然后根据gene name 把数据分行。表格数据中有一列为 'Fasta Header',乍一看发现里面记录着每行数据的基因名和蛋白ID的对应关系,仔细一看,嘿,发现信息不全,我们要根据提供fasta文件建立对应关系。
2.1 构建gene_mapping_protein字典

fasta文件数据:

目的:获取两个竖线之间的 'Protein ID' 和 'GN=XXX' ,使用正则表达式获取,保存成字典
# 定义正则表达式模式
pattern1 = r'\|(.*?)\|'     # 匹配竖线之间的内容
pattern2 = r'GN=([^ ]+)'    # 匹配以"GN="开头的内容#### 读取fasta文件
fasta_file = 'C:/Users/KerryChen/Desktop/LFM-Project/gene_mapping_protein.fasta'gene_mapping_protein = {}
with open(fasta_file, 'r') as info:lines = info.readlines()for line in lines:if line.startswith('>'):new_line = line.strip()# 提取竖线之间的内容protein_id = re.findall(pattern1, new_line)[0]# 提取以'GN='开头的内容gene_name = re.search(pattern2, new_line)if gene_name:gene_mapping_protein.setdefault(gene_name.group(1), []).append(protein_id)else:gene_mapping_protein.setdefault('empty_gene_name', []).append(protein_id)# 要保存的 JSON 文件路径
json_file_path = 'C:/Users/KerryChen/Desktop/LFM-Project/gene_mapping_protein.json'# 将字典保存到 JSON 文件中
with open(json_file_path, 'w') as json_file:json.dump(gene_mapping_protein, json_file, indent=4)
print('已经保存完啦,请开始下一步操作')
2.2 计算 Log2 Fold Change值
重标的列值除以轻标的列值,并保存到最后一列
# 计算Fold Change,插入最后一列
filtered_df['Log2 Fold Change'] = np.log2(filtered_df[intensity_hight] / filtered_df[intensity_light])
2.3 根据gene name 展开数据
'Gene Mapping Protein' 列是一个字典,根据键把数据展开成行,键成为一列,值为一列,其余的值复制。
展开前:

先根据gene_mapping_protein字典把gene name 和Protein ID 对应起来
data_file = "C:/Users/KerryChen/Desktop/LFM-Project/all_group_gene_mapping_protein_fold.csv"
df = pd.read_csv(data_file)gene_protein = []
for genes, proteins in zip(df['Gene names'], df['Majority protein IDs']):
#     print(genes,'------' ,proteins)gene_names = genes.split(';') if isinstance(genes, str) else []protein_names = proteins.split(';') if isinstance(proteins, str) else []# 初始化一个空字典,用于存储当前行的 protein_idsub_dict = {}# 遍历当前行的每个 gene_namefor gene_name in gene_names:# 在 gene_mapping_protein 字典中查找对应的 protein_idif gene_name in gene_mapping_protein.keys():intersection = list(set(gene_mapping_protein[gene_name]) & set(proteins.split(';')))sub_dict.setdefault(gene_name, intersection)else:if gene_name == '':sub_dict.setdefault('empty_gene_name', protein_names)else:sub_dict.setdefault(gene_name, '')# 将当前行的 sub_dict 添加到结果列表中gene_protein.append(sub_dict)df['Gene Mapping Protein'] = gene_protein
save_dir = 'C:/Users/KerryChen/Desktop/LFM-Project/'
create_folder(save_dir)
df.to_csv(save_dir + "all_group_gene_mapping_protein_fold_dict.csv", index=False)
展开后:

展开数据的代码实现
import pandas as pd
import ast# 定义一个空列表,用于存储每个拆分后的行
split_rows = []# 遍历 DataFrame 中的每一行
for index, row in df.iterrows():gene_mapping_protein_dict = row['Gene Mapping Protein']  # 获取当前行的字典数据# 遍历字典中的键值对,并将每个键值对拆分成一个新的行for key, value in gene_mapping_protein_dict.items():if key == 'empty_gene_name':key = ''split_rows.append([row['Protein IDs'], row['Majority protein IDs'], row['Protein names'],row['Gene names'], row['Mol. weight [kDa]'], row['Intensity'], row['Intensity L'], row['Intensity M'], row['Intensity H'],row['Log2 Fold Change'], row['Group'], key, ';'.join(value)])columns_name = ['Protein IDs', 'Majority protein IDs', 'Protein names','Gene names', 'Mol. weight [kDa]', 'Intensity', 'Intensity L','Intensity M', 'Intensity H', 'Log2 Fold Change', 'Group', 'Every Gene Name', 'Mapping Protein Names']# 创建新的 DataFrame,将拆分后的行数据填充进去
new_df = pd.DataFrame(split_rows, columns=columns_name)save_dir = 'C:/Users/KerryChen/Desktop/LFM-Project/'
create_folder(save_dir)
new_df.to_csv(save_dir + "all_group_gene_mapping_protein_unfold.csv", index=False)
2.3 展示数据
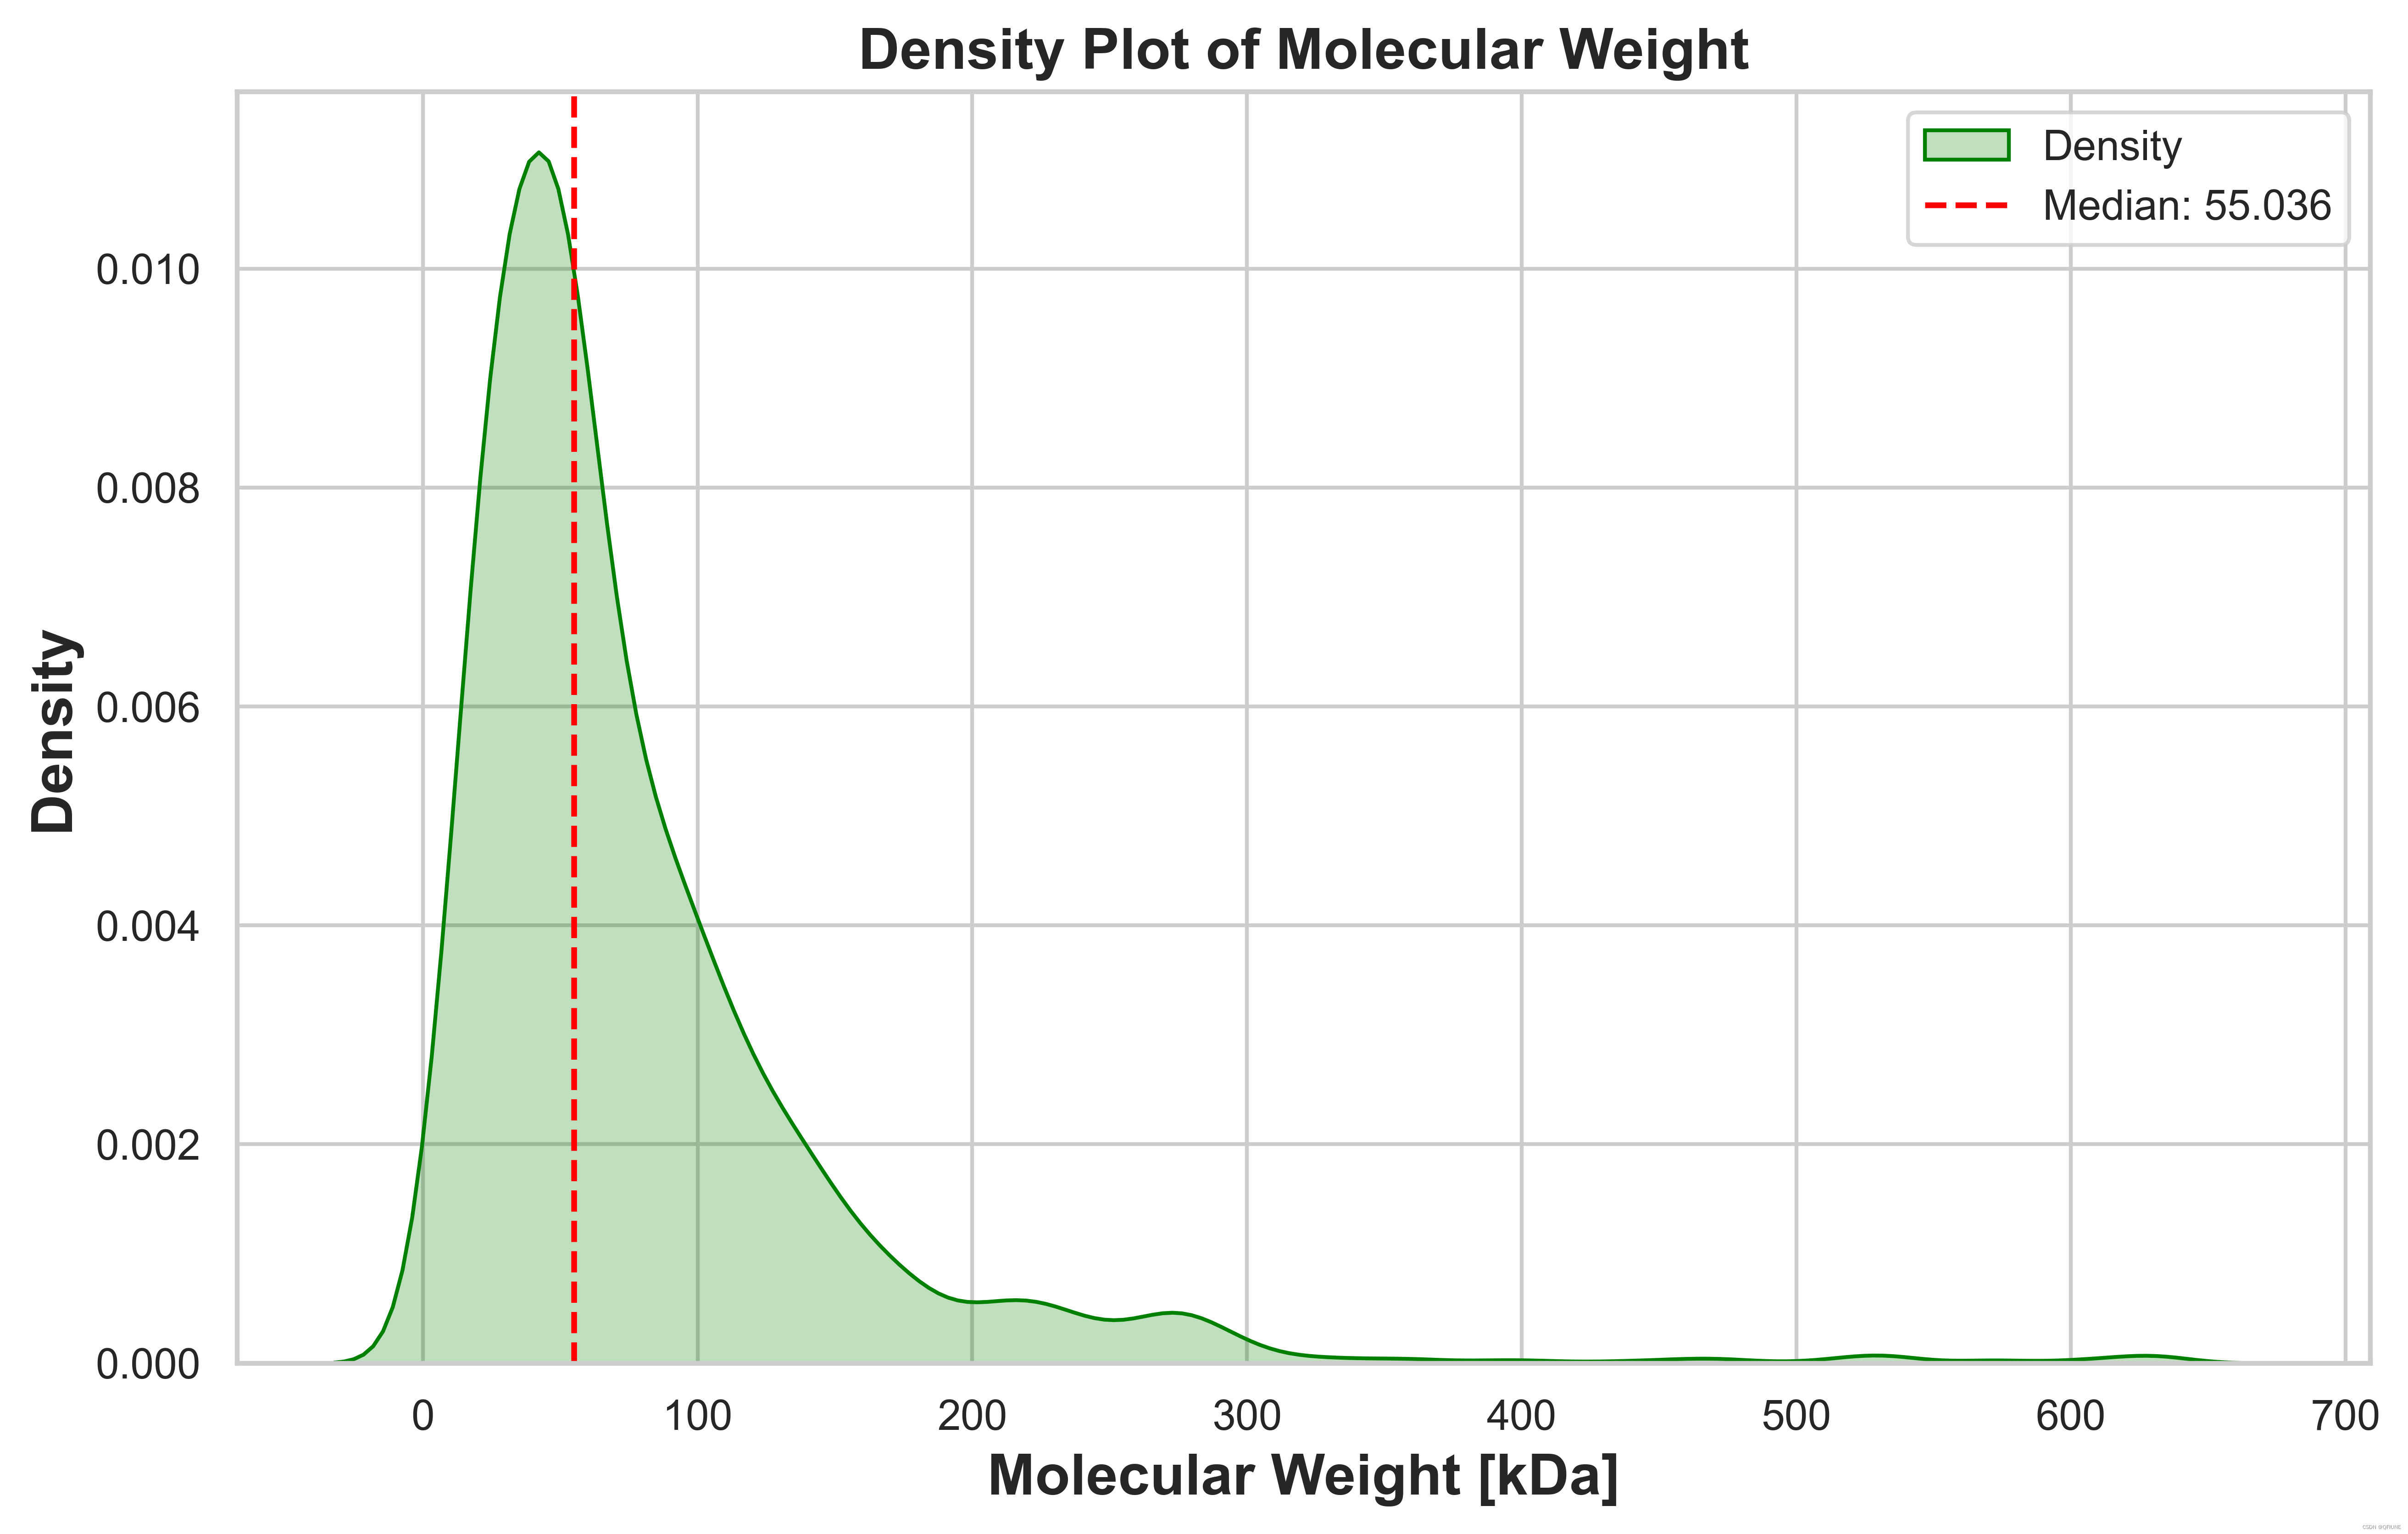
(1)绘制 'Molecular Weight [kDa]' 列的密度图
import seaborn as sns
import matplotlib.pyplot as plt
import matplotlib as mpl# 设置全局字体样式
mpl.rcParams['font.family'] = 'Times New Roman'# 提取 'Mol. weight [kDa]' 列的数据
mol_weight = new_df['Mol. weight [kDa]']
print('最大值为 %d; 最小值为 %d; 平均值为 %d' %(mol_weight.max(), mol_weight.min(),mol_weight.mean()))# 计算中位值
median_value = mol_weight.median()# 使用Seaborn绘制密度图
sns.set(style="whitegrid")
plt.figure(figsize=(10, 6),dpi=600)
sns.kdeplot(mol_weight, shade=True, color='green', label='Density')  # 修改颜色为绿色# 在图中添加中位值的竖直线
plt.axvline(median_value, color='red', linestyle='--', label=f'Median: {median_value}')
plt.title('Density Plot of Molecular Weight', fontsize=15, fontweight='bold')
plt.xlabel('Molecular Weight [kDa]', fontsize=15, fontweight='bold')
plt.ylabel('Density', fontsize=15, fontweight='bold')# 添加图例
plt.legend()save_dir = 'C:/Users/KerryChen/Desktop/LFM-Project/'
plt.savefig(save_dir + 'density.png', dpi=600, bbox_inches='tight')  # 保存为 png 格式,dpi 设置分辨率,bbox_inches='tight' 自动裁剪边缘plt.show()
结果展示:
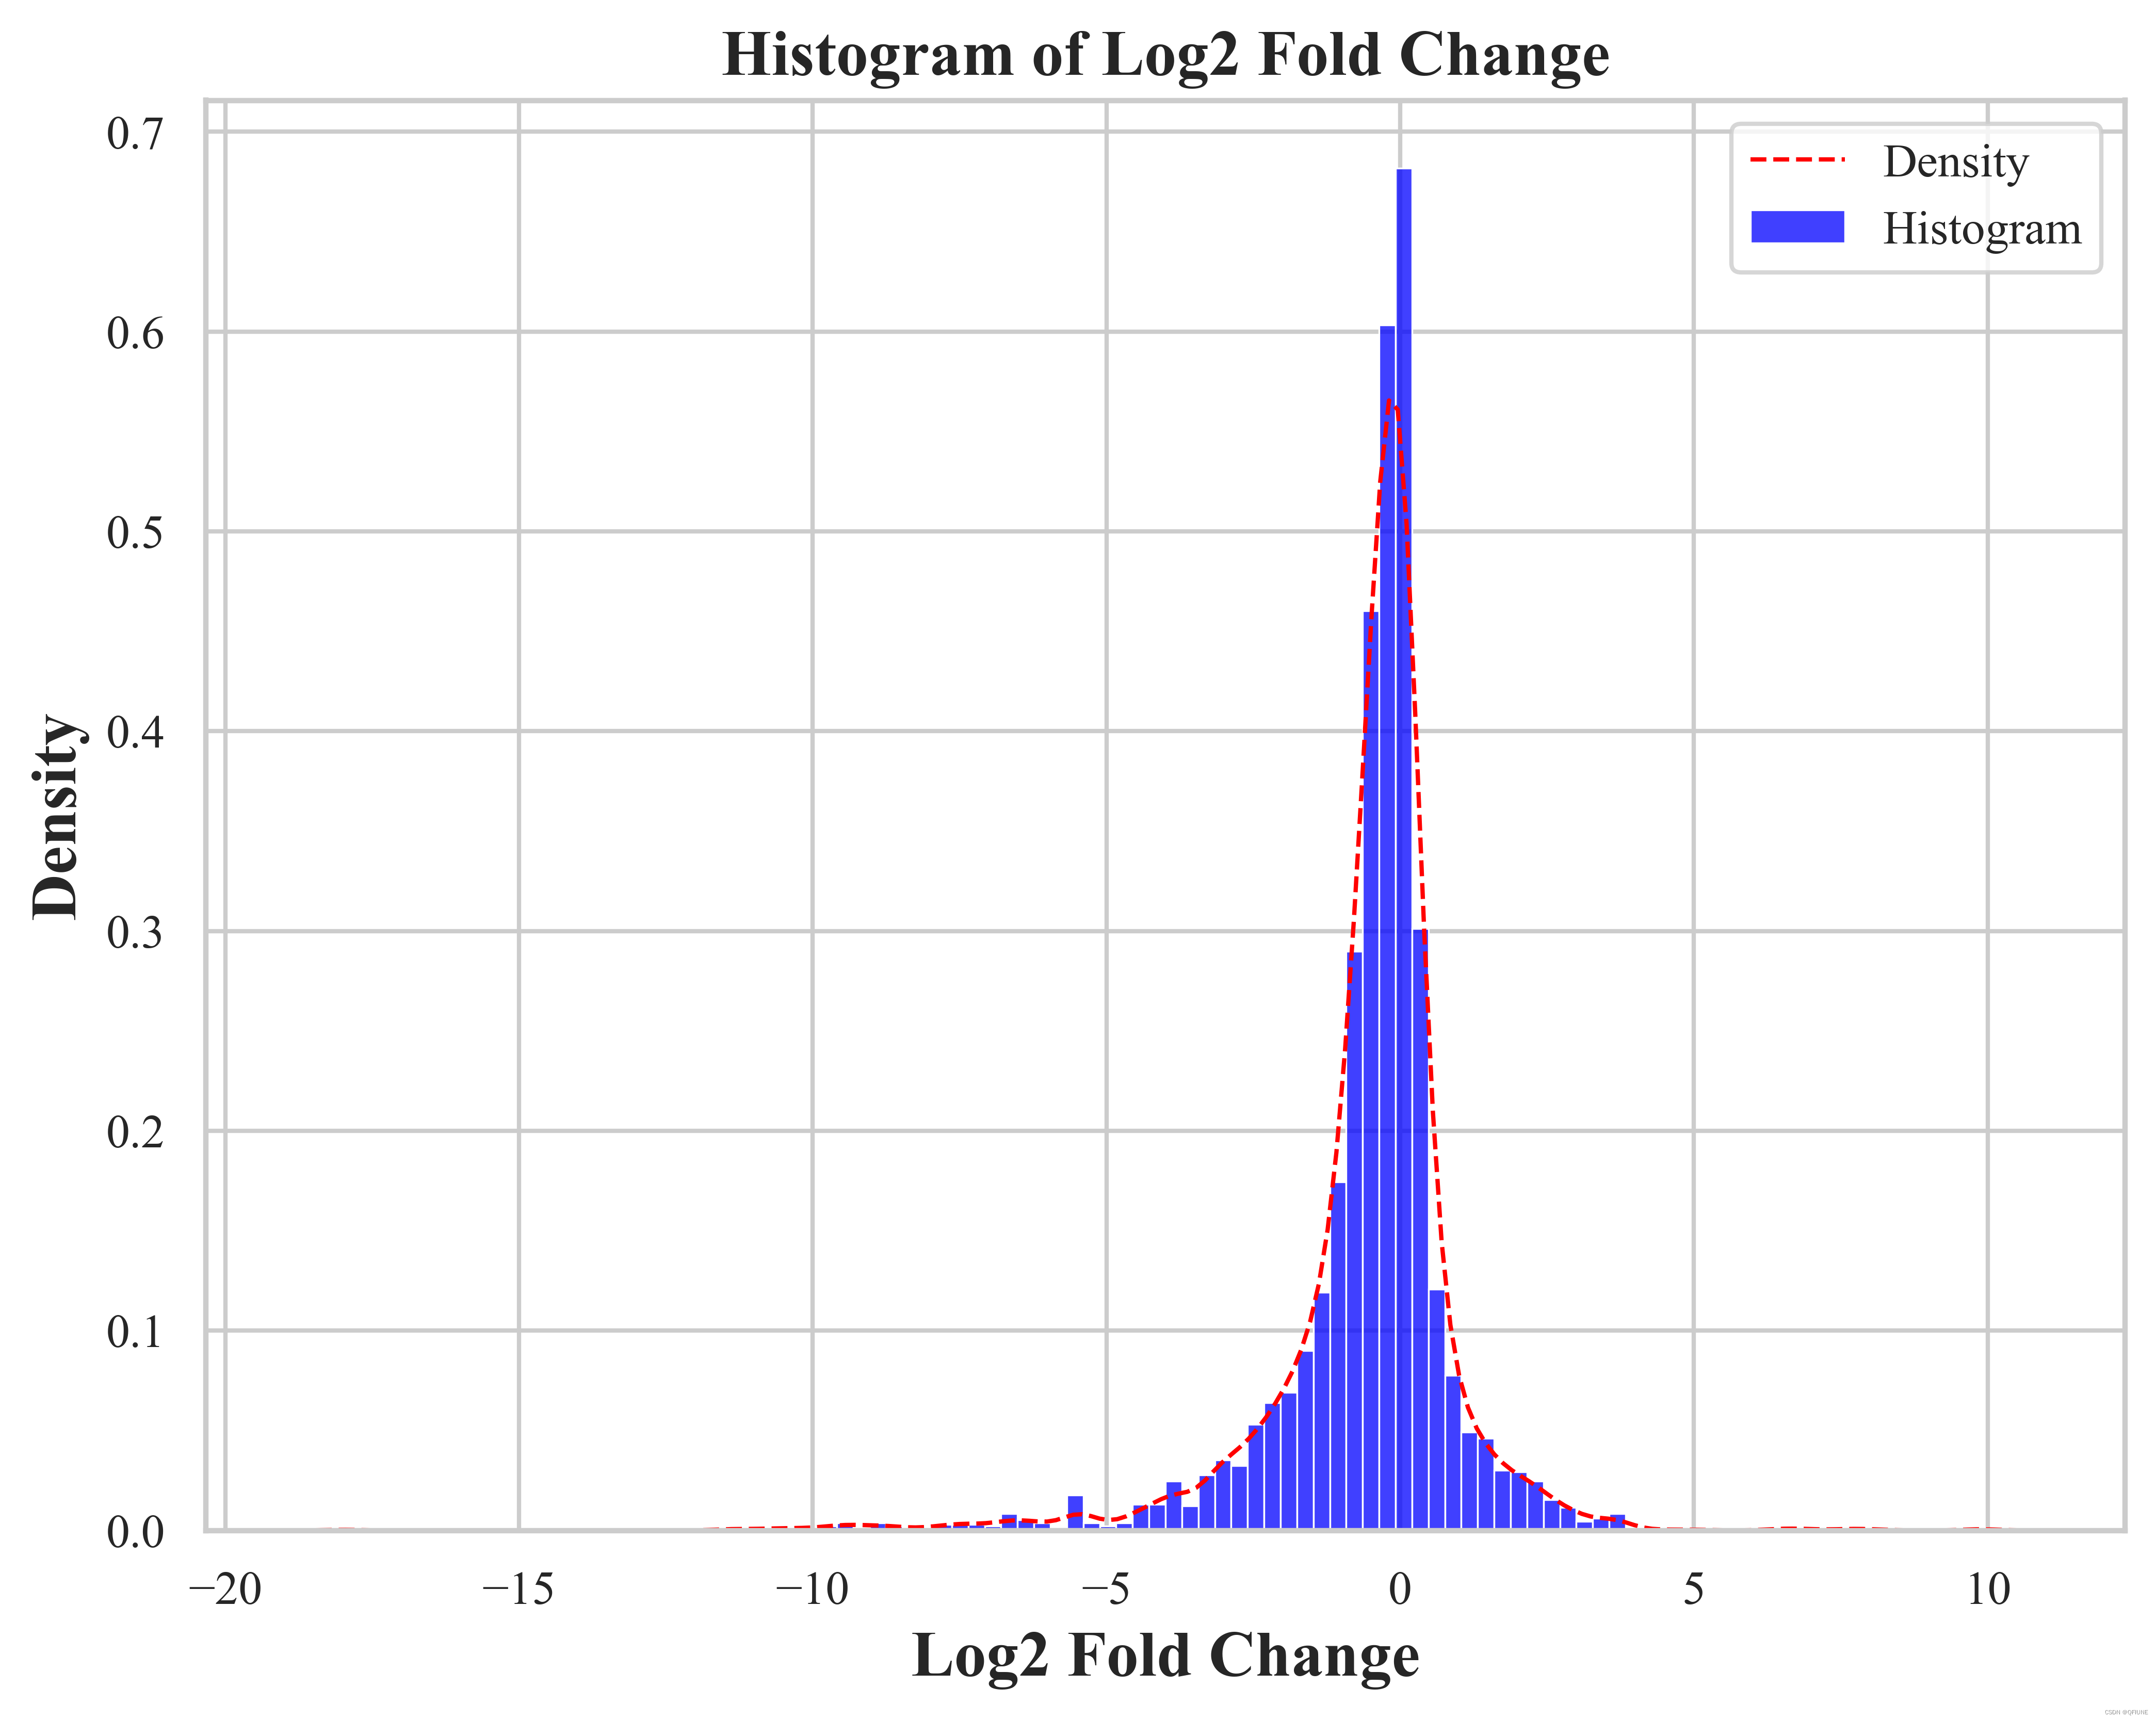
(2)绘制 'Log2 Fold Change' 列的柱状图和密度图
import pandas as pd
import matplotlib.pyplot as plt
import matplotlib as mpl# 设置全局字体样式
mpl.rcParams['font.family'] = 'Times New Roman'# 绘制直方图
plt.figure(figsize=(8, 6),dpi=600)
sns.histplot(new_df['Log2 Fold Change'], color='blue', kde=False, bins=100, stat='density', label = 'Histogram')  # 使用 seaborn 库的 histplot() 函数绘制直方图,并添加分布曲线
sns.kdeplot(new_df['Log2 Fold Change'], linestyle='--', color='red', linewidth=1, label = 'Density') # 添加标题和标签
plt.title('Histogram of Log2 Fold Change', fontsize=15, fontweight='bold')
plt.xlabel('Log2 Fold Change', fontsize=15, fontweight='bold')
plt.ylabel('Density', fontsize=15, fontweight='bold')
# 显示图例
plt.legend()# 保存图像
save_dir = 'C:/Users/KerryChen/Desktop/LFM-Project/'
plt.savefig(save_dir + 'histogram.png', dpi=600, bbox_inches='tight')  # 保存为 png 格式,dpi 设置分辨率,bbox_inches='tight' 自动裁剪边缘# 显示图形
plt.show()
结果展示:
(3)统计上下调的基因【log2 fold change < -1 & log2 fold change > 1】
data_file = 'C:/Users/KerryChen/Desktop/LFM-Project/' + 'Isoform_all_group_gene_mapping_protein_unfold_CQF.xlsx'
# data_file = 'C:/Users/KerryChen/Desktop/LFM-Project/' + 'all_group_gene_mapping_protein_fold_dict.csv'
df = pd.read_excel(data_file)all_genes = df['Every Gene Name'].unique().tolist()
print('展开之后总的基因有: %d 个'%(len(all_genes)))# 筛选 log2 fold_change 列绝对值大于 1的行
log_fold_change = df['Log2 Fold Change'].abs()# 使用布尔索引选择绝对值大于1的行
filtered_df = df[log_fold_change > 1]up_down_genes = filtered_df['Every Gene Name'].unique().tolist()
print("去除空值和重复值后还剩 %d 个上下调基因" %len(up_down_genes))# 筛选不显著的行
no_significant_df = df[(df['Log2 Fold Change'] >= -1) & (df['Log2 Fold Change'] <= 1)]no_significant_genes = no_significant_df['Every Gene Name'].unique().tolist()
print("不显著的基因个数有: ", len(no_significant_genes))unsignificant_df = pd.DataFrame(columns=['Genes'], data=no_significant_genes)
unsignificant_df.to_csv('C:/Users/KerryChen/Desktop/LFM-Project/unsignificant_genes.csv', encoding='utf-8', index=False)
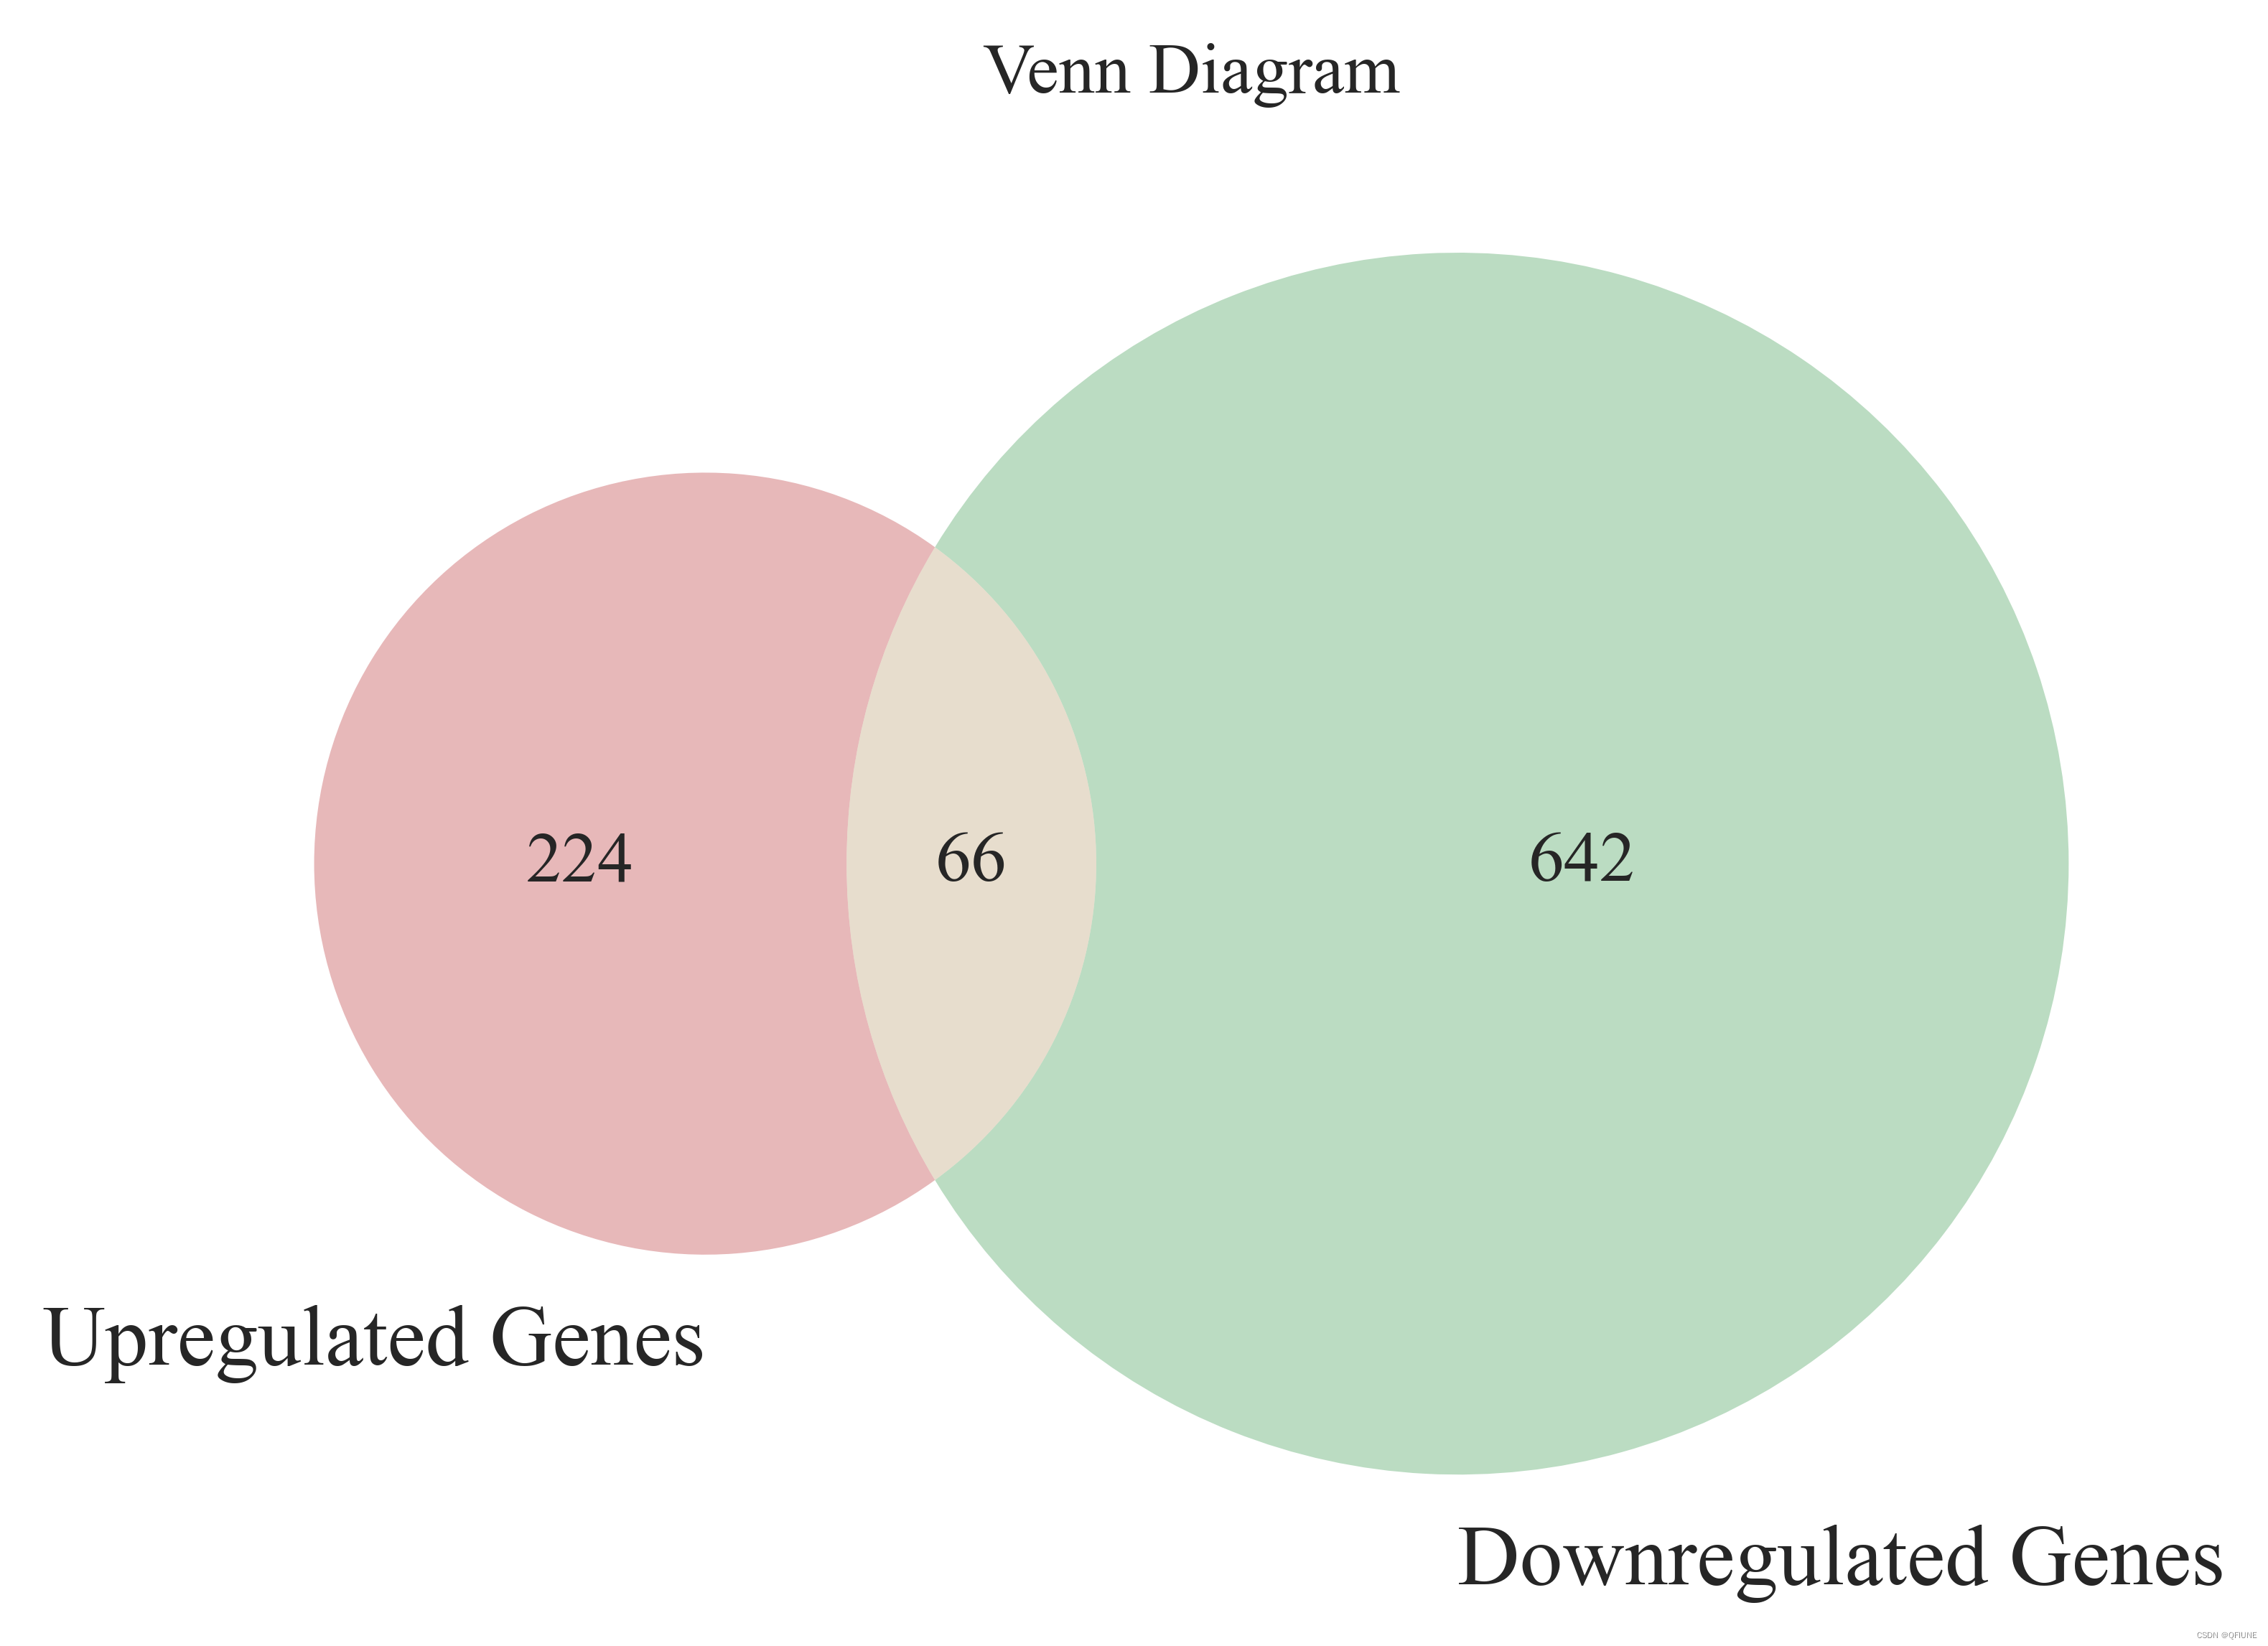
(4)绘制两组List的韦恩图
import matplotlib.pyplot as plt
from matplotlib_venn import venn2# 绘制韦恩图
plt.figure(figsize=(6, 6), dpi=600)
venn2([set(up_genes), set(down_genes)], ('Upregulated Genes', 'Downregulated Genes'))# 添加标题
plt.title('Venn Diagram')# 保存图像
save_dir = 'C:/Users/KerryChen/Desktop/LFM-Project/'
plt.savefig(save_dir + 'up_down_venn.png', dpi=600, bbox_inches='tight')  # 保存为 png 格式,dpi 设置分辨率,bbox_inches='tight' 自动裁剪边缘# 显示图形
plt.show()
结果展示:
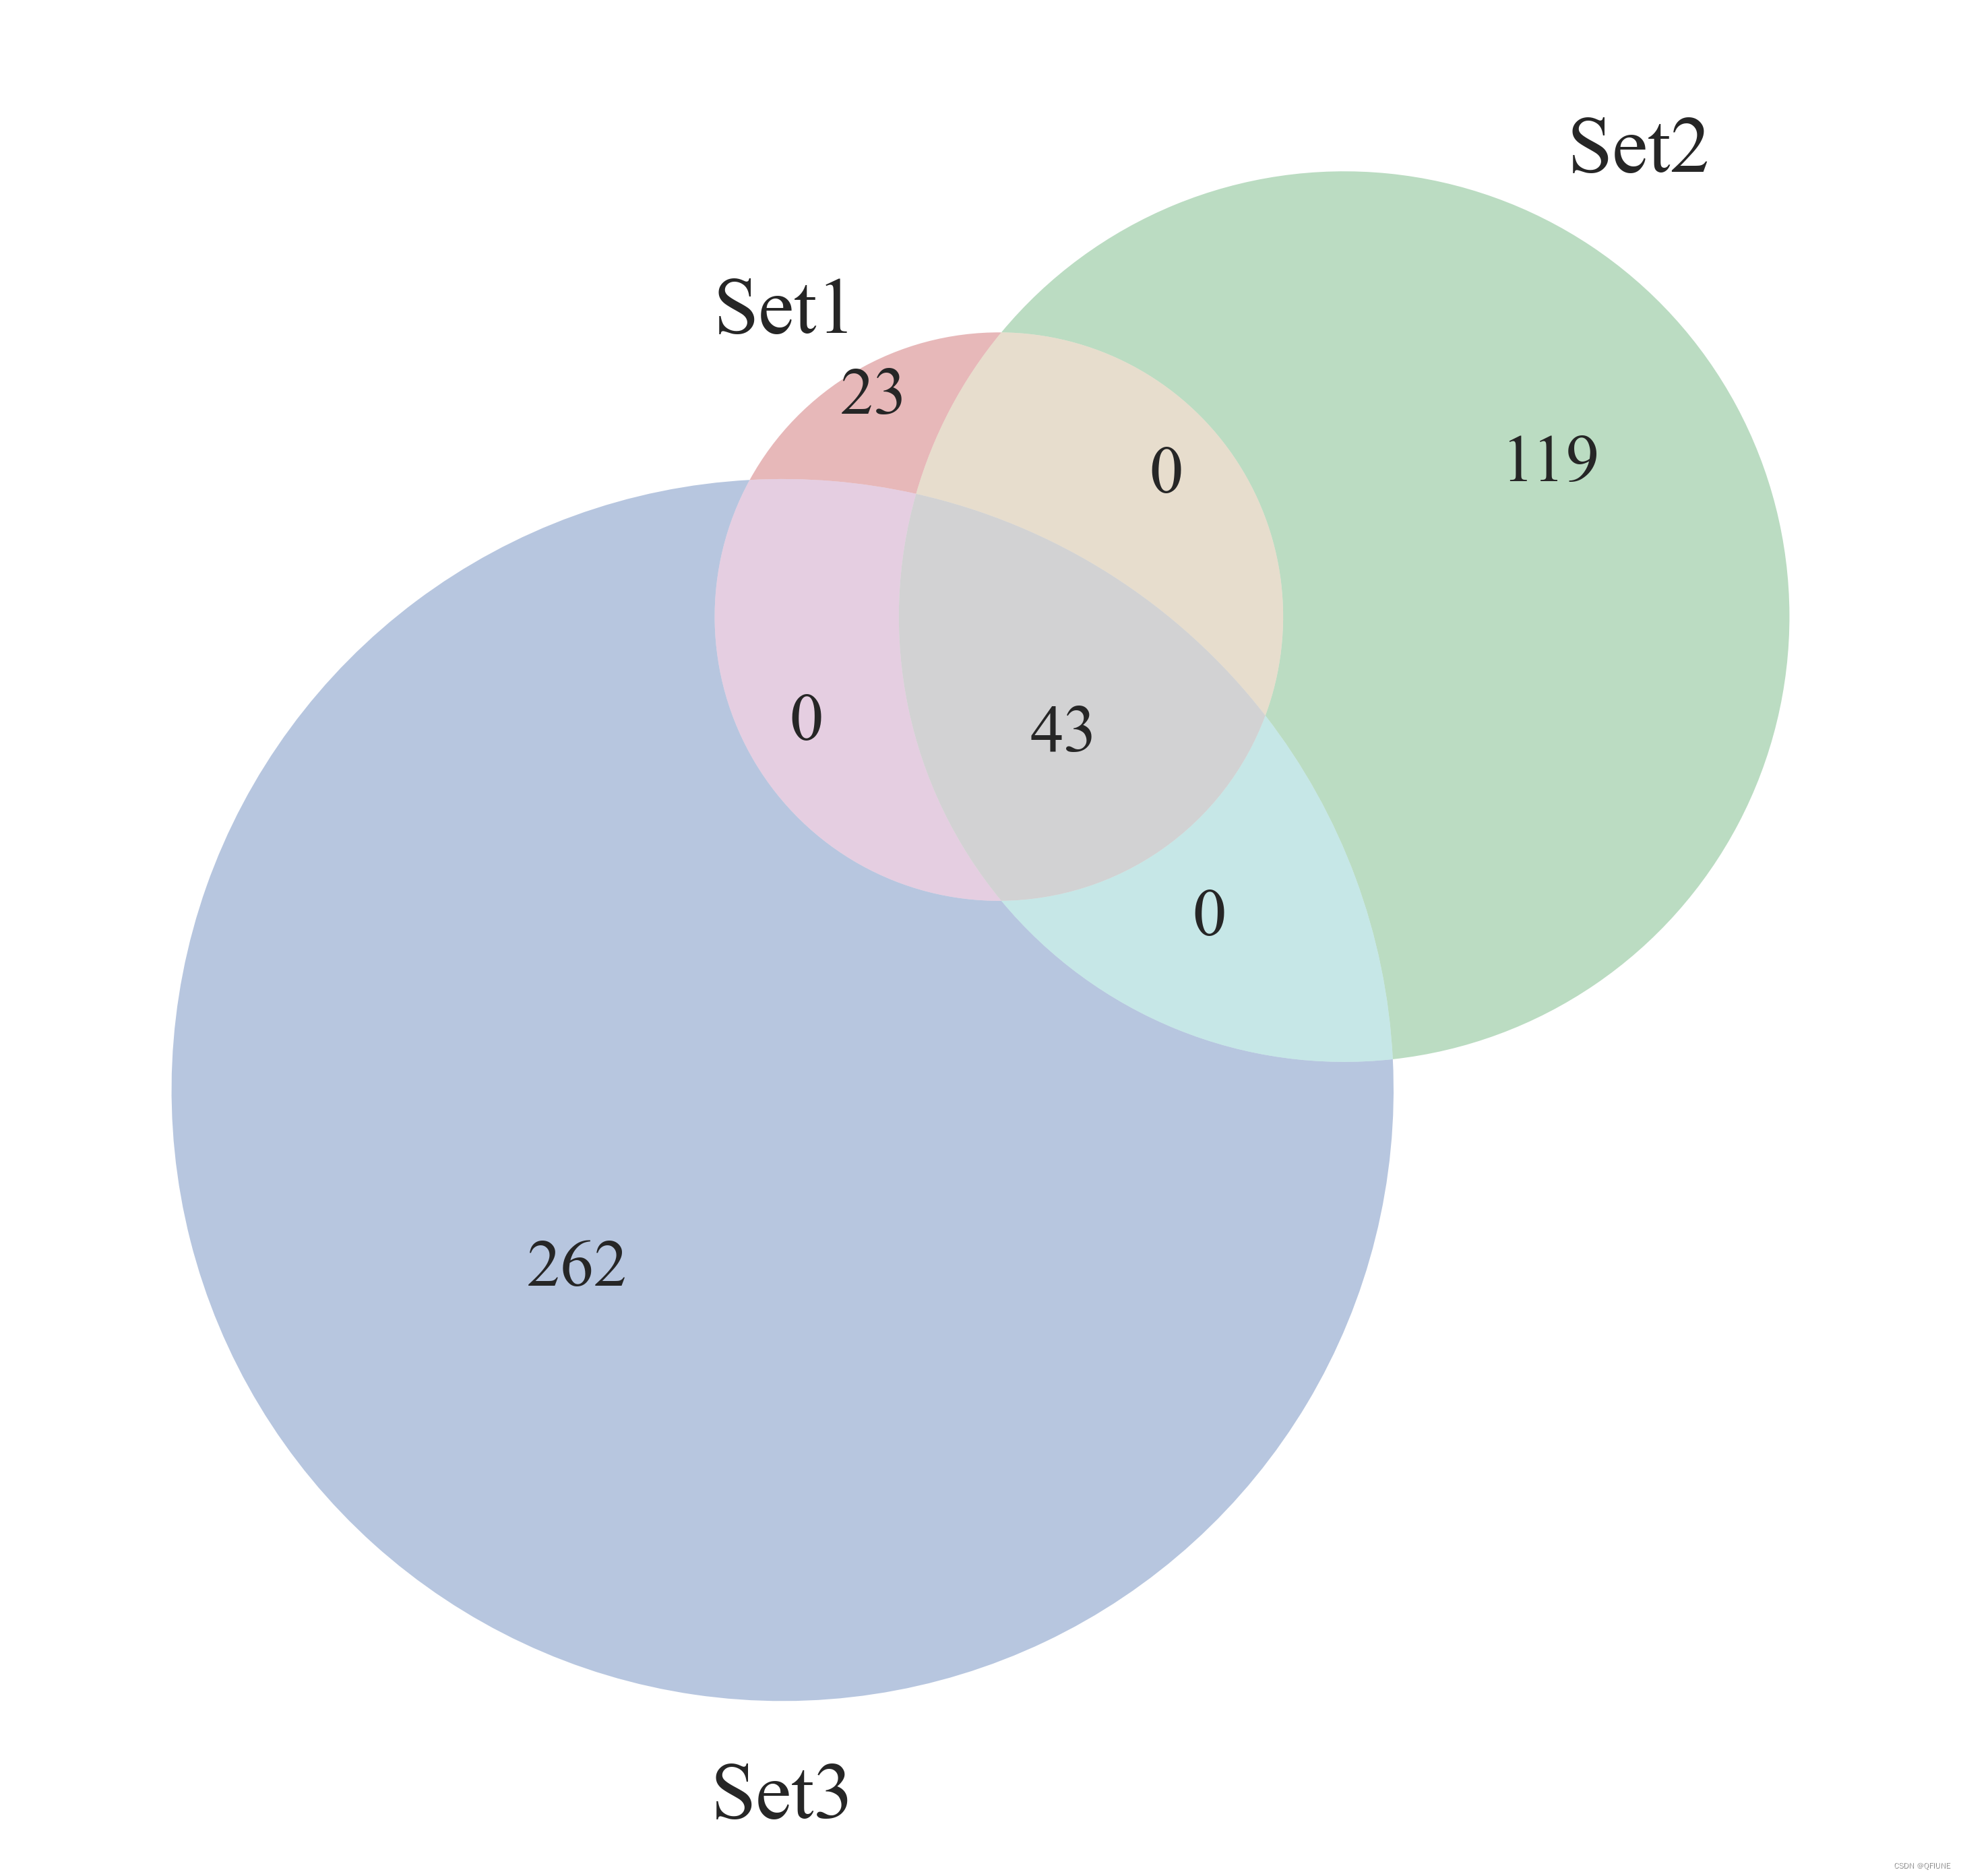
(5)绘制三组List的韦恩图
from matplotlib import pyplot as plt
from matplotlib_venn import venn3plt.figure(figsize=(6, 6), dpi=600)# 绘制韦恩图
venn = venn3([set(set1), set(set2), set(set3)], ('set1', 'set2', 'set3'))# # 可选:添加标签
# venn.get_label_by_id('100').set_text('\n'.join(map(str, set1 - set2 - set3)))
# venn.get_label_by_id('010').set_text('\n'.join(map(str, set2 - set1 - set3)))
# venn.get_label_by_id('001').set_text('\n'.join(map(str, set3 - set1 - set2)))
# venn.get_label_by_id('110').set_text('\n'.join(map(str, set1 & set2 - set3)))
# venn.get_label_by_id('101').set_text('\n'.join(map(str, set1 & set3 - set2)))
# venn.get_label_by_id('011').set_text('\n'.join(map(str, set2 & set3 - set1)))
# venn.get_label_by_id('111').set_text('\n'.join(map(str, set1 & set2 & set3)))# 保存图像
save_dir = 'C:/Users/KerryChen/Desktop/LFM-Project/'
plt.savefig(save_dir + 'three_group_venn.png', dpi=600, bbox_inches='tight')  # 保存为 png 格式,dpi 设置分辨率,bbox_inches='tight' 自动裁剪边缘# 显示图形
plt.show()
结果展示:
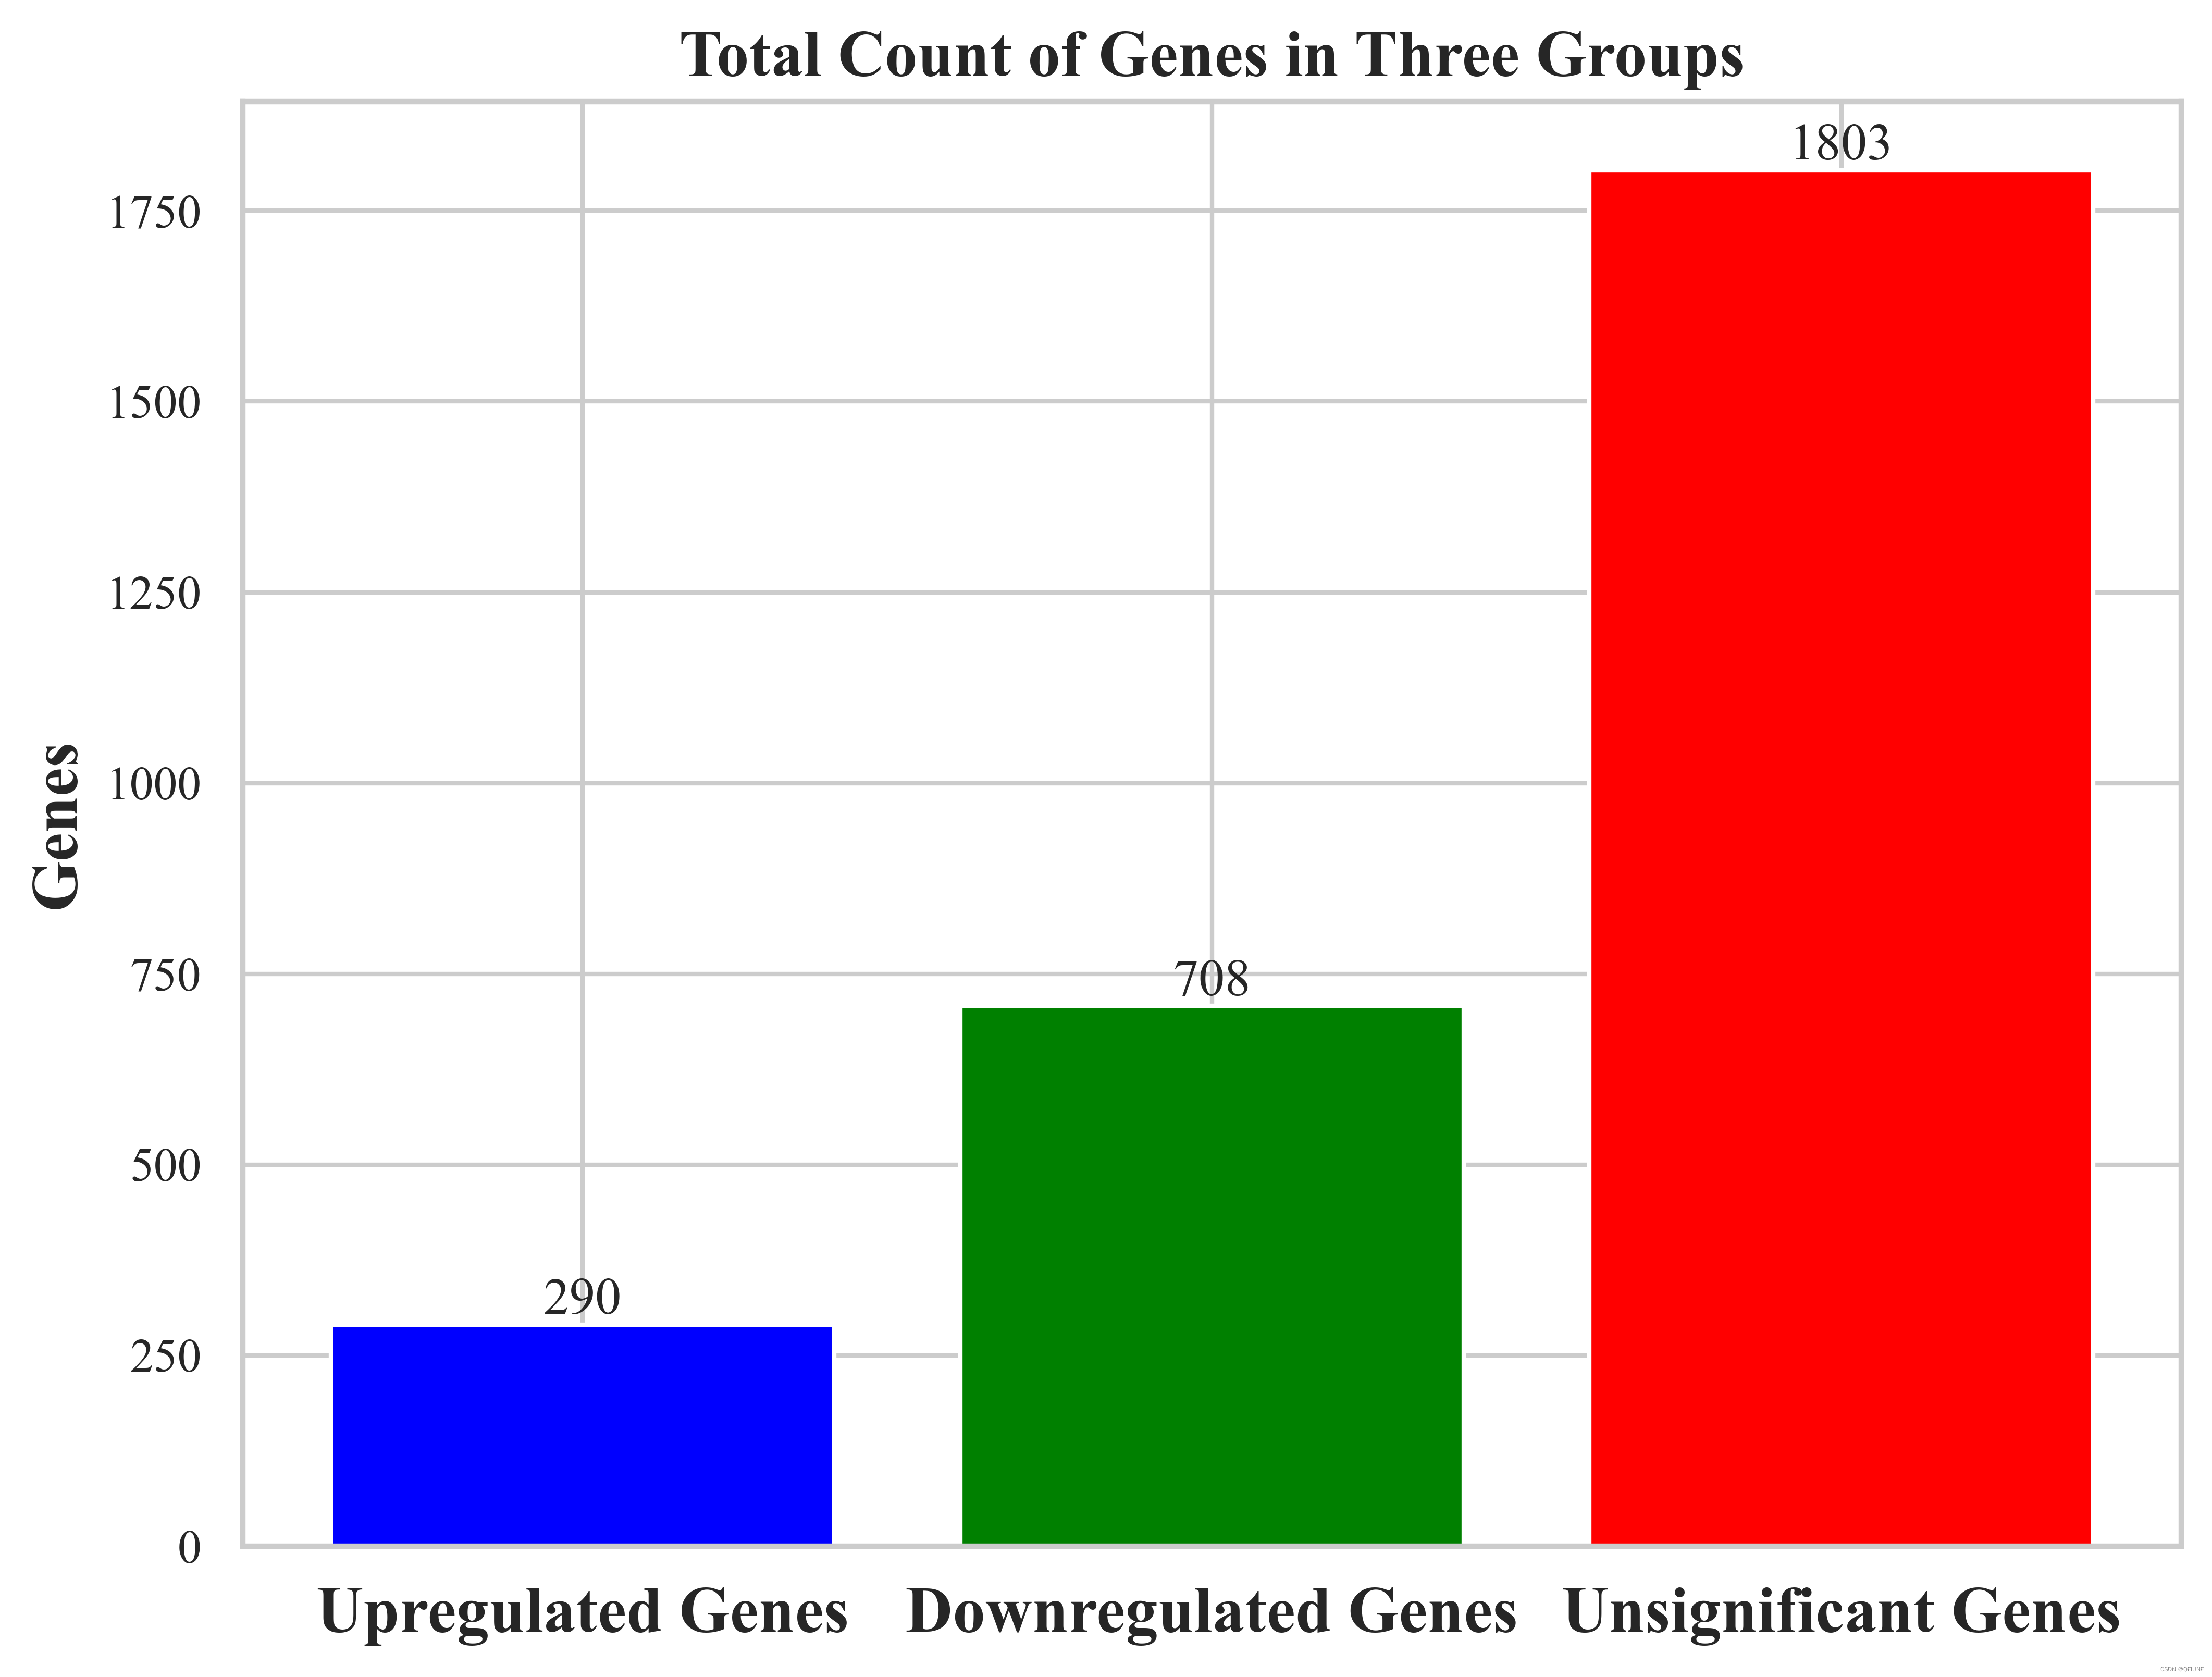
(6)绘制柱状图
import matplotlib.pyplot as pltlist1 = up_genes
list2 = down_genes
list3 = no_significant_genesplt.figure(figsize=(8, 6))
# 计算每个列表的总个数
total_counts = [len(list1), len(list2), len(list3)]# 设置颜色
colors = ['blue', 'green', 'red']# 设置柱状图的位置
x = range(len(total_counts))# 绘制柱状图
bars = plt.bar(x, total_counts, color=colors)# 在每个柱子上显示个数
for bar, count in zip(bars, total_counts):plt.text(bar.get_x() + bar.get_width() / 2, bar.get_height(), count,ha='center', va='bottom')# 设置x轴标签
plt.xticks(x, ['Upregulated Genes', 'Downregulated Genes', 'Unsignificant Genes'], fontsize=15, fontweight='bold')# 设置y轴标签
plt.ylabel('Genes', fontsize=15, fontweight='bold')# 添加标题
plt.title('Total Count of Genes in Three Groups', fontsize=15, fontweight='bold')# 保存图像
save_dir = 'C:/Users/KerryChen/Desktop/LFM-Project/'
plt.savefig(save_dir + 'three_group_bar.png', dpi=600, bbox_inches='tight')  # 保存为 png 格式,dpi 设置分辨率,bbox_inches='tight' 自动裁剪边缘# 显示柱状图
plt.show()
结果展示:
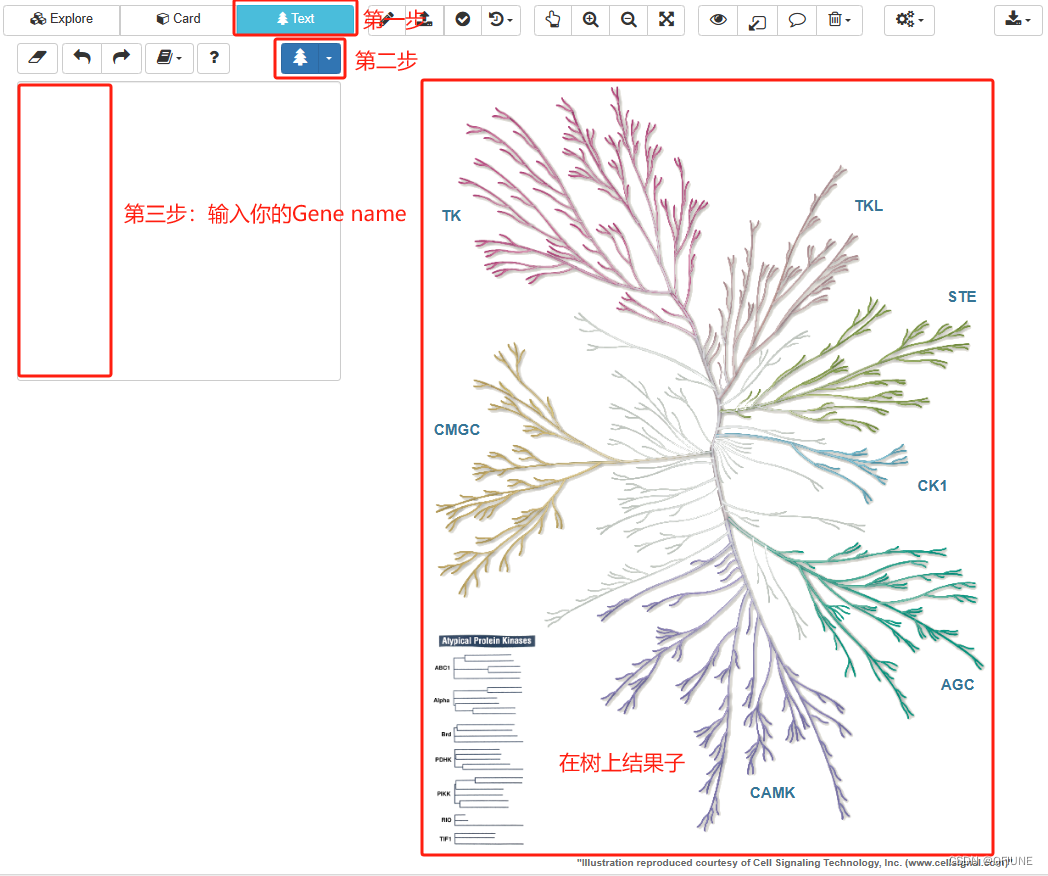
(7)绘制激酶树
在现成的网站上绘制激酶树:KinMap (kinhub.org),将上调的基因输入网站,自动出来一颗激酶树
(8)Kegg和GO富集分析和绘图,参考:R语言 | 一文搞定GO、KEGG富集分析及可视化
(9)PPI网络分析寻找Hub基因,参考 :从PPI到Cytoscape:寻找hub基因
这篇关于【白菜基础】蛋白组学之生信分析(1)的文章就介绍到这儿,希望我们推荐的文章对编程师们有所帮助!


