本文主要是介绍【HPA】华为云CCE根据Prometheus Adapter 自定义custom和external业务指标,实现业务Pod自动扩缩容(更新:2024.4.1),希望对大家解决编程问题提供一定的参考价值,需要的开发者们随着小编来一起学习吧!
目录
- 冲啊!
- 环境
- 一、最终结果
- 二、原理图
- 三、制作Prometheus Exporter
- 1)使用Go语言编写
- 2)制作容器
- 3)部署到kubernetes
- 四、搭建Prometheus
- 1)添加helm源
- 2)查看版本
- 3)下载Helm 包
- 4)解压
- 5)安装
- 6)验证
- 五、搭建Prometheus Adapter
- 1)下载Helm 包
- 2)解压
- 3)修改配置
- 六、自定义指标
- 1)配置Prometheus
- 2)配置Adapter
- 七、创建HPA资源
- 1)创建hpa-external
- 2)创建hpa-custom
- 常见问题
冲啊!
环境
| 服务 | 版本 |
|---|---|
| 华为云CCE(Kubernetes)(不推荐使用) | 1.25 |
| Prometheus Server | 2.47.2 |
| Prometheus Adapter | 0.11.2 |
一、最终结果
习惯把最终结果写在最前面,这样方便大家判断本篇文章适不适合自己
存在两种结果:
1、custom api
namespace:ops
pod:业务pod、metrics-exporter
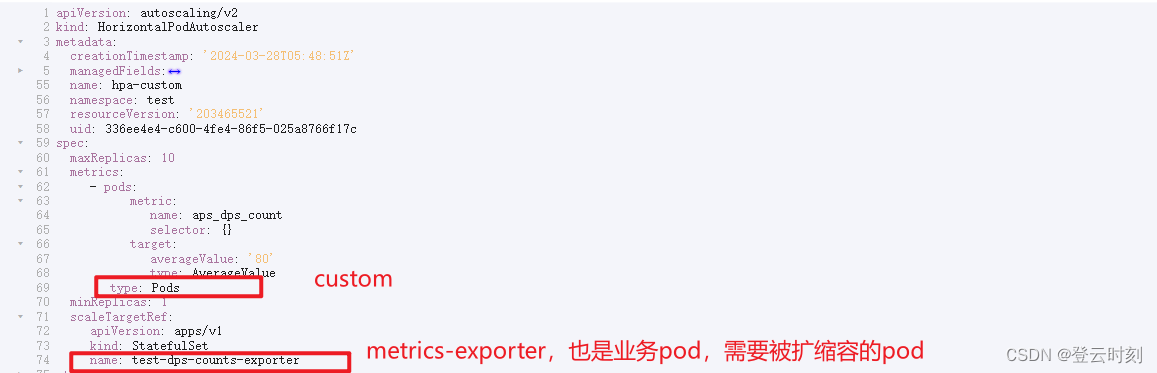
同一个命名空间下,要被扩缩容的pod与监控指标pod必须是一个,也就是业务pod需要跟监控指标共存
2、external api
namespace:ops
pod:业务pod
pod:metrics-exporter
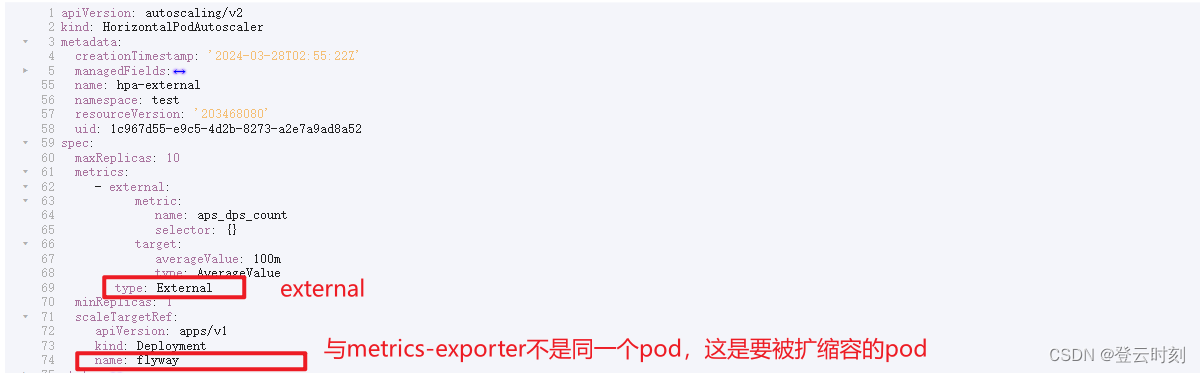
同一个命名空间下,要被扩缩容的pod与监控指标pod不用是一个
共同点,监控指标与被扩缩容的pod需要在同一个命名空间下
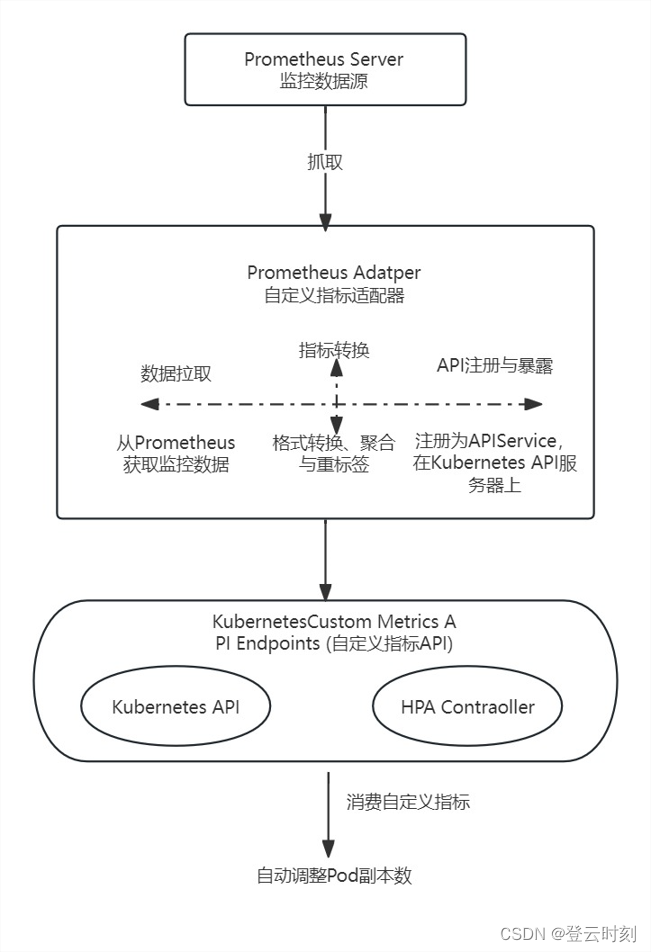
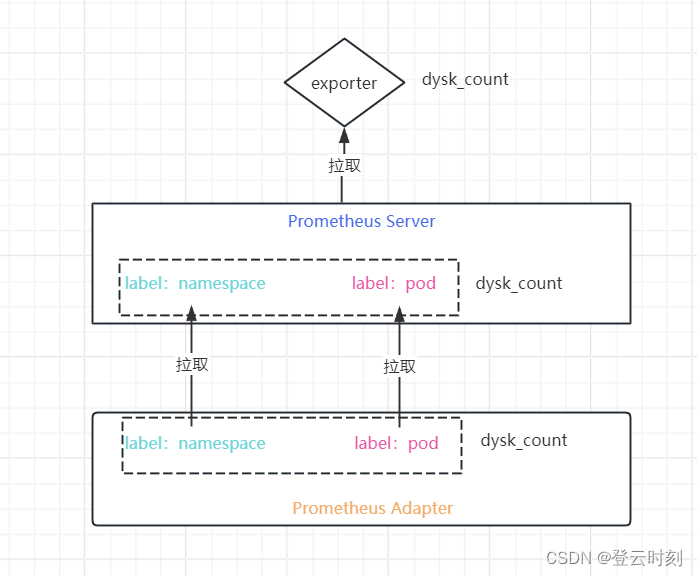
二、原理图
三、制作Prometheus Exporter
既然我们是自定义指标,那我们就需要自己写expoter代码,开发获取适合自己要监控的数据,比如我这里需要GET请求方式获取业务上指定的API接口返回值中data的值
1)使用Go语言编写
go版本需要1.20+
vim prometheus-dysk-counts.go
package mainimport ("encoding/json""flag""fmt""io/ioutil""net/http""time""github.com/prometheus/client_golang/prometheus""github.com/prometheus/client_golang/prometheus/promhttp"
)var DYSK_COUNTS_URL = flag.String("DYSK_COUNTS_URL", "值为空", "格式错误,请参考: -DYSK_COUNTS_URL http://xxxxxxxxxxxxxxxxxxxxxx ")// 定义 Prometheus 指标
var apsDpsCount = prometheus.NewGauge(prometheus.GaugeOpts{Name: "dysk_count",Help: "Current count of executing async tasks",
})func fetchAPIData() (float64, error) {apiURL := *DYSK_COUNTS_URLresp, err := http.Get(apiURL)if err != nil {return 0, fmt.Errorf("failed to fetch data: %w", err)}defer resp.Body.Close()body, err := ioutil.ReadAll(resp.Body)if err != nil {return 0, fmt.Errorf("failed to read response body: %w", err)}var data map[string]interface{}err = json.Unmarshal(body, &data)if err != nil {return 0, fmt.Errorf("failed to unmarshal JSON: %w", err)}count, ok := data["data"].(float64)if !ok {return 0, fmt.Errorf("unable to extract 'data' field as float64")}return count, nil
}func updateAPIMetric() {for range time.Tick(500 * time.Millisecond) { // 设置定时任务,每隔500ms更新一次count, err := fetchAPIData()if err != nil {fmt.Printf("Error fetching API data: %v\n", err)} else {apsDpsCount.Set(count)}}
}func main() {flag.Parse()prometheus.MustRegister(apsDpsCount)go updateAPIMetric() // 启动定时更新的任务http.Handle("/metrics", promhttp.Handler()) // 注册 /metrics 路由用于暴露指标fmt.Println("Starting Prometheus exporter on :9101/metrics...")http.ListenAndServe(":9101", nil)
}
执行代码
go run prometheus-dysk-counts.go -DYSK_COUNTS_URL https://xxxxxxxxxx-tasks/executing-count

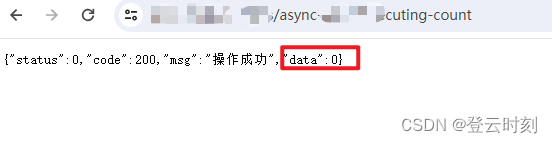
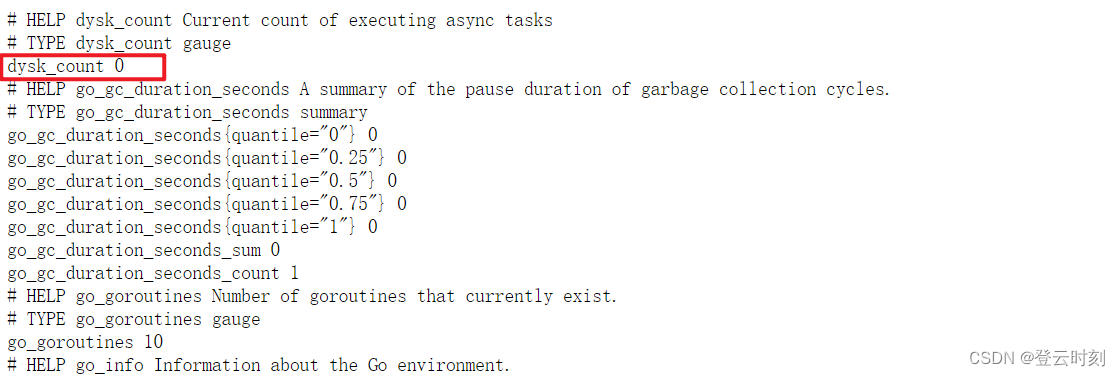
浏览器打开http://127.0.0.1:9101/metrics,可以看到有一项指标是dysk_count,这个就是我们接下来要监控的指标,现在图片上显示的是0,如果变成指定值,HPA可以进行扩缩容
改变该API的值,如果dysk_count发生变化说明我们的exporter很成功!🤗
立马给它打成二进制文件,准备封装到容器里
go build prometheus-dysk-counts.go
2)制作容器
容器启动脚本
vim prometheus-dysk-counts.sh
#/bin/bash
echo "环境地址:${DYSK_COUNTS_URL}"
/tmp/prometheus-dysk-counts -DYSK_COUNTS_URL ${DYSK_COUNTS_URL}
[root@ops-aps-prod promtheus-dps-counts]#
定义Dockerfile
vim Dockerfile
FROM amd64/golang:1.20.14
COPY prometheus-dysk-counts.sh /tmp/prometheus-dysk-counts.sh
COPY prometheus-dysk-counts /tmp/prometheus-dysk-counts
RUN chmod +x /tmp/prometheus-dysk-counts.sh
RUN chmod +x /tmp/prometheus-dysk-counts
ENTRYPOINT ["/bin/bash","/tmp/prometheus-dysk-counts.sh"]
现在当前目录文件是这样的
#ls
Dockerfile  go.mod  go.sum  prometheus-adapter  prometheus-dysk-counts  prometheus-dysk-counts.go  prometheus-dysk-counts.sh
开始构建容器镜像
docker build -t dysk-prometheus:202403291130 .
dysk-prometheus:202403291130 将是我们要部署到要被扩缩容的pod命名空间中
上传到华为云SWR(因为它免费,而且没有标签限制,阿里云ACR有标签限制)
新镜像:
swr.cn-north-4.myhuaweicloud.com/dongweizhen/sofawares/dysk-prometheus:202403291130
3)部署到kubernetes
vim prometheus-dysk-counts.yaml
---
apiVersion: apps/v1
kind: StatefulSet
metadata:name: dysk-count-exporter
spec:replicas: 1selector:matchLabels:app: dysk-count-exporterserviceName: dysk-count-svc-exportertemplate:metadata:labels:app: dysk-count-exporterspec:
#      affinity:
#        podAffinity:
#          preferredDuringSchedulingIgnoredDuringExecution:
#          - podAffinityTerm:
#              labelSelector:
#                matchExpressions:
#                - key: app
#                  operator: In
#                  values:
#                  - zk
#              topologyKey: kubernetes.io/hostname
#            weight: 1
#        podAntiAffinity:
#          preferredDuringSchedulingIgnoredDuringExecution:
#          - weight: 1
#            podAffinityTerm:
#              labelSelector:
#                matchExpressions:
#                - key: app
#                  operator: In
#                  values:
#                  - dysk-count
#              topologyKey: kubernetes.io/hostnamecontainers:- env:- name: DYSK_COUNTS_URLvalue: https://xxxxxxxxxxxxxxxxxxxxx-tasks/executing-count   #换成自己的业务apiimage: swr.cn-north-4.myhuaweicloud.com/dongweizhen/sofawares/dysk-prometheus:202403291130imagePullPolicy: Alwaysname: k8s-dysk-countupdateStrategy:rollingUpdate:partition: 0type: RollingUpdate
---
apiVersion: v1
kind: Service
metadata:labels:app: dysk-count-exportername: dysk-count-svc-exporter
spec:clusterIP: Noneports:- name: dysk9101port: 9101protocol: TCPtargetPort: 9101selector:app: dysk-count-exportersessionAffinity: Nonetype: ClusterIP
kubectl apply -f prometheus-dysk-counts.yaml -n ops
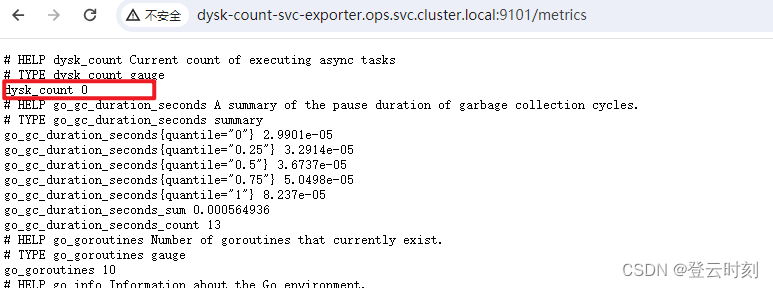
访问http://dysk-count-svc-exporter.ops.svc.cluster.local:9101/metrics
四、搭建Prometheus
1)添加helm源
添加Helm源
helm repo add prometheus-community https://prometheus-community.github.io/helm-charts
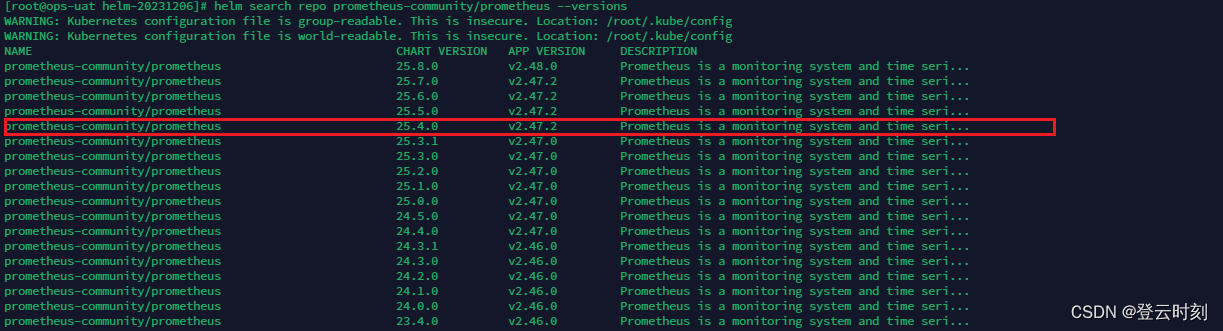
2)查看版本
helm search repo prometheus-community/prometheus --versions
3)下载Helm 包
helm pull prometheus-community/prometheus --version 25.4.0
4)解压
tar -zxvf prometheus-25.4.0.tgz
5)安装
helm install prometheus prometheus/ -n monitoring
查看下创建出来的主要资源
[root@ops-dysk prometheus]# kubectl get deploy,sts,svc,pvc,configmap -n monitoring
NAME                                                READY   UP-TO-DATE   AVAILABLE   AGE
deployment.apps/prometheus-kube-state-metrics       1/1     1            1           8m40s
deployment.apps/prometheus-prometheus-pushgateway   1/1     1            1           8m40s
deployment.apps/prometheus-server                   1/1     1            1           8m40sNAME                                       READY   AGE
statefulset.apps/prometheus-alertmanager   1/1     8m40sNAME                                          TYPE        CLUSTER-IP       EXTERNAL-IP   PORT(S)    AGE
service/prometheus-alertmanager               ClusterIP   10.247.239.90    <none>        9093/TCP   8m40s
service/prometheus-alertmanager-headless      ClusterIP   None             <none>        9093/TCP   8m40s
service/prometheus-kube-state-metrics         ClusterIP   10.247.234.53    <none>        8080/TCP   8m40s
service/prometheus-prometheus-node-exporter   ClusterIP   10.247.105.63    <none>        9100/TCP   8m40s
service/prometheus-prometheus-pushgateway     ClusterIP   10.247.197.227   <none>        9091/TCP   8m40s
service/prometheus-server                     ClusterIP   10.247.199.199   <none>        80/TCP     8m40sNAME                                                      STATUS   VOLUME                                     CAPACITY   ACCESS MODES   STORAGECLASS          AGE
persistentvolumeclaim/prometheus-server                   Bound    pvc-8eb0f40e-768a-497f-aee4-6671f47f8335   8Gi        RWO            sfsturbo-sc-subpath   8m40s
persistentvolumeclaim/storage-prometheus-alertmanager-0   Bound    pvc-e65433c4-ab3d-41cd-9ba6-e531262dc940   2Gi        RWO            sfsturbo-sc-subpath   8m40sNAME                                DATA   AGE
configmap/kube-root-ca.crt          1      71d
configmap/prometheus-alertmanager   1      13m
configmap/prometheus-server         6      13m
安装后的服务相关运维信息:
Prometheus配置文件、报警规则配置文件:prometheus-server(configmap)
Alertmanager配置文件:prometheus-alertmanager(configmap)
Prometheus数据持久化:prometheus-server(PVC)
Alertmanager数据持久化: storage-prometheus-alertmanager-0(PVC)
Prometheus访问地址:http://prometheus-server.monitoring.svc.cluster.local(SVC)
Alertmanager访问地址:http://prometheus-alertmanager.monitoring.svc.cluster.local:9093(SVC)
以上,我们已经把Prometheus、Alertmanager、Node-exporter安装完成
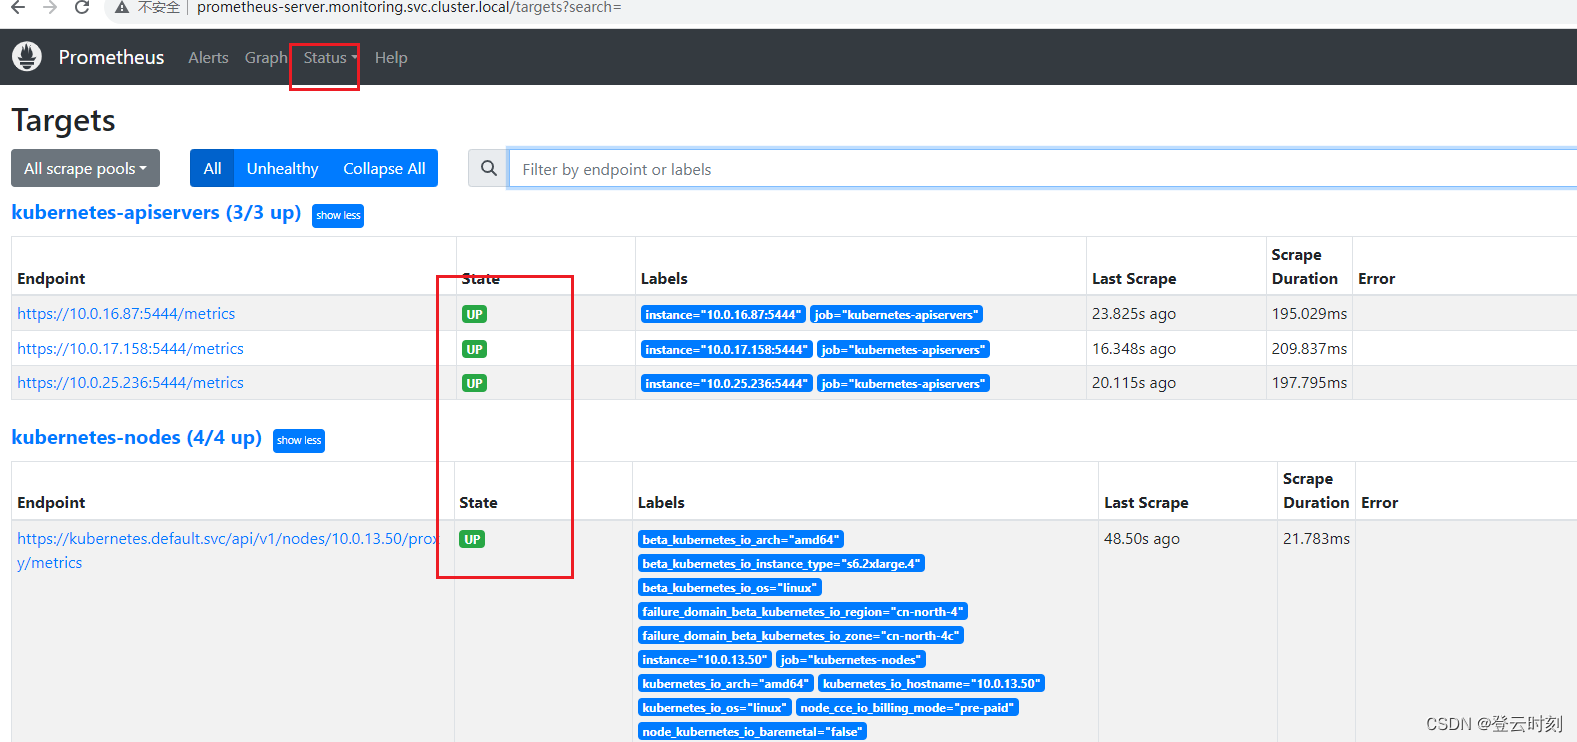
6)验证
查看Prometheus监控状态,这种就证明Prometheus服务是正常的
五、搭建Prometheus Adapter
1)下载Helm 包
helm pull prometheus-community/prometheus-adapter --version 4.9.0
2)解压
tar -zxvf prometheus-adapter-4.9.0.tgz
3)修改配置
修改prometheus-adapter/values.yaml文件
affinity: {}topologySpreadConstraints: []image:repository: swr.cn-north-4.myhuaweicloud.com/dongweizhen/sofawares/prometheus-adapter  #已经给你们准备好了# if not set appVersion field from Chart.yaml is usedtag: "v0.11.2"pullPolicy: IfNotPresentlogLevel: 4metricsRelistInterval: 1mlistenPort: 6443nodeSelector: {}priorityClassName: ""## Override the release namespace (for multi-namespace deployments in combined charts)
namespaceOverride: ""## Additional annotations to add to all resources
customAnnotations: {}# role: custom-metrics## Additional labels to add to all resources
customLabels: {}# monitoring: prometheus-adapter# Url to access prometheus
prometheus:# Value is templatedurl: http://prometheus-server.monitoring.svc.cluster.local  #修改成自己的Prometheus server地址port: 80  #Prometheus server端口号path: ""replicas: 1# k8s 1.21 needs fsGroup to be set for non root deployments
# ref: https://github.com/kubernetes/kubernetes/issues/70679
podSecurityContext:fsGroup: 10001# SecurityContext of the container
# ref. https://kubernetes.io/docs/tasks/configure-pod-container/security-context
securityContext:allowPrivilegeEscalation: falsecapabilities:drop: ["ALL"]readOnlyRootFilesystem: truerunAsNonRoot: truerunAsUser: 10001seccompProfile:type: RuntimeDefaultrbac:# Specifies whether RBAC resources should be createdcreate: trueexternalMetrics:resources: ["*"]customMetrics:resources: ["*"]psp:# Specifies whether PSP resources should be createdcreate: false# Annotations added to the pod security policyannotations: {}## Ref: https://kubernetes.io/docs/concepts/policy/pod-security-policy/#apparmor## Ref: https://kubernetes.io/docs/concepts/policy/pod-security-policy/#seccomp## Ref: https://kubernetes.io/docs/concepts/policy/pod-security-policy/#sysctlserviceAccount:# Specifies whether a service account should be createdcreate: true# The name of the service account to use.# If not set and create is true, a name is generated using the fullname templatename:# ServiceAccount annotations.# Use case: AWS EKS IAM roles for service accounts# ref: https://docs.aws.amazon.com/eks/latest/userguide/specify-service-account-role.htmlannotations: {}# Custom DNS configuration to be added to prometheus-adapter pods
dnsConfig: {}# nameservers:#   - 1.2.3.4# searches:#   - ns1.svc.cluster-domain.example#   - my.dns.search.suffix# options:#   - name: ndots#     value: "2"#   - name: edns0resources: {}# requests:#   cpu: 100m#   memory: 128Mi# limits:#   cpu: 100m#   memory: 128Mi# Configure liveness probe
# https://kubernetes.io/docs/reference/kubernetes-api/workload-resources/pod-v1/#Probe
livenessProbe:httpGet:path: /healthzport: httpsscheme: HTTPSinitialDelaySeconds: 30timeoutSeconds: 5# Configure readiness probe
readinessProbe:httpGet:path: /healthzport: httpsscheme: HTTPSinitialDelaySeconds: 30timeoutSeconds: 5# Configure startup probe
# Use if prometheus-adapter takes a long time to finish startup e.g. polling a lot of API versions in cluster
startupProbe: {}rules:default: true  #开启默认收集指标规格custom: []# - seriesQuery: '{__name__=~"^some_metric_count$"}'#   resources:#     template: <<.Resource>>#   name:#     matches: ""#     as: "my_custom_metric"#   metricsQuery: sum(<<.Series>>{<<.LabelMatchers>>}) by (<<.GroupBy>>)# Mounts a configMap with pre-generated rules for use. Overrides the# default, custom, external and resource entriesexisting:external:      #开启external自定义指标规则- seriesQuery: '{__name__=~"^some_metric_count$"}'resources:template: <<.Resource>>name:matches: ""as: "my_external_metric"metricsQuery: sum(<<.Series>>{<<.LabelMatchers>>}) by (<<.GroupBy>>)# resource:#   cpu:#     containerQuery: |#       sum by (<<.GroupBy>>) (#         rate(container_cpu_usage_seconds_total{container!="",<<.LabelMatchers>>}[3m])#       )#     nodeQuery: |#       sum  by (<<.GroupBy>>) (#         rate(node_cpu_seconds_total{mode!="idle",mode!="iowait",mode!="steal",<<.LabelMatchers>>}[3m])#       )#     resources:#       overrides:#         node:#           resource: node#         namespace:#           resource: namespace#         pod:#           resource: pod#     containerLabel: container#   memory:#     containerQuery: |#       sum by (<<.GroupBy>>) (#         avg_over_time(container_memory_working_set_bytes{container!="",<<.LabelMatchers>>}[3m])#       )#     nodeQuery: |#       sum by (<<.GroupBy>>) (#         avg_over_time(node_memory_MemTotal_bytes{<<.LabelMatchers>>}[3m])#         -#         avg_over_time(node_memory_MemAvailable_bytes{<<.LabelMatchers>>}[3m])#       )#     resources:#       overrides:#         node:#           resource: node#         namespace:#           resource: namespace#         pod:#           resource: pod#     containerLabel: container#   window: 3mservice:annotations: {}port: 443type: ClusterIP# clusterIP: 1.2.3.4ipDualStack:enabled: falseipFamilies: ["IPv6", "IPv4"]ipFamilyPolicy: "PreferDualStack"
tls:enable: falseca: |-# Public CA file that signed the APIServicekey: |-# Private key of the APIServicecertificate: |-# Public key of the APIService# Set environment variables from secrets, configmaps or by setting them as name/value
env: []# - name: TMP_DIR#   value: /tmp# - name: PASSWORD#   valueFrom:#     secretKeyRef:#       name: mysecret#       key: password#       optional: false# Any extra arguments
extraArguments: []# - --tls-private-key-file=/etc/tls/tls.key# - --tls-cert-file=/etc/tls/tls.crt# Additional containers to add to the pod
extraContainers: []# Any extra volumes
extraVolumes: []# - name: example-name#   hostPath:#     path: /path/on/host#     type: DirectoryOrCreate# - name: ssl-certs#   hostPath:#     path: /etc/ssl/certs/ca-bundle.crt#     type: File# Any extra volume mounts
extraVolumeMounts: []#   - name: example-name#     mountPath: /path/in/container#   - name: ssl-certs#     mountPath: /etc/ssl/certs/ca-certificates.crt#     readOnly: truetolerations: []# Labels added to the pod
podLabels: {}# Annotations added to the pod
podAnnotations: {}# Annotations added to the deployment
deploymentAnnotations: {}hostNetwork:# Specifies if prometheus-adapter should be started in hostNetwork mode.## You would require this enabled if you use alternate overlay networking for pods and# API server unable to communicate with metrics-server. As an example, this is required# if you use Weave network on EKS. See also dnsPolicyenabled: false# When hostNetwork is enabled, you probably want to set this to ClusterFirstWithHostNet
# dnsPolicy: ClusterFirstWithHostNet# Deployment strategy type
strategy:type: RollingUpdaterollingUpdate:maxUnavailable: 25%maxSurge: 25%podDisruptionBudget:# Specifies if PodDisruptionBudget should be enabled# When enabled, minAvailable or maxUnavailable should also be defined.enabled: falseminAvailable:maxUnavailable: 1certManager:enabled: falsecaCertDuration: 43800h0m0scertDuration: 8760h0m0s
注意!!!
external的注释一定要开,不开的话是没有/apis/external.metrics.k8s.io/v1beta1API的,无法完成下面的external自定义指标测试
六、自定义指标
到目前为止,我们准备好了Exporter、Prometheus、Adapter,接下来是最关键的一步,也是核心步骤,我们把他们串一起
从上面原理图分析,可以得到下面的图
1)配置Prometheus
新增:
scrape_configs:
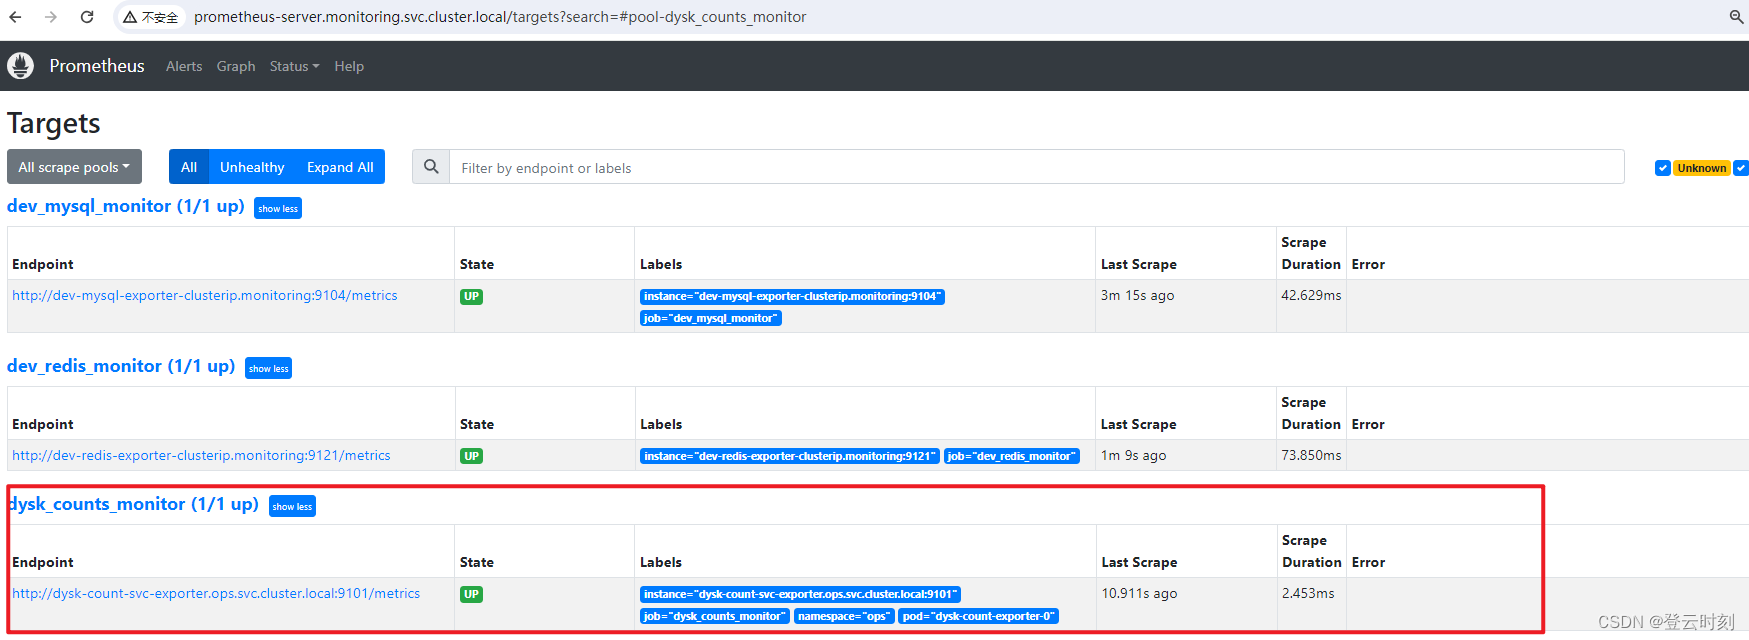
- job_name: 'dysk_counts_monitor'static_configs:- targets: ['dysk-count-svc-exporter.ops.svc.cluster.local:9101']labels:pod: dysk-count-exporter-0 #与上面第三步骤部署的metrics-exporter名称一致 namespace: ops
Prometheus标签让我指定了,这样的做法更符合我们上面画的图,看的更加清晰
重启Prometheus Server端,可以看到存在我们新增的target
2)配置Adapter
rules:
- seriesQuery: '{__name__=~"^dysk_count$",container!="POD",namespace!="",pod!=""}'resources:overrides:namespace: { resource: "namespace" }pod: { resource: "pod" }name:matches: ""as: ""metricsQuery: sum(<<.Series>>{<<.LabelMatchers>>,container!="POD"}) by (<<.GroupBy>>)
externalRules:
- seriesQuery: '{__name__=~"^dysk_count$",container!="POD"}'resources:overrides:namespace: { resource: "namespace" }name:matches: "dysk_count"as: "dysk_count"metricsQuery: sum(<<.Series>>{<<.LabelMatchers>>,container!="POD"}) by (<<.GroupBy>>)
重启Prometheus Adapter,查看下新增指标是否能获取到
查看获取external指标
kubectl get --raw '/apis/external.metrics.k8s.io/v1beta1' | jq .
{"kind": "APIResourceList","apiVersion": "v1","groupVersion": "external.metrics.k8s.io/v1beta1","resources": [{"name": "dysk_count","singularName": "","namespaced": true,"kind": "ExternalMetricValueList","verbs": ["get"]}]
}
查看指定命名空间能否获取到指标
kubectl get --raw '/apis/external.metrics.k8s.io/v1beta1/namespaces/ops/dysk_count' | jq .
{"kind": "ExternalMetricValueList","apiVersion": "external.metrics.k8s.io/v1beta1","metadata": {},"items": [{"metricName": "dysk_count","metricLabels": {},"timestamp": "2024-04-01T00:57:23Z","value": "0"}]
}
查看获取custom指标
kubectl get --raw '/apis/custom.metrics.k8s.io/v1beta1' | jq .
{"kind": "APIResourceList","apiVersion": "v1","groupVersion": "custom.metrics.k8s.io/v1beta1","resources": [{"name": "namespaces/dysk_count","singularName": "","namespaced": false,"kind": "MetricValueList","verbs": ["get"]},{"name": "pods/dysk_count","singularName": "","namespaced": true,"kind": "MetricValueList","verbs": ["get"]}]
}
查看指定命名空间指定pod能否获取到指标
kubectl get --raw '/apis/custom.metrics.k8s.io/v1beta1/namespaces/ops/pods/*/dysk_count' | jq .
{"kind": "MetricValueList","apiVersion": "custom.metrics.k8s.io/v1beta1","metadata": {},"items": [{"describedObject": {"kind": "Pod","namespace": "ops","name": "dysk-count-exporter-0","apiVersion": "/v1"},"metricName": "dysk_count","timestamp": "2024-04-01T00:56:21Z","value": "0","selector": null}]
}
七、创建HPA资源
1)创建hpa-external
vim hpa-external-dysk-count.yaml
apiVersion: autoscaling/v2beta2
kind: HorizontalPodAutoscaler
metadata:name: hpa-external-dysk-countnamespace: ops
spec:scaleTargetRef:apiVersion: apps/v1kind: Deploymentname: nginxminReplicas: 1maxReplicas: 3metrics:- external:metric:name: dysk_counttarget:averageValue: '1'type: AverageValuetype: External
kubectl apply -f hpa-external-dysk-count.yaml
external 可以扩缩容ops命名空间下所有pod
2)创建hpa-custom
vim hpa-custom-dysk-count.yaml
apiVersion: autoscaling/v2beta2
kind: HorizontalPodAutoscaler
metadata:name: hpa-custom-dysk-countnamespace: ops
spec:scaleTargetRef:apiVersion: apps/v1kind: StatefulSetname: dysk-count-exporterminReplicas: 1maxReplicas: 3metrics:- pods:metric:name: dysk_counttarget:averageValue: '1'type: AverageValuetype: Pods
kubectl apply -f hpa-custom-dysk-count.yaml
custom只能扩缩容ops命名空间下存在dysk_count指标的pod
常见问题
1、获取指标显示无数据
kubectl get --raw '/apis/external.metrics.k8s.io/v1beta1/namespaces/ops/pods/*/dysk_count' | jq .Error from server (NotFound): the server could not find the requested resource
解决:
参考我的另一篇文章:https://dongweizhen.blog.csdn.net/article/details/136928945
这篇关于【HPA】华为云CCE根据Prometheus Adapter 自定义custom和external业务指标,实现业务Pod自动扩缩容(更新:2024.4.1)的文章就介绍到这儿,希望我们推荐的文章对编程师们有所帮助!


