本文主要是介绍39 openlayers 对接地图图层 绘制点线面圆,希望对大家解决编程问题提供一定的参考价值,需要的开发者们随着小编来一起学习吧!
前言
这里主要是展示一下 openlayers 的一个基础的使用
主要是设计 接入地图服务器的 卫星地图, 普通的二维地图, 增加地区标记
增加 省市区县 的边界标记
基础绘制 点线面园 等等
测试用例
<template><div style="width: 1920px; height:1080px;" ><div class="olMapUsageClass"></div><div class="overdelay1" ref="overdelay1" >this is over delay1</div></div></template><script>import Map from 'ol/Map'import View from 'ol/View'import DragPan from 'ol/interaction/DragPan'import MouseWheelZoom from 'ol/interaction/MouseWheelZoom'import PointerInteraction from 'ol/interaction/Pointer'import GeoJSON from 'ol/format/GeoJSON'import {Tile as TileLayer} from 'ol/layer'import {Vector as VectorLayer} from 'ol/layer'import {Image as ImageLayer} from 'ol/layer'import {Vector as VectorSource} from 'ol/source'import {Feature as Feature} from 'ol'import Point from 'ol/geom/Point'import LineString from 'ol/geom/LineString'import Polygon from 'ol/geom/Polygon'import CircleGeo from 'ol/geom/Circle'import XYZ from "ol/source/XYZ"import ImageStatic from "ol/source/ImageStatic"import {Circle, Fill, Icon, RegularShape, Stroke, Style, Text} from 'ol/style'import Overlay from 'ol/Overlay'import {transformExtent, transform} from "ol/proj"let sichuanJson = require(`../../public/json/sichuan.json`)export default {name: "olMapUsage",components: {},props: {},data() {return {map: null,tdtImgLayer: null,labelLayer: null,overlay: null,};},computed: {},watch: {},created() {},mounted() {this.initMap()this.test01AddBoundsLayer()this.test02AddDtImageLayer()// this.test03AddDtTDLayer()this.test04AddDtLabelLayer()this.test05AddImageLayer()this.test06AddCircleLayer([104.065735, 30.359462])this.test06AddCircleLayer([104.565735, 30.859462], "red")this.test07AddLineLayer()this.test08AddAreaLayer()this.test09AddCircleLayer()// this.test12SetCenterThenAddOverlay()},methods: {initMap() {let center = [104.065735, 30.659462]let projection = "EPSG:4326"let zoom = 10let minZoom = 5let maxZoom = 20const layer = []const view = new View({...(this.viewOptions || {}),projection,center,zoom,minZoom,maxZoom})this.map = new Map({...(this.mapOptions || {}),layers: [].concat(layer),view: view,target: this.$el,controls: [],interactions: [new DragPan(),new MouseWheelZoom(),new PointerInteraction({handleEvent: this.handleEvent})]})},test01AddBoundsLayer() {const source = new VectorSource({})const style = {color: 'rgba(75,165,234,1)', width: '3'}const fill = 'rgba(255,255,255,0)'let parsedStyle = this.parseStyle({style, fill})const boundsLayer = new VectorLayer({zIndex: 1,source,parsedStyle})this.appendBounds2VectorLayer(boundsLayer, sichuanJson)this.map.addLayer(boundsLayer)},test02AddDtImageLayer() {this.tdtImgLayer = new TileLayer({zIndex: 2,source: new XYZ({projection: "EPSG:4326",url: "http://192.168.1.111:8888/tianditu/servlet/GoogleSatelliteMap?x={x}&y={y}&z={z}",}),});this.map.addLayer(this.tdtImgLayer);},test03AddDtTDLayer() {this.tdtImgLayer = new TileLayer({zIndex: 2,source: new XYZ({projection: "EPSG:4326",url: "http://192.168.1.111:8888/tianditu/servlet/GoogleTDMap?x={x}&y={y}&z={z}",}),});this.map.addLayer(this.tdtImgLayer);},test04AddDtLabelLayer() {this.labelLayer = new TileLayer({zIndex: 2,source: new XYZ({projection: "EPSG:4326",url: "http://192.168.1.111:8888/tianditu/servlet/GoogleTransparentMap?x={x}&y={y}&z={z}",}),});this.map.addLayer(this.labelLayer);},test05AddImageLayer() {// let extent = transformExtent([104.065735, 30.659462, 104.165735, 30.759462], "EPSG:4326", "EPSG:4326")let extent = [104.065735, 30.659462, 104.165735, 30.759462]let imageLayer = new ImageLayer({zIndex: 20,source: new ImageStatic({url: "/img/theme/desktop/17.jpg",projection: "EPSG:4326",imageExtent: extent}),});this.map.addLayer(imageLayer);},test06AddCircleLayer(coord, color) {color = color || 'green'let style = new Style({image: new Circle({radius:20,fill: new Fill({color: color})})})let feature = new Feature({geometry: new Point(coord)})feature.setStyle(style)let source = new VectorSource()source.addFeature(feature)let layer = new VectorLayer({zIndex: 20,source: source})this.map.addLayer(layer);},test07AddLineLayer() {let style = new Style({stroke: new Stroke({color: "blue",width: 3})})let feature = new Feature({geometry: new LineString([[104.065735, 30.359462],[104.165735, 30.359462],[104.265735, 30.459462],])})feature.setStyle(style)let source = new VectorSource()source.addFeature(feature)let layer = new VectorLayer({zIndex: 20,source: source})this.map.addLayer(layer);},test08AddAreaLayer() {let style = new Style({fill: new Fill({color: "#ff0000"}),stroke: new Stroke({color: "blue",width: 3})})let feature = new Feature({geometry: new Polygon([[transform([104.065735, 30.559462], "EPSG:4326", "EPSG:4326"),transform([104.165735, 30.559462], "EPSG:4326", "EPSG:4326"),transform([104.165735, 30.659462], "EPSG:4326", "EPSG:4326"),]])})feature.setStyle(style)let source = new VectorSource()source.addFeature(feature)let layer = new VectorLayer({zIndex: 20,source: source})this.map.addLayer(layer);},test09AddCircleLayer() {let style = new Style({fill: new Fill({color: "#ffff00"}),stroke: new Stroke({color: "#00ffff",width: 3})})let feature = new Feature({geometry: new CircleGeo(transform([104.665735, 30.559462], "EPSG:4326", "EPSG:4326"), 0.2)// geometry: new Circle([104.265735, 30.559462], 300)})feature.setStyle(style)let source = new VectorSource()source.addFeature(feature)let layer = new VectorLayer({zIndex: 20,source: source})this.map.addLayer(layer);},test10SetCenter(coord, color) {this.map.getView().setCenter(coord)this.test06AddCircleLayer(coord, color)},test11AddOverlay(coord) {this.overlay && this.map.removeOverlay(this.overlay)this.overlay = new Overlay({element: this.$refs.overdelay1,position: coord,positioning: "bottom-center",offset: [0, 0],autoPan: true,autoPanMargin: 200,autoPanAnimation: {duration: 1000},map: this.map})this.map.addOverlay(this.overlay)},test12SetCenterThenAddOverlay() {// refer cyclethis.test06AddCircleLayer([10.265735, 10.659462], "#007f5a")this.test06AddCircleLayer([105.565735, 30.759462], "#0039ff")let _this = this// use this for map.addOverlay's animation updatesetTimeout(function() {_this.test11AddOverlay([10.065735, 10.459462])_this.test10SetCenter([10.065735, 10.459462], "yellow")}, 2000)// the core case, normal or exception or compensatedsetTimeout(function() {// case1. function of addOverlay_this.test11AddOverlay([105.065735, 30.259462])// case2. normal case// _this.test11AddOverlay([105.065735, 30.259462])// _this.test10SetCenter([105.065735, 30.259462], "red")// case3. exception case// _this.test10SetCenter([105.065735, 30.259462], "red")// _this.test11AddOverlay([105.065735, 30.259462])// case4. compensated case// _this.test10SetCenter([105.065735, 30.259462], "red")// setTimeout(function() {// _this.test11AddOverlay([105.065735, 30.259462])// }, 1000)}, 5000)},appendBounds2VectorLayer(layer, json) {const geoJson = this.geoJsonDecode(json);let features = new GeoJSON().readFeatures(geoJson) || [];features = features.map(feature => {feature.__vm__ = this;return feature});const source = layer.getSource();source.addFeatures(features)},handleEvent(e) {if (e.type === "pointermove") {return true}console.log(" handle event : ", e)return true},geoJsonDecode(json) {const features = json.features || []features.forEach(feature => {const geometry = feature.geometry || {}const {coordinates, encodeOffsets} = geometryif (!encodeOffsets) returngeometry.coordinates = coordinates.map((coordinate, i) => {if (Array.isArray(coordinate)) {return coordinate.map((item, j) => {return this.decodePolygon(item, encodeOffsets[i][j])})} else {return this.decodePolygon(coordinate, encodeOffsets[i])}})geometry.encodeOffsets = null})return json},decodePolygon(coordinate, encodeOffsets) {const result = [];let prevX = encodeOffsets[0];let prevY = encodeOffsets[1];for (let i = 0; i < coordinate.length; i += 2) {let x = coordinate.charCodeAt(i) - 64;let y = coordinate.charCodeAt(i + 1) - 64;x = (x >> 1) ^ (-(x & 1));y = (y >> 1) ^ (-(y & 1));x += prevX;y += prevY;prevX = x;prevY = y;result.push([x / 1024, y / 1024]);}return result;},parseStyle(settings, StyleModel) {const PROPS_MAP = {fill: Fill,text: Text,stroke: Stroke,circle: Circle,icon: Icon,regularShape: RegularShape,backgroundFill: Fill,backgroundStroke: Stroke}const IMAGE_PROPS = [Circle, Icon, RegularShape]const opts = {};Object.entries(settings).forEach(([key, value]) => {const Model = PROPS_MAP[key];if (key === 'font') {value = `${value} sans-serif`}opts[IMAGE_PROPS.includes(Model) ? 'image' : key] = this.parseValue(Model, key, value)});return new (StyleModel || Style)(opts)},parseValue(Model, key, value) {if (value === undefined || value === null) return;if (!Model) return value;if (['fill', 'backgroundFill'].includes(key)) return this.parseFill(value);if (key === 'text') {return isObject(value) ? parse(value, Model) : value}return parse(value, Model)},parseFill(fill) {const opts = this.isObject(fill) ? fill : {color: fill}return new Fill(opts)},isObject(value) {return typeof value === 'object'}}};
</script><style lang="scss">.olMapUsageClass {}.overdelay1 {position: absolute;border: 1px greenyellow solid;width: 200px;height: 50px;}
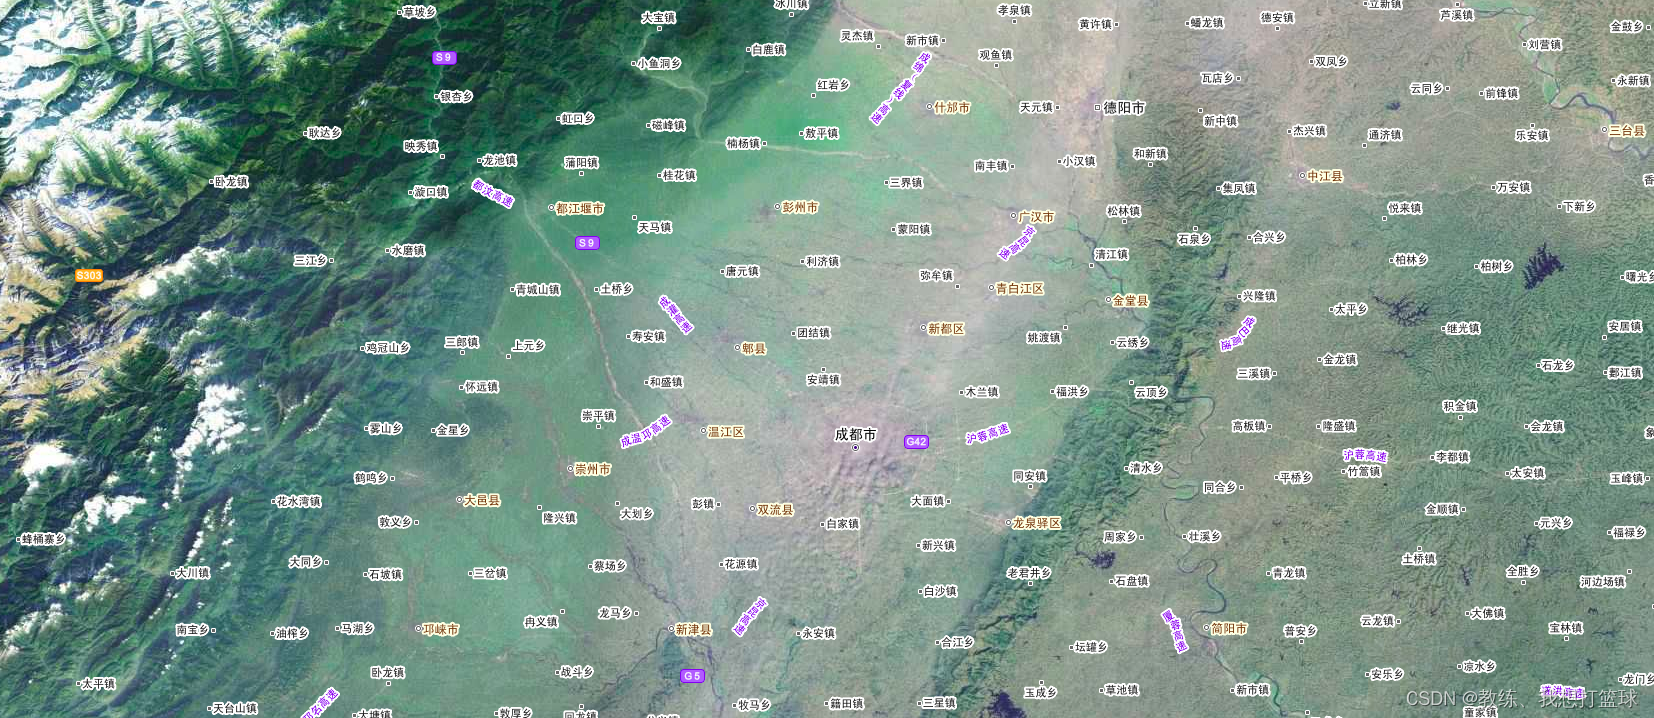
</style>绘制卫星地图 + 地图标注
执行效果如下
二维地图 + 地图标注
执行效果如下
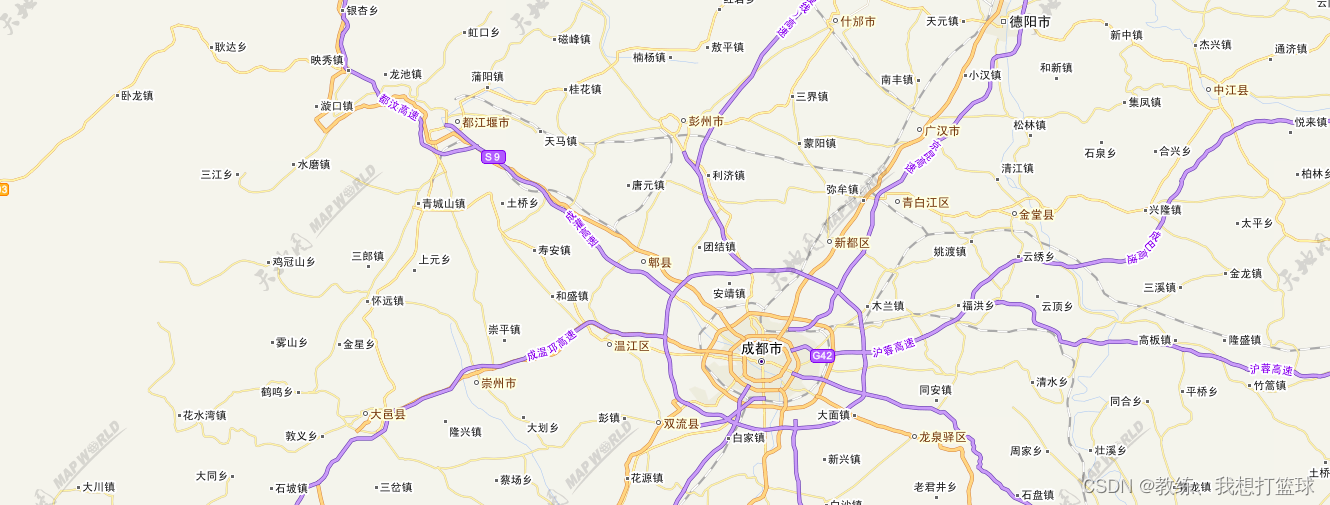
二维地图 + 地图边界
执行效果如下

绘制点线面园
执行效果如下

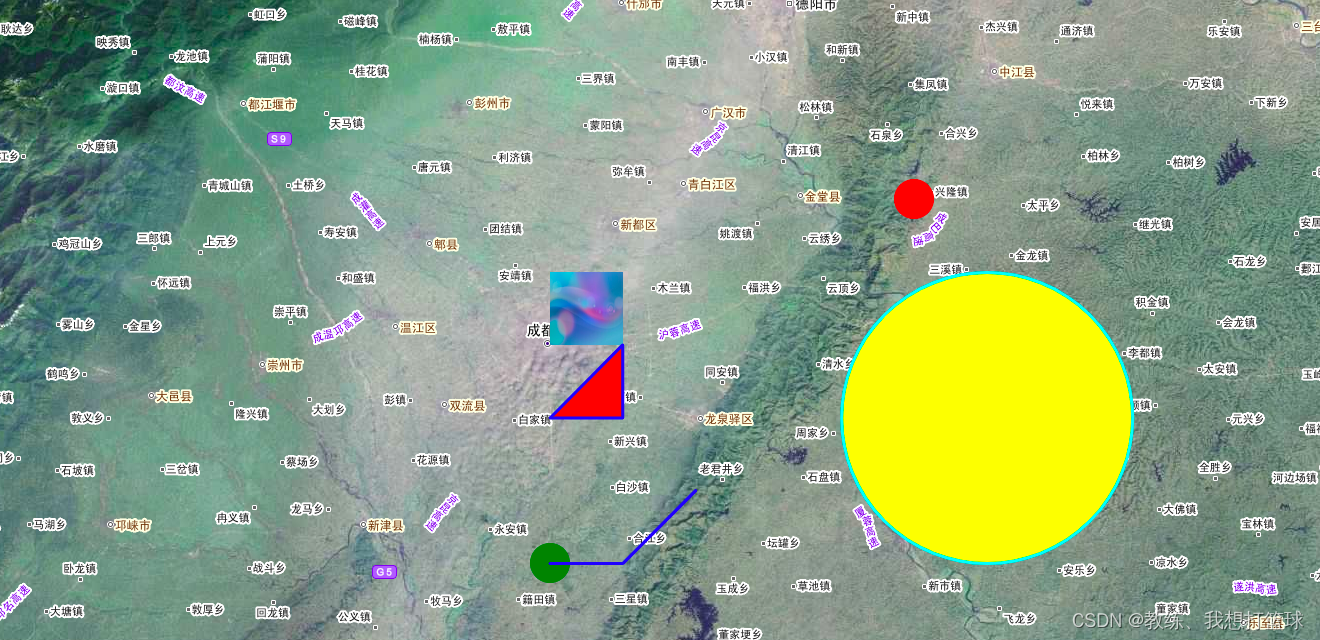
卫星地图 + 地图标注 + 点线面园
执行效果如下
完
这篇关于39 openlayers 对接地图图层 绘制点线面圆的文章就介绍到这儿,希望我们推荐的文章对编程师们有所帮助!