本文主要是介绍文献速递:深度学习乳腺癌诊断---基于深度学习的图像分析预测乳腺癌中HE染色组织病理学图像的PD-L1状态,希望对大家解决编程问题提供一定的参考价值,需要的开发者们随着小编来一起学习吧!
Title
题目
Deep learning-based image analysis predicts PD-L1 status from H&E-stained histopathol ogy images in breast cancer
基于深度学习的图像分析预测乳腺癌中H&E染色组织病理学图像的PD-L1状态
01
文献速递介绍
编程死亡配体-1(PD-L1)最近被用于乳腺癌,作为免疫治疗的预测生物标志物。通过免疫组化(IHC)进行PD-L1定量的成本、时间和变异性是一项挑战。相比之下,苏木精-伊红(H&E)染色是一种用于常规癌症诊断的稳健染色方法。在这里,我们展示了通过采用最先进的深度学习技术,可以从H&E染色图像中预测PD-L1表达。在两位专家病理学家和一个专门设计的标注软件的帮助下,我们构建了一个数据集来评估从乳腺癌H&E中预测PD-L1的可行性。在一个包含3,376名患者的队列中,我们的系统预测PD-L1状态的曲线下面积(AUC)为0.91 – 0.93。我们的系统在两个外部数据集上进行了验证,包括一个独立的临床试验队列,显示出一致的预测性能。此外,所提出的系统预测哪些病例容易被病理学家误解,显示它可以作为临床实践中的决策支持和质量保证系统。
Results
结果
PD-L1 in the BCCA and MA31 cohorts
The study was based on breast cancer tissue samples and clin icopathological data of 5596 patients with 26,763 TMA images from two independent cohorts: The British Columbia Cancer Agency (BCCA) and the MA31 (Table 1). The BCCA cohort is composed of 4,944 women with newly diagnosed invasive breast cancer in British Columbia, whose tumor specimens were processed by a central laboratory at Vancouver General Hospital between 1986 and 1992. Each woman had three H&E-stained TMA cores, one IHC-stained TMA for PD-L1, and one for PD-1.
The MA31 cohort is a clinical trial of the Canadian Cancer Trials Group, conducted from January 17, 2008, through December 1, 2011,and was designed to evaluate the prognostic and predictive biomarker utility of pretreatment serum PD-L1 levels. This cohort consists of 652 recruited patients with ERBB2-positive metastatic breast cancer from 21 countries. Each woman had between 1 to 4 H&E-stained images, and one PD-L1-stained image corresponding to each H&E image (Table 1).
An expert pathologist annotated the entire data, consisting of both BCCA and MA31 cohorts, for PD-L1 positive or negative status, by BCCA和MA31
队列中的PD-L1
本研究基于乳腺癌组织样本和5596名患者的临床病理数据,这些数据来自两个独立的队列:不列颠哥伦比亚癌症机构(BCCA)和MA31(表1)。BCCA队列由4944名在不列颠哥伦比亚新诊断的侵袭性乳腺癌女性组成,她们的肿瘤标本在1986年至1992年间由温哥华总医院的一个中心实验室处理。每位女性有三个H&E染色的TMA核心,一个用于PD-L1的免疫组织化学(IHC)染色的TMA和一个用于PD-1的。
MA31队列是加拿大癌症试验组的一个临床试验,从2008年1月17日进行到2011年12月1日,旨在评估治疗前血清PD-L1水平的预后和预测生物标志物的效用。该队列由来自21个国家的652名ERBB2阳性转移性乳腺癌患者组成。每位女性有1到4张H&E染色图像,和每张H&E图像对应的一个PD-L1染色图像(表1)。
一位专家病理学家标注了包括BCCA和MA31队列在内的全部数据,根据PD-L1阳性或阴性状态,
Methods
方法
Characteristics of the patients and the stains The dataset used in this study consists of two independent cohorts:BCCA and MA31 (Table 1). Each cohort contains breast cancer tissue samples and clinicopathological data with TMA images. Each patient in the BCCA cohort had 3 H&E-stained TMA cores, one IHC-stained TMA for PD-L1, and one for PD-1. Each patient in the MA31 cohort had between 1 to 4 H&E-stained images, and one PD-L1-stained image corresponding to each H&E image. An expert pathologist annotated the data for PD-L1 positive or negative status, by going through all available H&E and IHC-stained TMA images (Fig. 1a). Some of the samples were annotated to be excluded from the analysis (Table 1), while the rest of the patients were classified as either negative or positive for PD-L1 status. BCCA median follow-up was 12.4 years, and age at diagnosis 62 years. MA31 median follow-up was 21.5 months, and mean age at diagnosis was 55 years. The TMA images from both cohorts contain 0.6-mm-diameter cores and were scanned using the Bacus Laboratories, Inc. Slide Scanner (Bliss) scanner at a resolution of 2256 × 1440 pixels.
患者和染色的特征
本研究使用的数据集包括两个独立的队列:BCCA和MA31(表1)。每个队列包含乳腺癌组织样本和带有TMA图像的临床病理数据。BCCA队列中的每位患者有3个H&E染色的TMA核心,一个用于PD-L1的IHC染色的TMA,和一个用于PD-1的。MA31队列中的每位患者有1到4张H&E染色图像,和每张H&E图像对应的一个PD-L1染色图像。一位专家病理学家通过查看所有可用的H&E和IHC染色TMA图像(图1a),为PD-L1阳性或阴性状态进行了注释。一些样本被注释为从分析中排除(表1),而其他患者则被分类为PD-L1状态的阴性或阳性。BCCA的中位随访时间为12.4年,诊断时的年龄为62岁。MA31的中位随访时间为21.5个月,诊断时的平均年龄为55岁。两个队列中的TMA图像包含直径为0.6毫米的核心,使用Bacus实验室公司的幻灯片扫描仪(Bliss)以2256 × 1440像素的分辨率进行扫描。
Fig
图
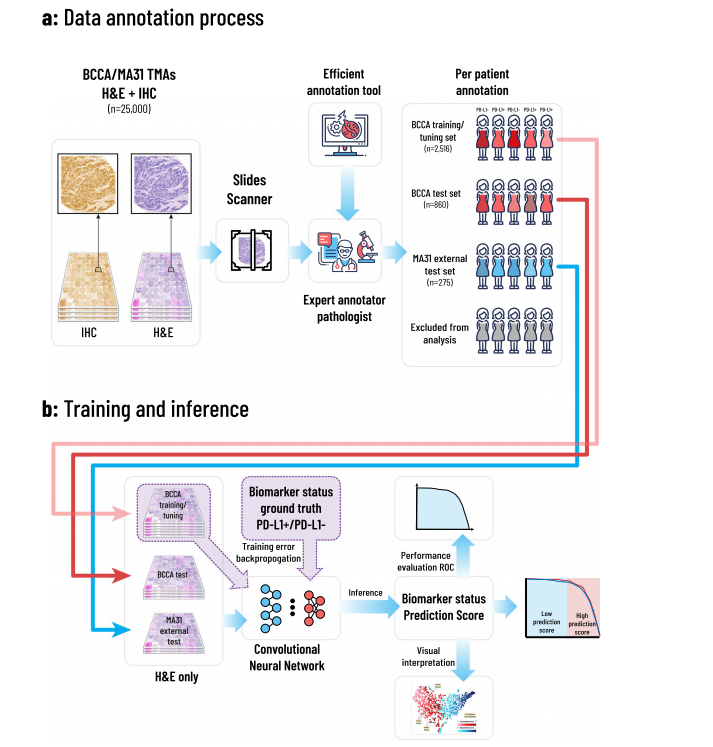
Fig. 1 | Overview of the proposed framework. The annotation, training, and inference methodologies. a An expert pathologist used our designed computer aided annotation software to annotate patients for PD-L1 status, based on their H&E and corresponding IHC-stained TMA images. Patients with no TMAs, unclear ima ges, deficient staining, and with insufficient tissue or tumor, were excluded from the analysis. The rest of the patients were assigned each a PD-L1 positive or negative label, resulting in 2516 annotated patients in the BCCA training set, 860 in the BCCA test set, and 275 in the MA31 external test set. b H&E images of the included patients were assigned the annotation of their corresponding patients. The H&E images in the BCCA training set were used to train and validate the CNN in a 5-fold cross validation manner, using the ground truth PD-L1 annotations. The model was then applied to the validation folds, the BCCA test set, and the external MA31 test set, to produce a prediction score for each H&E image. The prediction score per patient was defined as the maximum over its corresponding H&E prediction scores. The prediction scores at the patient level were then compared to the ground truth PD-L1 annotations to produce statistical analyses.
图1 | 提出的框架概览。注释、训练和推断方法。a 一位专家病理学家使用我们设计的计算机辅助注释软件,根据患者的H&E及相应的IHC染色TMA图像,为PD-L1状态进行注释。没有TMA、图像不清晰、染色不足、以及组织或肿瘤量不足的患者被排除在分析之外。其余患者每人被分配一个PD-L1阳性或阴性标签,结果在BCCA训练集中有2516名被注释的患者,在BCCA测试集中有860名,在MA31外部测试集中有275名。b 包括患者的H&E图像被分配了与其相应患者的注释。BCCA训练集中的H&E图像被用来训练和验证CNN,采用5折交叉验证的方式,使用PD-L1的真实注释。然后,模型被应用于验证折叠、BCCA测试集和外部MA31测试集,为每张H&E图像产生预测分数。每位患者的预测分数定义为其对应H&E预测分数的最大值。然后将患者级别的预测分数与真实的PD-L1注释进行比较,以产生统计分析。
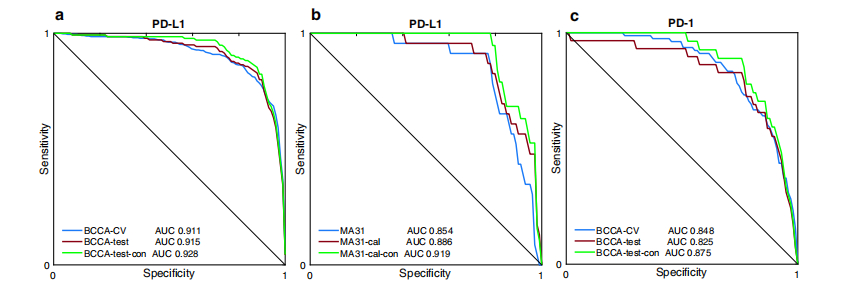
Fig. 2 | Convolutional neural networks achieve high performance in the pre diction of PD-L1 and PD-1 expression. Receiver operating characteristics (ROC) curves for the performance of the proposed models, in terms of AUC, for PD-L1 and PD-1 prediction in the BCCA and MA31 cohorts. a The model obtained high pre diction accuracies for both the BCCA cross-validation (0.911) and BCCA test set (0.915). When analyzing only concordant cases between pathologists, AUC per formance was further increased (0.928). b For the external MA31 cohort, the performance dropped to 0.854, showing that a calibration step may benefit the application of the system to new cohorts. Indeed, the calibration step increased the AUC on MA31 to 0.886, which was further increased to 0.919 after removing the discordant cases. c The AUC performance results for PD-1 prediction were lower than for PD-L1. The PD-1 AUC results were high, however, given the extremely imbalanced nature of data (only 3% positives), which poses optimization difficulties due to very few positive samples to train the system with.
图2 | 卷积神经网络在预测PD-L1和PD-1表达方面达到高性能。接收器操作特征(ROC)曲线用于展示所提模型在预测PD-L1和PD-1方面的性能,以AUC(曲线下面积)表示,针对BCCA和MA31队列。a 模型在BCCA交叉验证(0.911)和BCCA测试集(0.915)中均获得了高预测准确性。仅分析病理学家之间一致的病例时,AUC性能进一步提高(0.928)。b 对于外部的MA31队列,性能下降到0.854,表明校准步骤可能有助于系统应用到新的队列。实际上,校准步骤将MA31的AUC提高到0.886,去除不一致病例后进一步提高到0.919。c PD-1预测的AUC性能结果低于PD-L1。然而,考虑到数据极度不平衡的特性(仅3%为阳性),这对优化构成了难题,因为用于训练系统的阳性样本非常少,PD-1的AUC结果仍然很高。
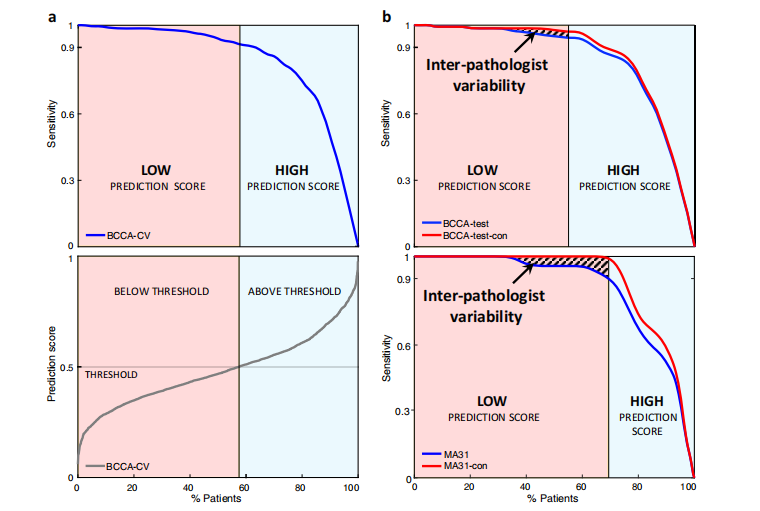
Fig. 3 | Impact of the proposed system on clinical practice. a The threshold for splitting the patients’ prediction scores to low and high is tuned in the BCCA cross validation. Bottom: The sorted prediction scores of the patients, versus the per centage of patients classified below the threshold. Top: The cross-validation sen sitivity of the system, versus the percentage of patients classified below the threshold (i.e., classified as low-PS), showing a trade-off between the two. The threshold was selected as 0.5, resulting in a sensitivity of 0.92 for BCCA-CV with 58% of the patients in the low-PS group. b Applying the selected threshold to the BCCA test patients (top) and MA31 patients (bottom). Following the system’s predictions allows the pathologists to focus on reviewing the cases classified as low-PS by the system and positive by the pathologist, which may be prone to miss-interpretation or deficient PD-L1 staining. After removing the discordant cases from the analysis, the sensitivity was increased (BCCA-test-con and MA31-con), revealing the inter pathologist variability. In addition to quality assurance, the system could be used to allow pathologists to spare IHC staining and interpretation from more than 70% of the patients while retaining 100% sensitivity for PD-L1 expression in MA31.
图3 | 提出的系统对临床实践的影响。a 在BCCA交叉验证中调整将患者预测分数分为低和高的阈值。底部:患者的排序预测分数与被分类为低于阈值的患者百分比。顶部:系统的交叉验证灵敏度与被分类为低于阈值的患者百分比(即,被分类为低PS)相对,显示了两者之间的权衡。阈值被选为0.5,导致BCCA-CV的灵敏度为0.92,有58%的患者在低PS组中。b 将选定的阈值应用于BCCA测试患者(顶部)和MA31患者(底部)。遵循系统的预测允许病理学家专注于复审被系统分类为低PS且病理学家判定为阳性的病例,这些病例可能容易误解或PD-L1染色不足。从分析中移除不一致的病例后,灵敏度增加(BCCA-test-con和MA31-con),揭示了病理学家之间的变异性。除了质量保证外,该系统还可以使病理学家在保留对MA31中PD-L1表达100%灵敏度的同时,免除超过70%的患者的IHC染色和解释。
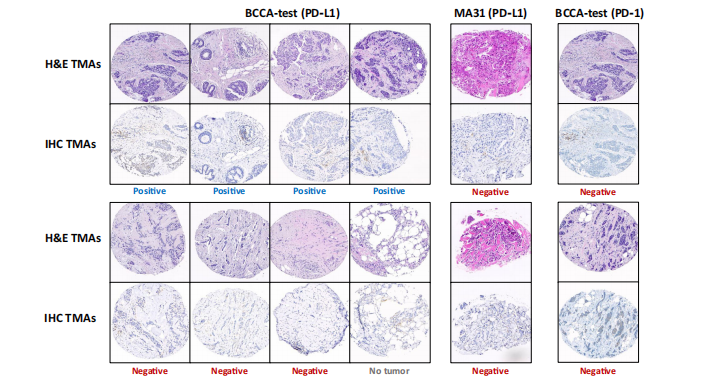
Fig. 4 | Low-prediction score cases classified positive. Tissue images of patients classified positive by the first pathologist and low-PS by the system. The BCCA-test patients are shown on the left (by PD-L1) and right (by PD-1), and the MA31 patients are shown in the middle (by PD-L1). For each patient, a representative H&E image and its corresponding IHC image are displayed one below the other. The classifi- cation of the second pathologist is registered below each sample, showing that most of the low-PS cases that were classified positive by the first pathologist were classified otherwise by the second one.
图4 | 被第一位病理学家分类为阳性的低预测分数病例。系统将其分类为低PS的患者的组织图像。左侧展示了BCCA测试患者(通过PD-L1)和右侧(通过PD-1),中间展示了MA31患者(通过PD-L1)。对于每位患者,展示了一个代表性的H&E图像及其相应的IHC图像,一个排在另一个下方。每个样本下方登记了第二位病理学家的分类,显示大多数被第一位病理学家分类为阳性的低PS病例被第二位病理学家分类为其他情况。
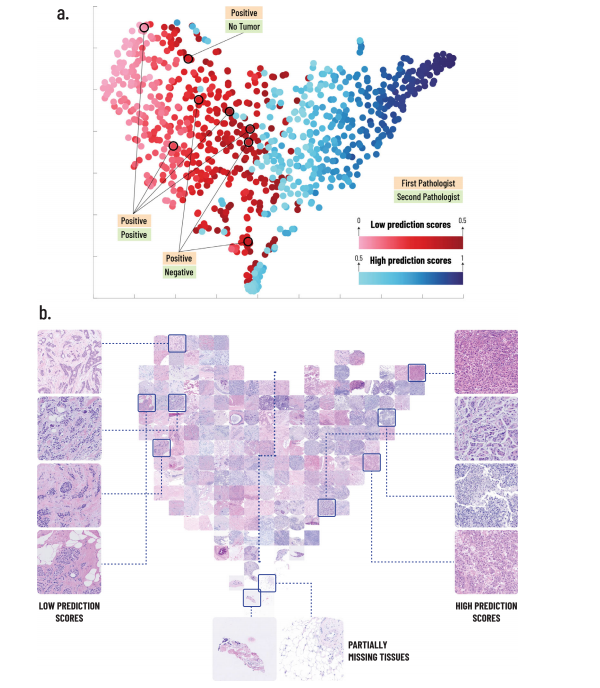
Fig. 5 | t-SNE embedding for visualization of feature space. a A 2D visualization of the image feature vectors by applying t-SNE. Each point represents a single patient in the BCCA test set. The t-SNE embedding maps patients with similar image fea tures to near points, and patients with dissimilar image features to far points. The points are colored by the PD-L1 prediction scores of their corresponding patients. The 8 patients that were classified positive by the first pathologist and low-PS by the system are marked and their classifications by both pathologists are noted. b The TMA images corresponding to the t-SNE embedding are presented. Several examples of low and high prediction score images are shown, to demonstrate the characteristics observed by the pathologists. Examples of partially missing tissues are shown at the bottom.
图5 | t-SNE嵌入以可视化特征空间。a 通过应用t-SNE,对图像特征向量进行了2D可视化。每个点代表BCCA测试集中的一个单独患者。t-SNE嵌入将具有相似图像特征的患者映射到近点,将具有不同图像特征的患者映射到远点。点按其对应患者的PD-L1预测分数进行着色。被第一位病理学家分类为阳性且系统分类为低PS的8位患者被标记出来,并记录了两位病理学家的分类。b 展示了与t-SNE嵌入对应的TMA图像。展示了几个低和高预测分数图像的示例,以展示病理学家观察到的特征。底部展示了部分缺失组织的示例。
Table
1
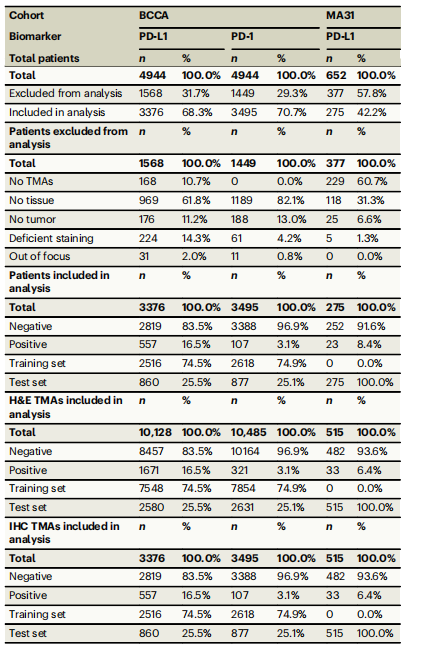
Table 1 | Patients and TMAs included and excluded in each data group
表1 | 每个数据组中包括和排除的患者及TMA
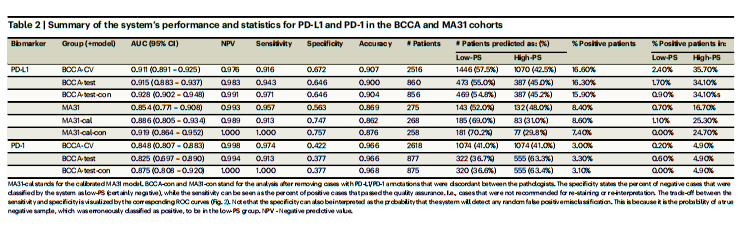
Table 2 | Summary of the system’s performance and statistics for PD-L1 and PD-1 in the BCCA and MA31 cohorts
表2 | 系统在BCCA和MA31队列中对PD-L1和PD-1性能和统计数据的总结
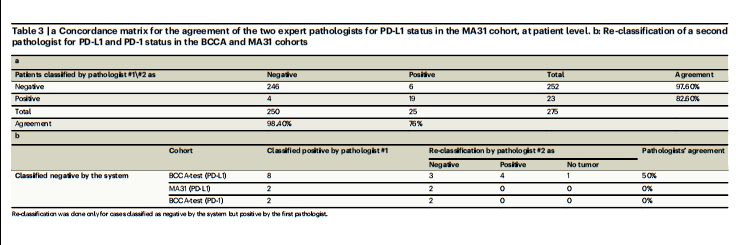
Table 3 | a Concordance matrix for the agreement of the two expert pathologists for PD-L1 status in the MA31 cohort, at patient level. b: Re-classification of a second pathologist for PD-L1 and PD-1 status in the BCCA and MA31 cohorts
表3 | a MA31队列中两位专家病理学家对PD-L1状态一致性的一致性矩阵,以患者为单位。b: 在BCCA和MA31队列中,第二位病理学家对PD-L1和PD-1状态的重新分类
这篇关于文献速递:深度学习乳腺癌诊断---基于深度学习的图像分析预测乳腺癌中HE染色组织病理学图像的PD-L1状态的文章就介绍到这儿,希望我们推荐的文章对编程师们有所帮助!


