本文主要是介绍iClient 对接矢量裁剪分析,希望对大家解决编程问题提供一定的参考价值,需要的开发者们随着小编来一起学习吧!
作者:XingJun在iServer提供的众多分布式分析服务功能之中,矢量裁剪分析服务可以以分布式分析的方式对服务上的数据集进行裁剪分析,用于裁剪的数据分为服务上的数据集和前端提供的几何对象(GeoJSON)格式,采用的空间查询模式: 内部裁剪(clip), 外部裁剪(intersect), 分析结果将以一幅rest地图形式返回,可用于前端显示。本文以SuperMap iClient JavaScript for Classic为例,介绍如何对接矢量裁剪分析服务。
开发准备
iClient通过iServer分布式分析服务实现矢量裁剪分析功能, 因此需要使用一下两款软件:
1. iServer,并开启分布式分析服务,具体步骤可参考:超图大数据环境搭建之操作系统搭建;
2. iClient for JavaScript,产品下载和文档可参考iClient产品官方网站。
iServer上的矢量裁剪分析服务
1. 首先进入iServer服务列表,打开分布式分析服务
iserver服务列表地址:http://[ip]:8090/iserver/services

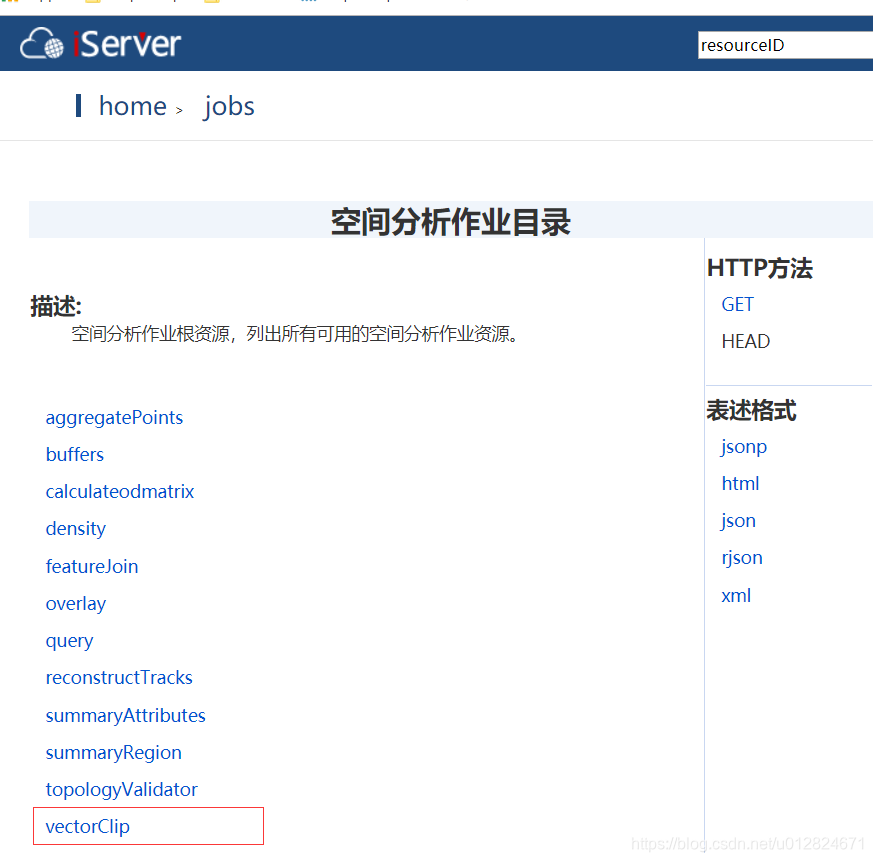
2. 打开分布式分析服务的空间分析业务
依次点击页面中的“distributeanalyst/rest” -> jobs -> spatialanalyst, 以下截图展示了所有支持的空间分析功能,
今天我们要使用的就是"vecorclip",即矢量裁剪分析服务。
3. 矢量裁剪分析页面
该页面将展示矢量裁剪分析任务执行情况,点击每一个分析任务链接,可以参考任务详情。

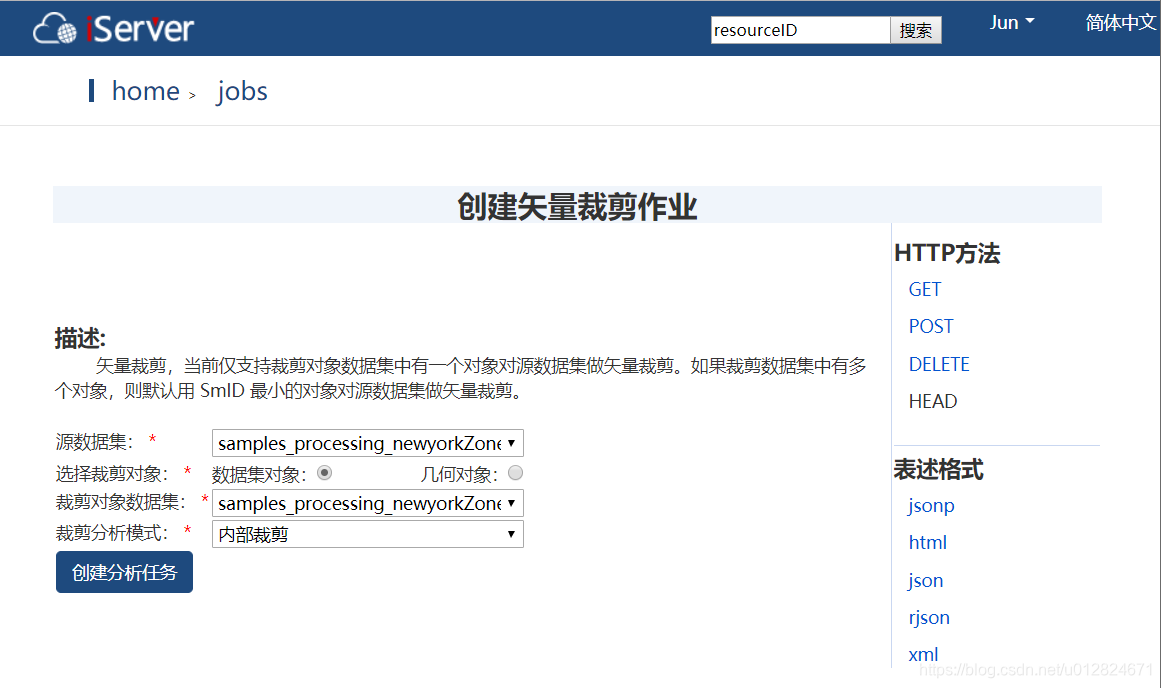
4. 创建矢量裁剪分析任务
点击上述页面中的“创建分析任务”,即可打开下图的页面,设置必要的参数后,点击页面下方的“创建分析任务”即可。
我们使用iClient请求矢量裁剪分析服务,也是会使用到页面中对应的参数。
iClient对接矢量裁剪分析服务
为了代码简洁,以及快速开发,我们应用iClient提供的在线js库。我们先创建一个"分布式分析-矢量裁剪分析.html"的文件,
然后按照以下步骤添加代码。
1. 引入iClient的js库
<script type="text/javascript" src="http://iclient.supermap.io/web/libs/iclient8c/libs/SuperMap.Include.js"></script>
<script type="text/javascript" src="http://iclient.supermap.io/dist/classic/iclient-classic.js"></script>
2. 显示一幅地图
首先添加一个用于显示地图的div元素:
<div id="map" style=" margin:0 auto; width: 100%; height:100%"></div>然后,script中创建Map,然后添加iServer中的地图
// 地图
var map = new SuperMap.Map("map", {controls: [new SuperMap.Control.Navigation(),new SuperMap.Control.Zoom(),new SuperMap.Control.LayerSwitcher()],allOverlays: true
});
// iServer服务地址(使用前,请修改服务地址)
var host = "http://10.10.1.113:8090";
// 地图图层
var mapURL = host + "/iserver/services/map-world/rest/maps/World";
var layer = new SuperMap.Layer.TiledDynamicRESTLayer("World", mapURL, null, {maxResolution: "auto"
});
layer.events.on({"layerInitialized": addLayer
});
// 添加地图图层,设置显示位置
function addLayer() {map.addLayers([layer]);map.setCenter(new SuperMap.LonLat(-73.95, 40.75), 10);
}3. 创建矢量裁剪分析任务
首先,添加一个按钮,点击按钮后开始分析,以对照分析前后地图的不同。
<button id="btn" onclick="analyze()">分析</button>其次,要使用分布式分析服务,首先要使用iClient注册,iServer中分布式分析服务使用的Token。
// 分布式分析服务地址
var processingsUrl = host + "/iserver/services/distributedanalyst/rest/v1/jobs";// iServer服务token, 必须有效, 可在iServer上生成
// 注册服务Token
var token = "SjuZkaDblGrM_2DRUyg31Qsi2EqGf9XwGAHAT6Hovq9NIeD6L7OzucvONHa5r2DFaGsrN-u2Ps1jmXCCQAW0rw..";
SuperMap.SecurityManager.registerToken(processingsUrl, token);
然后,构建矢量裁剪分析参数,根据两种裁剪数据类型,创建了两个查询参数singleObjectQueryJobsParameter1和singleObjectQueryJobsParameter2,分析是使用其一即可。
// 矢量裁剪分析参数1: 数据集裁剪
var vectorClipJobsParameter1 = new SuperMap.VectorClipJobsParameter({datasetName: "samples_processing_newyorkZone_R", // 源数据集,服务上被裁剪的数据集datasetVectorClip: "samples_processing_singleRegion_R", // 裁剪对象数据集mode: "clip" // 空间查询模式: clip, 内部裁剪; intersect, 外部裁剪
});// 矢量裁剪分析参数2: 几何对象裁剪
// 创建一个构建面对象的点串数组.可通过绘制对象得到,此处为代码简洁直接构建对象.
// 绘制对象的方法可参考在线范例:将查询对象模式改为GeoJSON, http://iclient.supermap.io/examples/classic/editor.html#vectorClipJobServicevar points = [{"x": -73.978577729654,"y": 40.759625483856},
{"x": -73.993314677351,"y": 40.742764291446},
{"x": -73.98136580084,"y": 40.725504803153},
{"x": -73.972868821988,"y": 40.721455461669},
{"x": -73.940208559526,"y": 40.724243532855},
{"x": -73.939411967759,"y": 40.743494500566},
{"x": -73.943992370421,"y": 40.759957397092},
{"x": -73.944058753068,"y": 40.760422075623},
{"x": -73.959193996648,"y": 40.761351432685},
{"x": -73.978577729654,"y": 40.759625483856}
];
var vectorClipJobsParameter2 = new SuperMap.VectorClipJobsParameter({datasetName: "samples_processing_newyorkZone_R", // 源数据集,服务上被裁剪的数据集geometryClip: points, // 裁剪对象点串数组mode: "clip" // 空间查询模式: clip, 内部裁剪; intersect, 外部裁剪
});
最后,创建矢量裁剪分析服务请求。
// 分布式分析
var processingService = new SuperMap.REST.ProcessingService(processingsUrl, {withCredentials: window.isLocal
});var resultLayer;// 开始分析
function analyze() {console.log("Analyzing....");if (map && resultLayer) {map.removeLayer(resultLayer);}// 矢量裁剪分析// 此处修改查询参数使用vectorClipJobsParameter1或vectorClipJobsParameter2processingService.addVectorClipJob(vectorClipJobsParameter1, function(serviceResult) {console.log("Finish....");if (serviceResult.error) {var errorMsg = serviceResult.error.errorMsg || "code: " + serviceResult.error.code;;console.log(errorMsg);return;}serviceResult.result.setting.serviceInfo.targetServiceInfos.map(function(info) {if (info.serviceType === 'RESTMAP') {SuperMap.FetchRequest.get(info.serviceAddress + '/maps').then(function(response) {return response.json();}).then(function(result) {var mapUrl = result[0].path;resultLayer = new SuperMap.Layer.TiledDynamicRESTLayer("resultLayer", mapUrl, {transparent: true});resultLayer.events.on({"layerInitialized": addLayer});function addLayer() {map.addLayer(resultLayer);}});}});});}
矢量裁剪分析结果
前面我们已经写好了“分布式分析_矢量裁剪分析.html”文件,现在就在浏览器打开它,如下图所示:

然后,点击“分析按钮”,等待分析结束,得到如下结果:

至此,iClient对接iServer矢量裁剪分析的功能就已介绍完毕,下面是完整的“分布式分析_矢量裁剪分析.html”文件内容,仅供参考:
<!DOCTYPE html>
<html><head><meta charset="utf-8"><title>分布式分析服务-矢量裁剪分析</title></head><body style=" margin: 0;width: 100%;height:100%;position: absolute;top: 0;"><button id="btn" onclick="analyze()">分析</button><div id="map" style=" margin:0 auto; width: 100%; height:100%"></div><script type="text/javascript" src="http://iclient.supermap.io/web/libs/iclient8c/libs/SuperMap.Include.js"></script><script type="text/javascript" src="http://iclient.supermap.io/dist/classic/iclient-classic.js"></script><script>// 创建一个矢量图层var style = {strokeColor: "#304DBE",strokeWidth: 2,pointerEvents: "visiblePainted",fillColor: "#304DBE",fillOpacity: 0.8};// 地图var map = new SuperMap.Map("map", {controls: [new SuperMap.Control.Navigation(),new SuperMap.Control.Zoom(),new SuperMap.Control.LayerSwitcher()],allOverlays: true});// iServer服务地址(使用前,请修改服务地址)var host = "http://10.10.1.113:8090";// 地图图层var mapURL = host + "/iserver/services/map-world/rest/maps/World";var layer = new SuperMap.Layer.TiledDynamicRESTLayer("World", mapURL, null, {maxResolution: "auto"});layer.events.on({"layerInitialized": addLayer});// 添加地图图层,设置显示位置function addLayer() {map.addLayers([layer]);map.setCenter(new SuperMap.LonLat(-73.95, 40.75), 9);}// 分布式分析服务地址var processingsUrl = host + "/iserver/services/distributedanalyst/rest/v1/jobs";// iServer服务token, 必须有效, 可在iServer上生成// 注册服务Tokenvar token = "SjuZkaDblGrM_2DRUyg31Qsi2EqGf9XwGAHAT6Hovq9NIeD6L7OzucvONHa5r2DFaGsrN-u2Ps1jmXCCQAW0rw..";SuperMap.SecurityManager.registerToken(processingsUrl, token);// 矢量裁剪分析参数1: 数据集裁剪var vectorClipJobsParameter1 = new SuperMap.VectorClipJobsParameter({datasetName: "samples_processing_newyorkZone_R", // 源数据集,服务上被裁剪的数据集datasetVectorClip: "samples_processing_singleRegion_R", // 裁剪对象数据集mode: "clip"           // 空间查询模式: clip, 内部裁剪; intersect, 外部裁剪});// 矢量裁剪分析参数2: 几何对象裁剪// 创建一个构建面对象的点串数组.可通过绘制对象得到,此处为代码简洁直接构建对象.// 绘制对象的方法可参考在线范例:将查询对象模式改为GeoJSON, http://iclient.supermap.io/examples/classic/editor.html#singleObjectQueryJobServicevar points = [{"x":-73.978577729654,"y":40.759625483856},{"x":-73.993314677351,"y":40.742764291446},{"x":-73.98136580084,"y":40.725504803153},{"x":-73.972868821988,"y":40.721455461669},{"x":-73.940208559526,"y":40.724243532855},{"x":-73.939411967759,"y":40.743494500566},{"x":-73.943992370421,"y":40.759957397092},{"x":-73.944058753068,"y":40.760422075623},{"x":-73.959193996648,"y":40.761351432685},{"x":-73.978577729654,"y":40.759625483856},];var vectorClipJobsParameter2 = new SuperMap.VectorClipJobsParameter({datasetName: "samples_processing_newyorkZone_R", // 源数据集,服务上被裁剪的数据集geometryClip: points,  // 裁剪对象点串数组mode: "clip"           // 空间查询模式: clip, 内部裁剪; intersect, 外部裁剪});// 分布式分析var processingService = new SuperMap.REST.ProcessingService(processingsUrl, {withCredentials: window.isLocal});var resultLayer;// 开始分析function analyze() {console.log("Analyzing....");if (map && resultLayer) {map.removeLayer(resultLayer);}// 矢量裁剪分析// 此处修改查询参数使用vectorClipJobsParameter1或vectorClipJobsParameter2processingService.addVectorClipJob(vectorClipJobsParameter1, function (serviceResult) {console.log("Finish....");if (serviceResult.error) {var errorMsg = serviceResult.error.errorMsg || "code: " + serviceResult.error.code;;console.log(errorMsg);return;}serviceResult.result.setting.serviceInfo.targetServiceInfos.map(function (info) {if (info.serviceType === 'RESTMAP') {SuperMap.FetchRequest.get(info.serviceAddress + '/maps').then(function (response) {return response.json();}).then(function (result) {var mapUrl = result[0].path;resultLayer = new SuperMap.Layer.TiledDynamicRESTLayer("resultLayer", mapUrl, {transparent: true});resultLayer.events.on({"layerInitialized": addLayer});function addLayer() {map.addLayer(resultLayer);}});}});});}</script></body>
</html>
更多内容可参考SuperMap iClient 在线示例:http://iclient.supermap.io/web/index.html。
这篇关于iClient 对接矢量裁剪分析的文章就介绍到这儿,希望我们推荐的文章对编程师们有所帮助!


