本文主要是介绍echarts 中 markLine垂直于X轴线, 折线图上新增区域块加颜色markarea,希望对大家解决编程问题提供一定的参考价值,需要的开发者们随着小编来一起学习吧!
一 效果图
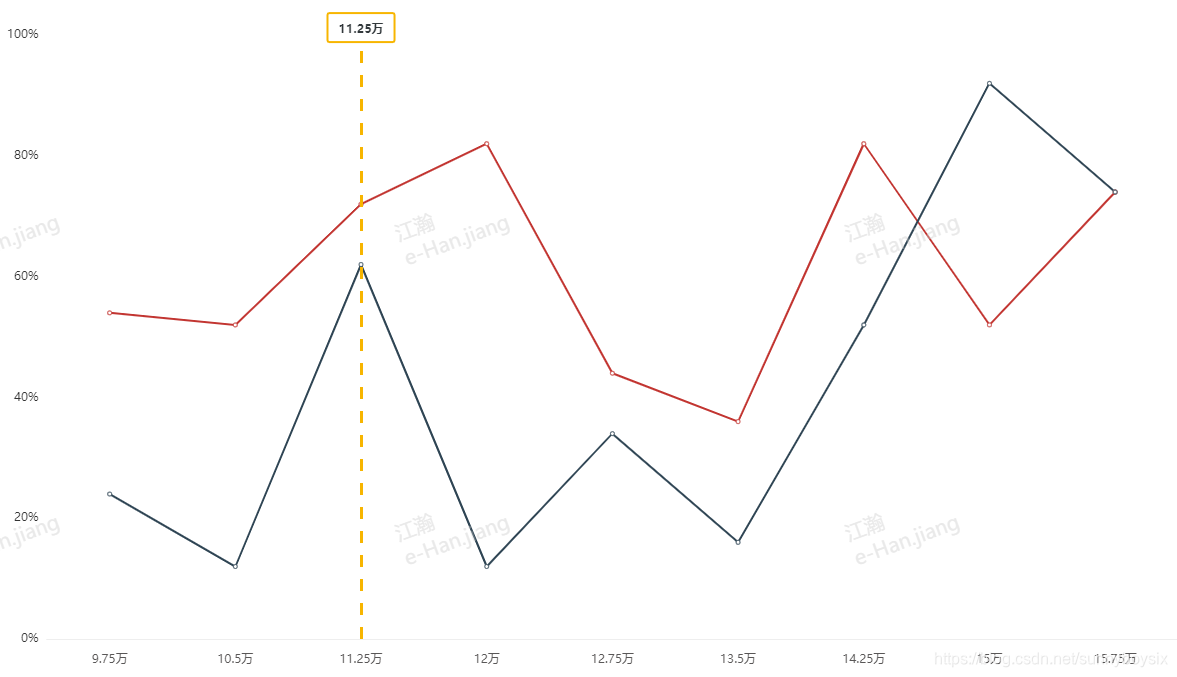

二 代码
{data: [0.54, 0.52, 0.72, 0.82, 0.44, 0.36, 0.82, 0.52, 0.74],type: 'line',markLine: {lineStyle: {width: 3,color: '#F7B500',},label: {show: true,position: 'end',formatter: '11.25万',color: '#32383B',height: 10,padding: [12, 12, 7, 12],lineHeight: 10,borderWidth: 2,borderColor: '#F7B500',borderRadius: 2,fontWeight: 550,fontFamily: 'HYQiHeiX1-GEW',},silent: true, // 鼠标悬停事件, true悬停不会出现实线symbol: 'none', // 去掉箭头data: [[{ coord: [2, 0] }, // [x第几个(从0开始),y轴起始点 ]{ coord: [2, 0.98] } // [x第几个(从0开始),y轴起始点 ]]]}},这里也可以用x轴的值, 但是要用string 如果你的x轴是number 改为string
data: [[{ coord: ['12', 0] }, // [x轴值,y轴起始点 ]{ coord: ['12', 0.98] } // [x轴值,y轴起始点 ]]]或者
将x轴type category改为value格式, 这样就可以直接传入一个任意一个值定位
如果是category 只能判断x轴上的点不能定位任意一个点的位置
xAxis: {type: 'value',axisLine: {show: true,lineStyle: {color: 'rgba(171, 170, 170, 0.2)'}},axisTick: { show: false },splitLine: { show: false },},如果是多条线传入的数据格式也要改变一下, data里面需要传入二维数组,可以map跑一下循环遍历就行了 类似散点图定位一样
let data = {markData: 10,data: [[[12, 0.23], [14, 0.45]],[[12, 0.23], [14, 0.45]],[[12, 0.23], [14, 0.45]]]}markarea
区域位置的话比较好加,两边如果需要虚线还是需要markline画
markArea: {itemStyle: {color: 'rgba(232, 241, 248, 1)',},data: [[{ xAxis: dt.leftLine},{ xAxis: dt.rightLine }]]}
多条轴线的数据 0 1代表是y轴高度 具体看你的y轴设置的参数
markLine: {silent: true, // 鼠标悬停事件, true悬停不会出现实线symbol: 'none', // 去掉箭头data: [[{ coord: [dt.markData, 0],label: {show: true,position: 'end',formatter: `优化价格:${dt.markData}${dt.unit ? dt.unit : ''}`,color: '#32383B',height: 10,padding: [12, 12, 7, 12],lineHeight: 10,borderWidth: 1,borderColor: '#F7B500',borderRadius: 2,fontWeight: 700,fontFamily: 'HYQiHeiX1-GEW',backgroundColor: 'white'}, lineStyle: {width: 1,color: '#F7B500',},}, // [x第几个(从0开始),y轴起始点 ]{ coord: [dt.markData, 0.8] }, // [x第几个(从0开始),y轴起始点 ]],[{ coord: [(dt.leftLine + dt.rightLine) / 2, 0],label: {show: true,position: 'end',formatter: `可接受价格区间:${dt.leftLine}-${dt.rightLine}万`,color: '#32383B',height: 10,padding: [12, 20, 7, 20],lineHeight: 10,borderWidth: 1,borderColor: '#0067B2',borderRadius: 2,fontWeight: 700,fontFamily: 'HYQiHeiX1-GEW',backgroundColor: 'white'}, lineStyle: {width: 0,color: '#F7B500',},}, // [x第几个(从0开始),y轴起始点 ]{ coord: [(dt.leftLine + dt.rightLine) / 2, 0.2] }, // [x第几个(从0开始),y轴起始点 ]],[{ coord: [dt.leftLine, 0], lineStyle: {width: 1,color: '#0067B2',},},{ coord: [dt.leftLine, 1]}],[{ coord: [dt.rightLine, 0],lineStyle: {width: 1,color: '#0067B2',},},{ coord: [dt.rightLine, 1]}]]},
加油加油
这篇关于echarts 中 markLine垂直于X轴线, 折线图上新增区域块加颜色markarea的文章就介绍到这儿,希望我们推荐的文章对编程师们有所帮助!


