本文主要是介绍vue3使用AntV G6 (图可视化引擎)历程[一],希望对大家解决编程问题提供一定的参考价值,需要的开发者们随着小编来一起学习吧!
前言:G6 是一个图可视化引擎。它提供了图的绘制、布局、分析、交互、动画等基础的图可视化能力。旨在让关系变得透明,简单。让用户获得关系数据的 Insight。
一、前期准备
官网地址:https://g6-next.antv.antgroup.com/manual/introduction
安装:
# 备注:目前最新版本是 4.x ,可以直接安装yarn add @antv/g6 或 npm install --save @antv/g6,如果指定最新版本,则如下安装
# 使用 npm 安装
npm install --save @antv/g6@5.0.0-beta.28# 使用 yarn 安装
yarn add @antv/g6@5.0.0# 本项目安装版本"@antv/g6": "^4.8.24",
引入:
import G6 from '@antv/g6'
二、基本树图绘制案例
1. 组件抽离【Topology.vue】
<template><div :id="domId" class="w-full h-[95%]"></div>
</template>
<script setup lang="ts">
import { initData } from '@/common/constants/topologyData/initRender'
import G6 from '@antv/g6'
import { nextTick, onMounted } from 'vue'const props = defineProps({domId: {type: String,default: 'container',},
})
const initRender = () => {const container = document.getElementById(props.domId)const width = container?.scrollWidthconst height = container?.scrollHeightconst graph = new G6.TreeGraph({container: props.domId,width,height,modes: {default: [{type: 'collapse-expand',onChange: function onChange(item, collapsed) {const data = item?.get('model')data.collapsed = collapsedreturn true},},'drag-canvas','zoom-canvas',],},defaultNode: {size: 26,anchorPoints: [[0, 0.5],[1, 0.5],],},defaultEdge: {type: 'cubic-horizontal',},layout: {type: 'dendrogram',direction: 'LR', // H / V / LR / RL / TB / BTnodeSep: 30,rankSep: 100,},})graph.node(function (node) {return {label: node.id,labelCfg: {position: node.children && node.children.length > 0 ? 'left' : 'right',offset: 5,},}})graph.data(initData)graph.render()graph.fitView()if (typeof window !== 'undefined')window.onresize = () => {if (!graph || graph.get('destroyed')) returnif (!container || !container.scrollWidth || !container.scrollHeight) returngraph.changeSize(container.scrollWidth, container.scrollHeight)}
}
onMounted(() => {nextTick(() => {initRender()})
})
</script>
2. 数据格式
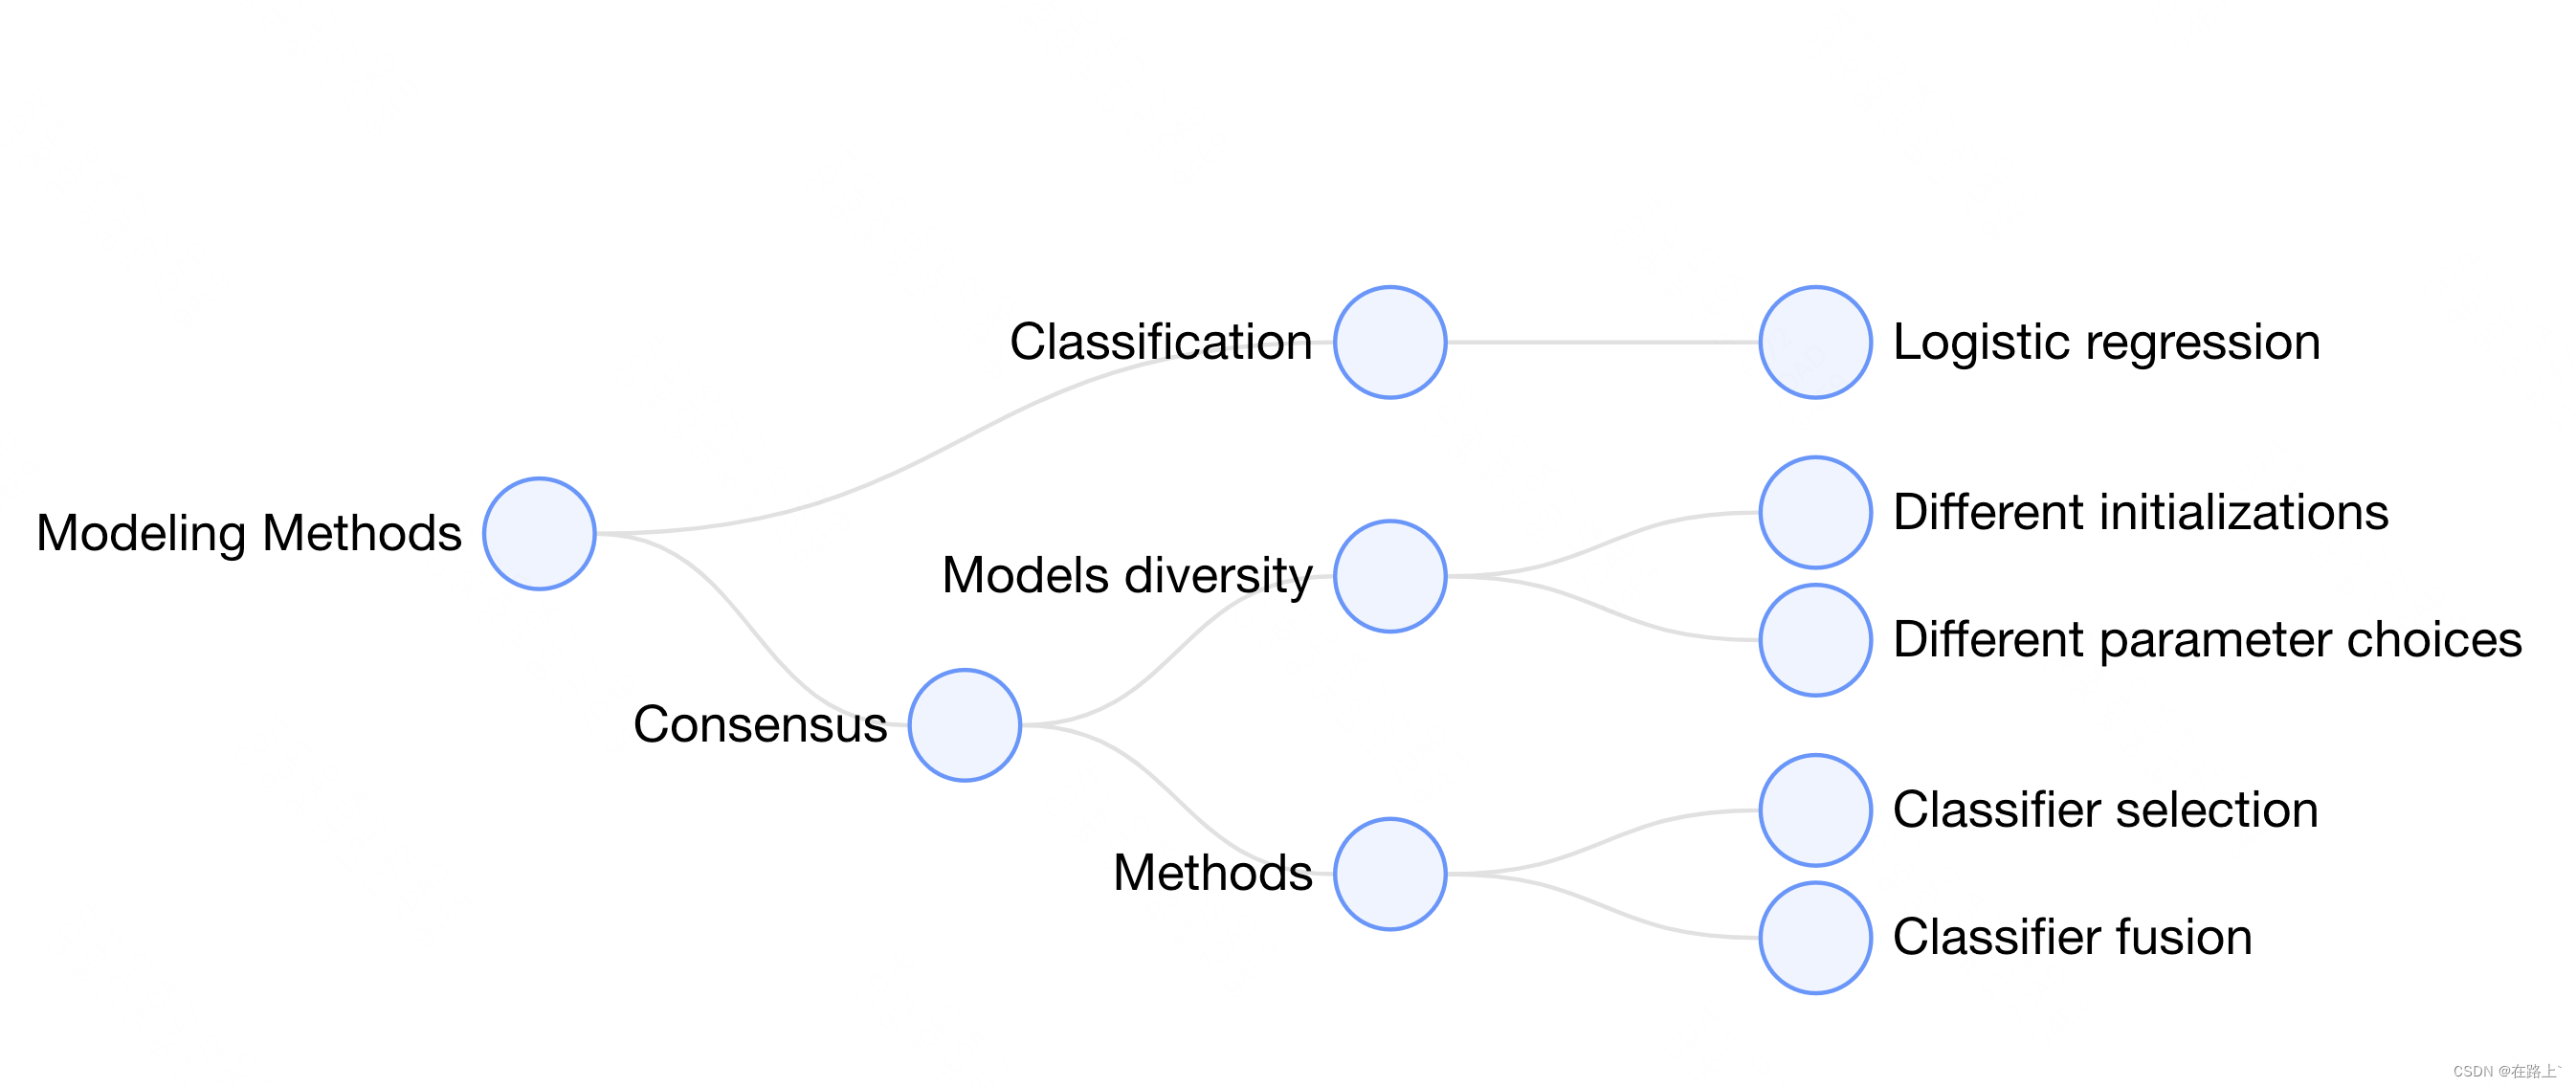
export const initData = {id: 'Modeling Methods',children: [{id: 'Classification',children: [{id: 'Logistic regression',},],},{id: 'Consensus',children: [{id: 'Models diversity',children: [{id: 'Different initializations',},{id: 'Different parameter choices',},],},{id: 'Methods',children: [{id: 'Classifier selection',},{id: 'Classifier fusion',},],},],},],
}
3.组件调用
<TopologyBase domId="featureTreeInfoContainer" />
4.案例效果
三、绘制过程及官网案例
1.创建容器
需要在 HTML 中创建一个用于容纳 G6 绘制的图的容器,通常为 div 标签。G6 在绘制时会在该容器下追加 canvas 标签,然后将图绘制在其中。
// 挂载节点
<template><div id="mountNode"></div>
</template>
2.数据准备
引入 G6 的数据源为 JSON 格式的对象。该对象中需要有节点(nodes)和边(edges)字段,分别用数组表示:
const data = {// 点集nodes: [{id: 'node1', // String,该节点存在则必须,节点的唯一标识x: 100, // Number,可选,节点位置的 x 值y: 200, // Number,可选,节点位置的 y 值},{id: 'node2', // String,该节点存在则必须,节点的唯一标识x: 300, // Number,可选,节点位置的 x 值y: 200, // Number,可选,节点位置的 y 值},],// 边集edges: [{source: 'node1', // String,必须,起始点 idtarget: 'node2', // String,必须,目标点 id},],
};
3.创建关系图
创建关系图(实例化)时,至少需要为图设置容器、宽和高。
const graph = new G6.Graph({container: 'mountNode', // String | HTMLElement,必须,在 Step 1 中创建的容器 id 或容器本身width: 800, // Number,必须,图的宽度height: 500, // Number,必须,图的高度
});
4.配置数据源,渲染
graph.data(data); // 读取 第2步 中的数据源到图上
graph.render(); // 渲染图
5. 最终结果
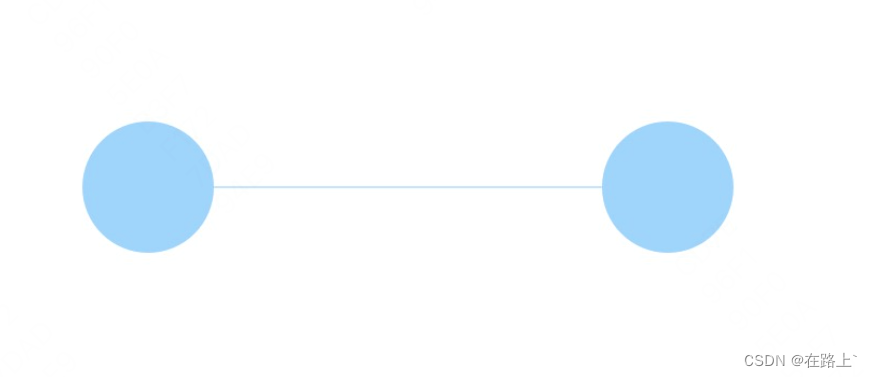
6. 完整代码
<!DOCTYPE html>
<html lang="en"><head><meta charset="UTF-8" /><title>Tutorial Demo</title></head><body>/* 图的画布容器 */<div id="mountNode"></div>/* 引入 G6 */<script src="https://gw.alipayobjects.com/os/antv/pkg/_antv.g6-3.7.1/dist/g6.min.js"></script><script>// 定义数据源const data = {// 点集nodes: [{id: 'node1',x: 100,y: 200,},{id: 'node2',x: 300,y: 200,},],// 边集edges: [// 表示一条从 node1 节点连接到 node2 节点的边{source: 'node1',target: 'node2',},],};// 创建 G6 图实例const graph = new G6.Graph({container: 'mountNode', // 指定图画布的容器 id,与第 9 行的容器对应// 画布宽高width: 800,height: 500,});// 读取数据graph.data(data);// 渲染图graph.render();</script></body>
</html>
这篇关于vue3使用AntV G6 (图可视化引擎)历程[一]的文章就介绍到这儿,希望我们推荐的文章对编程师们有所帮助!


