本文主要是介绍echarts自定义鼠标移上去显示,自定义图例,自定义x轴显示,希望对大家解决编程问题提供一定的参考价值,需要的开发者们随着小编来一起学习吧!
提示:记录一下echarts常用配置,以免后期忘记
1.自定义鼠标移上去效果
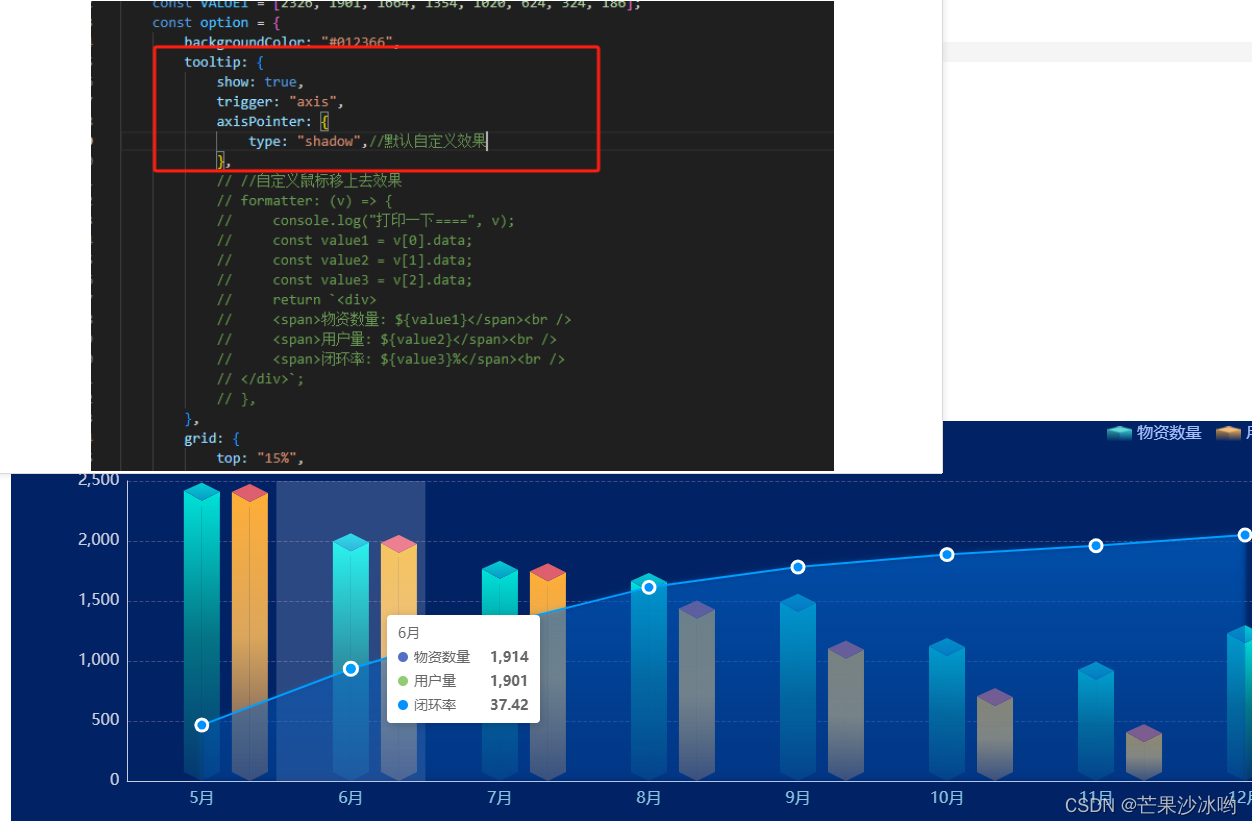
tooltip: {
show: true,
trigger: "axis",
axisPointer: {
type: "shadow",//默认自定义效果
},
// //自定义鼠标移上去效果
formatter: (v) => {
console.log("打印一下====", v);
const value1 = v[0].data;
const value2 = v[1].data;
const value3 = v[2].data;
return `<div>
<span>物资数量: ${value1}</span><br />
<span>用户量: ${value2}</span><br />
<span>闭环率: ${value3}%</span><br />
</div>`;
},
},
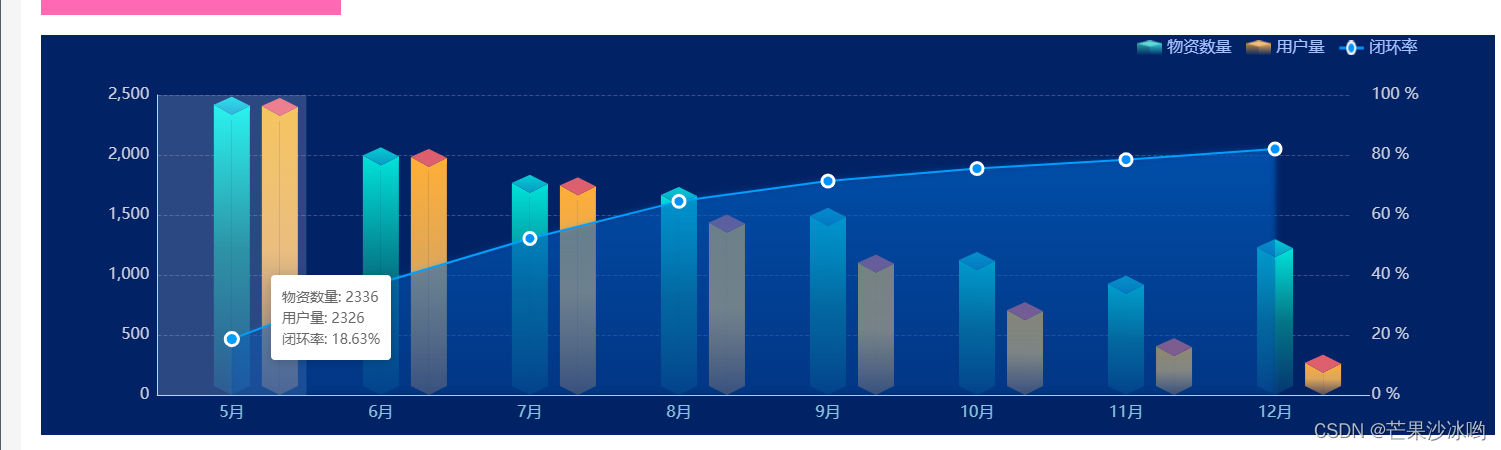
2.自定义图例
代码如下:
legend: {
textStyle: { fontSize: 16, color: "#fff" },
itemWidth: 25,
itemHeight: 15,
itemGap: 15,
right: "5%", //位置
selectedMode: false,
data: [
{
name: "物资数量",
//icon: "triangle", //官方默认的形状可选择 'circle', 'rect', 'roundRect', 'triangle', 'diamond', 'pin', 'arrow', 'none'
icon: `image://${tips2}`, //自定义图片图例
itemStyle: {
color: "#64D8D8",
},
textStyle: {
color: "#A9C0FF",
},
},
{
name: "用户量",
// icon: 'rect',
icon: `image://${tips3}`,
itemStyle: {
color: "#FFAE37",
},
textStyle: {
color: "#A9C0FF",
},
},
{
name: "闭环率",
// icon: 'rect',
icon: `image://${tips1}`,
itemStyle: {
color: "red",
},
textStyle: {
color: "#A9C0FF",
},
},
],
},
3.自定义X轴样式
xAxis: {
type: "category",
data: xData,
axisLine: {
show: true, // 显示/隐藏X轴轴线
lineStyle: {
color: "#CBCDDD", //x线距离
shadowColor: "#CBCDDD", //阴影颜色
shadowOffsetX: "20", //阴影水平方向上的偏移距离
},
},
splitLine: {
show: false,
},
axisTick: {
show: false, // 显示/隐藏X轴刻度
},
axisLabel: {
margin: 10, //距离x轴线的距离
fontSize: 16,
textStyle: {
color: "#89C3DD", //X轴文字颜色
},
},
},
4.Y轴数值刻度自定义
yAxis: {
type: 'value',
scale: true, //根据数据自适应最大值最小值
//min: 0,//设置最小值
// max: 100,//设置最大值
// interval: 20,//设置间隔
// nameTextStyle: {
// color: '#122167',
// fontSize: 12,
// }
},
5.监听屏幕大小变化 ,echarts适配
// echarts适配
const echartResize = () => {
chart.resize(); // 适配窗口大小
};
// 监听事件
window.addEventListener("resize", echartResize);
// 解绑事件
window.removeEventListener("resize", echartResize);
具体代码:
<template><div class="chart" id="Chart"></div>
</template><script setup>
import { onMounted, ref, reactive,onBeforeUnmount } from "vue";
import * as echarts from "echarts";
import tips1 from "@/assets/imgs/tips_line.png";
import tips2 from "@/assets/imgs/tips_green.png";
import tips3 from "@/assets/imgs/tips_orange.png";//定义一个全局echarts
let chart = ref(null);//生命周期
onMounted(() => {initCharts();
});
// echarts适配
const echartResize = () => {chart.resize(); // 适配窗口大小
};
const initCharts = () => {var chartDom = document.getElementById("Chart");chart = echarts.init(chartDom);// 绘制左侧面const CubeLeft = echarts.graphic.extendShape({shape: {x: 0,y: 0,},buildPath: function (ctx, shape) {// 会canvas的应该都能看得懂,shape是从custom传入的const xAxisPoint = shape.xAxisPoint;const c0 = [shape.x, shape.y];const c1 = [shape.x - 18, shape.y - 10];const c2 = [xAxisPoint[0] - 18, xAxisPoint[1] - 9];const c3 = [xAxisPoint[0], xAxisPoint[1]];ctx.moveTo(c0[0], c0[1]).lineTo(c1[0], c1[1]).lineTo(c2[0], c2[1]).lineTo(c3[0], c3[1]).closePath();},});// 绘制右侧面const CubeRight = echarts.graphic.extendShape({shape: {x: 0,y: 0,},buildPath: function (ctx, shape) {const xAxisPoint = shape.xAxisPoint;const c1 = [shape.x, shape.y];const c2 = [xAxisPoint[0], xAxisPoint[1]];const c3 = [xAxisPoint[0] + 18, xAxisPoint[1] - 9];const c4 = [shape.x + 18, shape.y - 9];ctx.moveTo(c1[0], c1[1]).lineTo(c2[0], c2[1]).lineTo(c3[0], c3[1]).lineTo(c4[0], c4[1]).closePath();},});// 绘制顶面const CubeTop = echarts.graphic.extendShape({shape: {x: 0,y: 0,},buildPath: function (ctx, shape) {const c1 = [shape.x, shape.y];const c2 = [shape.x + 18, shape.y - 9];const c3 = [shape.x, shape.y - 18];const c4 = [shape.x - 18, shape.y - 10];ctx.moveTo(c1[0], c1[1]).lineTo(c2[0], c2[1]).lineTo(c3[0], c3[1]).lineTo(c4[0], c4[1]).closePath();},});// 注册三个面图形echarts.graphic.registerShape("CubeLeft", CubeLeft);echarts.graphic.registerShape("CubeRight", CubeRight);echarts.graphic.registerShape("CubeTop", CubeTop);// 绘制左侧面const CubeLeft1 = echarts.graphic.extendShape({shape: {x: 0,y: 0,},buildPath: function (ctx, shape) {// 会canvas的应该都能看得懂,shape是从custom传入的const xAxisPoint = shape.xAxisPoint;const c0 = [shape.x, shape.y];const c1 = [shape.x + 30, shape.y - 10];const c2 = [xAxisPoint[0] + 30, xAxisPoint[1] - 9];const c3 = [xAxisPoint[0], xAxisPoint[1]];ctx.moveTo(c0[0] + 48, c0[1]).lineTo(c1[0], c1[1]).lineTo(c2[0], c2[1]).lineTo(c3[0] + 48, c3[1]).closePath();},});// 绘制右侧面const CubeRight1 = echarts.graphic.extendShape({shape: {x: 0,y: 0,},buildPath: function (ctx, shape) {const xAxisPoint = shape.xAxisPoint;const c1 = [shape.x, shape.y];const c2 = [xAxisPoint[0], xAxisPoint[1]];const c3 = [xAxisPoint[0] + 66, xAxisPoint[1] - 9];const c4 = [shape.x + 66, shape.y - 9];ctx.moveTo(c1[0] + 48, c1[1]).lineTo(c2[0] + 48, c2[1]).lineTo(c3[0], c3[1]).lineTo(c4[0], c4[1]).closePath();},});// 绘制顶面const CubeTop1 = echarts.graphic.extendShape({shape: {x: 0,y: 0,},buildPath: function (ctx, shape) {const c1 = [shape.x + 48, shape.y];const c2 = [shape.x + 66, shape.y - 9];const c3 = [shape.x + 48, shape.y - 18];const c4 = [shape.x + 30, shape.y - 10];ctx.moveTo(c1[0], c1[1]).lineTo(c2[0], c2[1]).lineTo(c3[0], c3[1]).lineTo(c4[0], c4[1]).closePath();},});// 注册三个面图形echarts.graphic.registerShape("CubeLeft1", CubeLeft1);echarts.graphic.registerShape("CubeRight1", CubeRight1);echarts.graphic.registerShape("CubeTop1", CubeTop1);const xData = ["5月", "6月", "7月", "8月", "9月", "10月", "11月", "12月"];const VALUE = [2336, 1914, 1685, 1584, 1410, 1042, 844, 1149];const VALUE1 = [2326, 1901, 1664, 1354, 1020, 624, 324, 186];const option = {backgroundColor: "#012366",tooltip: {show: true,trigger: "axis",axisPointer: {type: "shadow", //默认自定义效果},// //自定义鼠标移上去效果formatter: (v) => {console.log("打印一下====", v);const value1 = v[0].data;const value2 = v[1].data;const value3 = v[2].data;return `<div><span>物资数量: ${value1}</span><br /><span>用户量: ${value2}</span><br /><span>闭环率: ${value3}%</span><br /></div>`;},},grid: {top: "15%",bottom: "10%",left: "8%",right: "10%",containLabel: false, //true防止标签溢出  false依据坐标轴来对齐的,可能会有内容溢出},legend: {textStyle: { fontSize: 16, color: "#fff" },itemWidth: 25,itemHeight: 15,itemGap: 15,right: "5%", //位置selectedMode: false,data: [{name: "物资数量",//icon: "triangle", //官方默认的形状可选择  'circle', 'rect', 'roundRect', 'triangle', 'diamond', 'pin', 'arrow', 'none'icon: `image://${tips2}`, //自定义图片图例itemStyle: {color: "#64D8D8",},textStyle: {color: "#A9C0FF",},},{name: "用户量",// icon: 'rect',icon: `image://${tips3}`,itemStyle: {color: "#FFAE37",},textStyle: {color: "#A9C0FF",},},{name: "闭环率",// icon: 'rect',icon: `image://${tips1}`,itemStyle: {color: "red",},textStyle: {color: "#A9C0FF",},},],},xAxis: {type: "category",data: xData,axisLine: {show: true, // 显示/隐藏X轴轴线lineStyle: {color: "#CBCDDD", //x线距离shadowColor: "#CBCDDD", //阴影颜色shadowOffsetX: "20", //阴影水平方向上的偏移距离},},splitLine: {show: false,},axisTick: {show: false, // 显示/隐藏X轴刻度},axisLabel: {margin: 10, //距离x轴线的距离fontSize: 16,textStyle: {color: "#89C3DD", //X轴文字颜色},},},yAxis: [{type: "value",axisLine: {show: true,lineStyle: {color: "#CBCDDD",},},splitLine: {lineStyle: {color: "#414B82",type: "dashed", //虚线},show: true, // 显示/隐藏},axisTick: {show: false,},axisLabel: {fontSize: 16,},},{type: "value",nameTextStyle: {color: "#ebf8ac",},position: "right",splitLine: {show: false,},axisTick: {show: false,},axisLabel: {show: true,fontSize: 16,formatter: "{value} %", //右侧Y轴文字显示textStyle: {color: "#CBCDDD",},margin: 22, //刻度标签与轴线之间的距离。},boundaryGap: ["20%", "20%"],},],series: [{name: "物资数量",type: "custom",renderItem: (params, api) => {const location = api.coord([api.value(0), api.value(1)]);return {type: "group",children: [{type: "CubeLeft",shape: {api,xValue: api.value(0),yValue: api.value(1),x: location[0],y: location[1],xAxisPoint: api.coord([api.value(0), 0]),},style: {fill: new echarts.graphic.LinearGradient(0,0,0,1,[{offset: 0,color: "#00E2D9",// color: 'transparent',},{offset: 0.5,color: "#047586",// color: 'transparent',},{offset: 1,// color: '#49BEE5',// color: 'transparent',color: "#053671",},]),},},{type: "CubeRight",shape: {api,xValue: api.value(0),yValue: api.value(1),x: location[0],y: location[1],xAxisPoint: api.coord([api.value(0), 0]),},style: {fill: new echarts.graphic.LinearGradient(0,0,0,1,[{offset: 0,color: "#00E2D9",// color: 'transparent',},{offset: 0.5,color: "#047586",// color: 'transparent',},{offset: 1,// color: '#49BEE5',// color: 'transparent',color: "#053671",},]),},},{type: "CubeTop",shape: {api,xValue: api.value(0),yValue: api.value(1),x: location[0],y: location[1],xAxisPoint: api.coord([api.value(0), 0]),},style: {fill: new echarts.graphic.LinearGradient(0,0,0,1,[{offset: 0,color: "#04CDD3",},{offset: 1,color: "#0A99C5",},]),},},],};},data: VALUE,},{name: "用户量",type: "custom",renderItem: (params, api) => {const location = api.coord([api.value(0), api.value(1)]);return {type: "group",children: [{type: "CubeLeft1",shape: {api,xValue: api.value(0),yValue: api.value(1),x: location[0],y: location[1],xAxisPoint: api.coord([api.value(0), 0]),},style: {fill: new echarts.graphic.LinearGradient(0,0,0,1,[{offset: 0,color: "#FFAE37",// color: 'transparent',},{offset: 0.5,color: "#DBA65C",// color: 'transparent',},{offset: 1,// color: '#49BEE5',// color: 'transparent',color: "#584D5D",},]),},},{type: "CubeRight1",shape: {api,xValue: api.value(0),yValue: api.value(1),x: location[0],y: location[1],xAxisPoint: api.coord([api.value(0), 0]),},style: {fill: new echarts.graphic.LinearGradient(0,0,0,1,[{offset: 0,color: "#FFAE37",// color: 'transparent',},{offset: 0.5,color: "#DBA65C",// color: 'transparent',},{offset: 1,// color: '#49BEE5',// color: 'transparent',color: "#584D5D",},]),},},{type: "CubeTop1",shape: {api,xValue: api.value(0),yValue: api.value(1),x: location[0],y: location[1],xAxisPoint: api.coord([api.value(0), 0]),},style: {fill: new echarts.graphic.LinearGradient(0,0,0,1,[{offset: 0,color: "#DD5F6D",},{offset: 1,color: "#DE5F6E",},]),},},],};},data: VALUE1,},{name: "闭环率",type: "line",smooth: false, //是否平滑showAllSymbol: true,symbol: "circle",yAxisIndex: 1,symbolSize: 12,lineStyle: {normal: {color: "#0091FF",width: 2,},},zlevel: 1,label: {show: false,position: "top",textStyle: {color: "#6c50f3",},},itemStyle: {color: "#0091FF",borderColor: "#fff",borderWidth: 3,},areaStyle: {normal: {color: new echarts.graphic.LinearGradient(0,0,0,1,[{offset: 0,color: "rgba(2 ,68, 157,0.6)",},{offset: 1,color: "rgba(3 ,36 ,117,0.3)",},],false),shadowColor: "#0091FF", //折线图下的背景颜色shadowBlur: 6,},},data: ["18.63","37.42","52.19","64.55","71.3","75.47","78.44","82.01",],},],};option && chart.setOption(option);// 监听事件window.addEventListener("resize", echartResize);
};
//销毁
onBeforeUnmount(() => {// 解绑事件window.removeEventListener("resize", echartResize);
});
</script><style scoped>
.chart {width: 90%;height: 400px;margin-top: 20px;
}
</style>
这篇关于echarts自定义鼠标移上去显示,自定义图例,自定义x轴显示的文章就介绍到这儿,希望我们推荐的文章对编程师们有所帮助!


