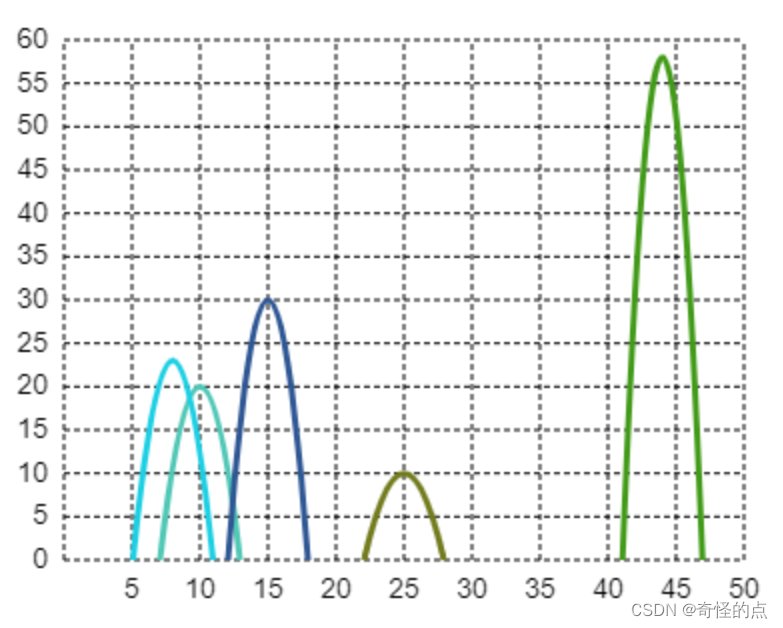
本文主要是介绍canvas 曲线图 双数值轴 山峰图,希望对大家解决编程问题提供一定的参考价值,需要的开发者们随着小编来一起学习吧!

下面的代码本人亲自撰写,原生不易啊。
<!DOCTYPE html>
<html lang="en"><head><meta charset="UTF-8"><meta name="viewport" content="width=device-width, initial-scale=1.0"><title>Document</title>
</head><body><canvas id="myCanvas" width="400" height="300"></canvas>
</body><script>class MyCanvas {static dom = null;static ctx = null;static canvasWidth = 0;static canvasHeight = 0;static config = null;static valx = 0;static valy = 0;static xlist = [];static ylist = [];static lenTrue = 0;init(dom) {MyCanvas.dom = domMyCanvas.ctx = MyCanvas.dom.getContext('2d');MyCanvas.canvasWidth = MyCanvas.ctx.canvas.width;MyCanvas.canvasHeight = MyCanvas.ctx.canvas.height;}// 配置参数setOption(config) {MyCanvas.ctx.clearRect(0, 0, MyCanvas.dom.width, MyCanvas.dom.height);MyCanvas.config = configMyCanvas.xlist = config.series.data.map(e => e[0]);MyCanvas.ylist = config.series.data.map(e => e[1]);MyCanvas.valx = MyCanvas.x1valjpx()MyCanvas.valy = MyCanvas.y1valjpx()MyCanvas.ctx.lineWidth = 1;MyCanvas.xGraduate()MyCanvas.xDashedLine()MyCanvas.yGraduate()MyCanvas.yDashedLine()MyCanvas.curve()}static getRandomColor() {let color = `hsl(${Random(0, 360)},${Random(50, 100)}%,${Random(20, 60)}%)`function Random(min, max) {return Math.round(Math.random() * (max - min)) + min;}return color}// 绘制曲线static curve() {const left = MyCanvas.config.grid.leftconst curvature = MyCanvas.config.series.curvature// xhb:曲线两个落点都是y轴最大的px值const xhb = MyCanvas.canvasHeight - 20MyCanvas.ctx.beginPath();MyCanvas.ctx.setLineDash([]);MyCanvas.ylist.forEach((e, i) => {MyCanvas.ctx.strokeStyle = MyCanvas.getRandomColor();MyCanvas.ctx.lineWidth = 3;// xy是控制点的xy坐标const x = MyCanvas.xlist[i] * MyCanvas.valx + leftconst y = e * MyCanvas.valy * 2const line = new Path2D();line.name = MyCanvas.config.series.data[i][2]line.moveTo(x - curvature, xhb);line.quadraticCurveTo(x, xhb - y, x + curvature, xhb);MyCanvas.ctx.stroke(line);MyCanvas.dom.addEventListener("mousemove", (event) => {const isPointInPath = MyCanvas.ctx.isPointInStroke(line, event.offsetX, event.offsetY);if (isPointInPath) {// 曲线被悬浮console.log(line);}});})}// 求x轴每一份值对应了多少实际px值static x1valjpx() {const max = Math.max(...MyCanvas.xlist)const interval = MyCanvas.config.xAxis.intervalconst curvature = MyCanvas.config.series.curvature// 总间隔数const len = Math.ceil(max / interval)// 总值数const valz = len * intervalconst left = MyCanvas.config.grid.leftconst right = MyCanvas.config.grid.rightconst xw = MyCanvas.canvasWidth - left - right// 求出每一份x值对应的图表里面的x轴px数值const valx = xw / valzconst maxql = max * valx + curvatureif (maxql > xw) {// 说明最大x将会超出可画范围,需要增加竖线let lenTrue = lenlet maxqlTrue = maxqllet valxTrue = valxwhile (maxqlTrue > xw) {lenTrue++// 总值数const valz = lenTrue * interval// 求出每一份x值对应的图表里面的y轴px数值valxTrue = xw / valzmaxqlTrue = max * valxTrue + curvature}MyCanvas.lenTrue = lenTruereturn valxTrue}return valx}// 求y轴每一份值对应了多少实际px值static y1valjpx() {const max = Math.max(...MyCanvas.ylist)const interval = MyCanvas.config.yAxis.intervalconst curvature = MyCanvas.config.series.curvature// 总间隔数const len = Math.ceil(max / interval)// 总值数const valz = len * intervalconst top = MyCanvas.config.grid.topconst bottom = MyCanvas.config.grid.bottomconst xh = MyCanvas.canvasHeight - top - bottom// 求出每一份y值对应的图表里面的y轴px数值return xh / valz}// 绘制x轴刻度值,从左到右画static xGraduate() {const grid = MyCanvas.config.gridconst xAxis = MyCanvas.config.xAxisconst gridLen = Object.keys(grid).lengthconst curvature = MyCanvas.config.series.curvatureMyCanvas.ctx.beginPath();MyCanvas.ctx.strokeStyle = '#000';MyCanvas.ctx.textAlign = "center";MyCanvas.ctx.textBaseline = "top";MyCanvas.ctx.font = "14px Arial";if (gridLen) {const left = MyCanvas.config.grid.leftconst right = MyCanvas.config.grid.rightconst top = MyCanvas.config.grid.topconst bottom = MyCanvas.config.grid.bottomconst interval = MyCanvas.config.xAxis.intervallet len = 0if (MyCanvas.lenTrue) {len = MyCanvas.lenTrue} else {const max = Math.max(...MyCanvas.lxList)len = Math.ceil(max / interval)}const xw = MyCanvas.canvasWidth - left - rightconst jg = xw / lenfor (let i = 0; i < len + 1; i++) {if (i) {MyCanvas.ctx.fillText(interval * i, left + (jg * i), MyCanvas.canvasHeight - bottom + xAxis.kdjl)}}}}// 绘制x刻度虚线,从右到左画static xDashedLine() {const grid = MyCanvas.config.gridconst gridLen = Object.keys(grid).lengthconst curvature = MyCanvas.config.series.curvatureMyCanvas.ctx.beginPath();MyCanvas.ctx.strokeStyle = MyCanvas.config.xAxis.dashedColor;MyCanvas.ctx.setLineDash([3, 2]);if (gridLen) {const left = MyCanvas.config.grid.leftconst right = MyCanvas.config.grid.rightconst top = MyCanvas.config.grid.topconst bottom = MyCanvas.config.grid.bottomconst interval = MyCanvas.config.xAxis.intervallet len = 0if (MyCanvas.lenTrue) {len = MyCanvas.lenTrue} else {const max = Math.max(...MyCanvas.lxList)len = Math.ceil(max / interval)}// x方向可画范围pxconst xw = MyCanvas.canvasWidth - left - rightconst jg = xw / lenfor (let i = 0; i < len + 1; i++) {MyCanvas.ctx.moveTo(MyCanvas.canvasWidth - right - (jg * i), MyCanvas.canvasHeight - bottom);MyCanvas.ctx.lineTo(MyCanvas.canvasWidth - right - (jg * i), top);}}MyCanvas.ctx.stroke();}// 绘制y刻度虚线,从下到上画static yDashedLine() {const grid = MyCanvas.config.gridconst gridLen = Object.keys(grid).lengthMyCanvas.ctx.beginPath();MyCanvas.ctx.strokeStyle = MyCanvas.config.yAxis.dashedColor;MyCanvas.ctx.setLineDash([3, 2]);if (gridLen) {const left = MyCanvas.config.grid.leftconst right = MyCanvas.config.grid.rightconst top = MyCanvas.config.grid.topconst bottom = MyCanvas.config.grid.bottomconst max = Math.max(...MyCanvas.ylist)const interval = MyCanvas.config.yAxis.intervalconst len = Math.ceil(max / interval)const xh = MyCanvas.canvasHeight - top - bottomconst jg = xh / lenfor (let i = 0; i < len + 1; i++) {MyCanvas.ctx.moveTo(left, MyCanvas.canvasHeight - bottom - (jg * i));MyCanvas.ctx.lineTo(MyCanvas.canvasWidth - right, MyCanvas.canvasHeight - bottom - (jg * i));}}MyCanvas.ctx.stroke();}// 绘制y刻度值,从下到上画static yGraduate() {const grid = MyCanvas.config.gridconst yAxis = MyCanvas.config.yAxisconst gridLen = Object.keys(grid).lengthMyCanvas.ctx.beginPath();MyCanvas.ctx.strokeStyle = '#000';MyCanvas.ctx.textAlign = "right";MyCanvas.ctx.textBaseline = "middle";MyCanvas.ctx.font = "14px Arial";if (gridLen) {const left = MyCanvas.config.grid.leftconst right = MyCanvas.config.grid.rightconst top = MyCanvas.config.grid.topconst bottom = MyCanvas.config.grid.bottomconst max = Math.max(...MyCanvas.ylist)const interval = MyCanvas.config.yAxis.intervalconst len = Math.ceil(max / interval)const xh = MyCanvas.canvasHeight - top - bottomconst jg = xh / lenfor (let i = 0; i < len + 1; i++) {if (i == 0) {MyCanvas.ctx.fillText(0, left - yAxis.kdjl, MyCanvas.canvasHeight - bottom)} else {MyCanvas.ctx.fillText(interval * i, left - yAxis.kdjl, MyCanvas.canvasHeight - bottom - (jg * i))}}}}}const myCanvas = document.querySelector('#myCanvas');const canvas = new MyCanvas()canvas.init(myCanvas)canvas.setOption({grid: {top: 20,right: 20,bottom: 20,left: 40,},yAxis: {dashedColor: '#000',kdjl: 8, // 刻度与轴线距离interval: 5, // 每条虚线间隔(单位不是px,而是数值,对应刻度值距离值)},xAxis: {dashedColor: '#000',kdjl: 8, // 刻度与轴线距离interval: 5, // 每条虚线间隔(单位不是px,而是数值,对应刻度值距离值)},series: {curvature: 20,// 曲线曲率单位pxdata: [[10, 20, '信号1'], [8, 23, '信号2'], [15, 30, '信号3'], [25, 10, '信号4'], [44, 58, '信号5']]}})
</script></html>
这篇关于canvas 曲线图 双数值轴 山峰图的文章就介绍到这儿,希望我们推荐的文章对编程师们有所帮助!


