本文主要是介绍在vue中使用OpenLayers地图 02 绘制点线面等图形,希望对大家解决编程问题提供一定的参考价值,需要的开发者们随着小编来一起学习吧!

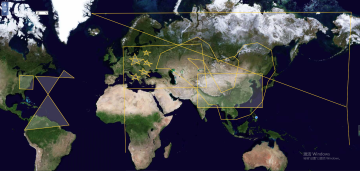
1. 先按照01中流程确定你已经创建出了一个能够正常展示的OL,有环境后可直接cv以下绘图操作 效果如下
- 实现效果:

- style样式部分
<!-- 绘制几何图形 --><div id="container"><!-- 绘制几何图形 --><div id="menu"><label>几何图形类型: </label><select id="type"><option value="None">无</option><option value="Point">点</option><option value="LineString">线</option><option value="Polygon">多边形</option><option value="Circle">圆</option><option value="Square">正方形</option><option value="Box">长方形</option></select></div></div></div>
- vue方法部分
<script>
import "ol/ol.css";
import ol from "openlayers";
export default {methods: {// 初始化地图initMap() {var map = new ol.Map({target: "container",layers: [new ol.layer.Tile({source: new ol.source.XYZ({url: "http://t0.tianditu.com/DataServer?T=img_w&x={x}&y={y}&l={z}&tk=0c37299462312e175cab9628d29c7563",}),visible: true,}),],view: new ol.View({center: [0, 0],zoom: 3,}),});var typeSelect = document.getElementById("type"); //绘制类型选择对象var draw; //ol.Interaction.Draw类的对象//实例化一个矢量图层Vector作为绘制层var source = new ol.source.Vector();var vectorLayer = new ol.layer.Vector({source: source,style: new ol.style.Style({fill: new ol.style.Fill({//填充样式color: "rgba(255, 255, 255, 0.2",}),stroke: new ol.style.Stroke({//线样式color: "#ffcc33",width: 2,}),image: new ol.style.Circle({//点样式radius: 7,fill: new ol.style.Fill({color: "#ffcc33",}),}),}),});//将绘制层添加到地图容器中map.addLayer(vectorLayer);//用户更改绘制类型触发的事件typeSelect.onchange = function (e) {map.removeInteraction(draw); //移除绘制图形控件addInteraction(); //添加绘制图形控件};function addInteraction() {var typeValue = typeSelect.value; //绘制类型if (typeValue !== "None") {var geometryFunction, maxPoints;if (typeValue === "Square") {//正方形typeValue = "Circle"; //设置绘制类型为Circle//设置几何信息变更函数,即创建正方形geometryFunction = ol.interaction.Draw.createRegularPolygon(4);} else if (typeValue === "Box") {//长方形typeValue = "LineString"; //设置绘制类型为LineStringmaxPoints = 2; //设置最大点数为2//设置几何信息变更函数,即设置长方形的坐标点geometryFunction = function (coordinates, geometry) {if (!geometry) {geometry = new ol.geom.Polygon(null); //多边形}var start = coordinates[0];var end = coordinates[1];geometry.setCoordinates([[start, [start[0], end[1]], end, [end[0], start[1]], start],]);return geometry;};}console.log(typeValue);//实例化图形绘制控件对象并添加到地图容器中draw = new ol.interaction.Draw({source: source,type: typeValue, //几何图形类型geometryFunction: geometryFunction, //几何信息变更时的回调函数maxPoints: maxPoints, //最大点数});map.addInteraction(draw);} else {//清空绘制的图形source.clear();}}},// 列表模式的路由跳转gotoMenu() {this.$router.replace("/screenage/Fenbianlv");},},mounted() {this.initMap();},
};
</script>
这篇关于在vue中使用OpenLayers地图 02 绘制点线面等图形的文章就介绍到这儿,希望我们推荐的文章对编程师们有所帮助!


