本文主要是介绍vue echarts引入中国地图使用散点地图,希望对大家解决编程问题提供一定的参考价值,需要的开发者们随着小编来一起学习吧!
要使用4.1.0版本的echarts!!! 否则报Map china not exists. The GeoJSON of the map must be provided
安装:
npm install echarts@4.1.0 --save
引入:
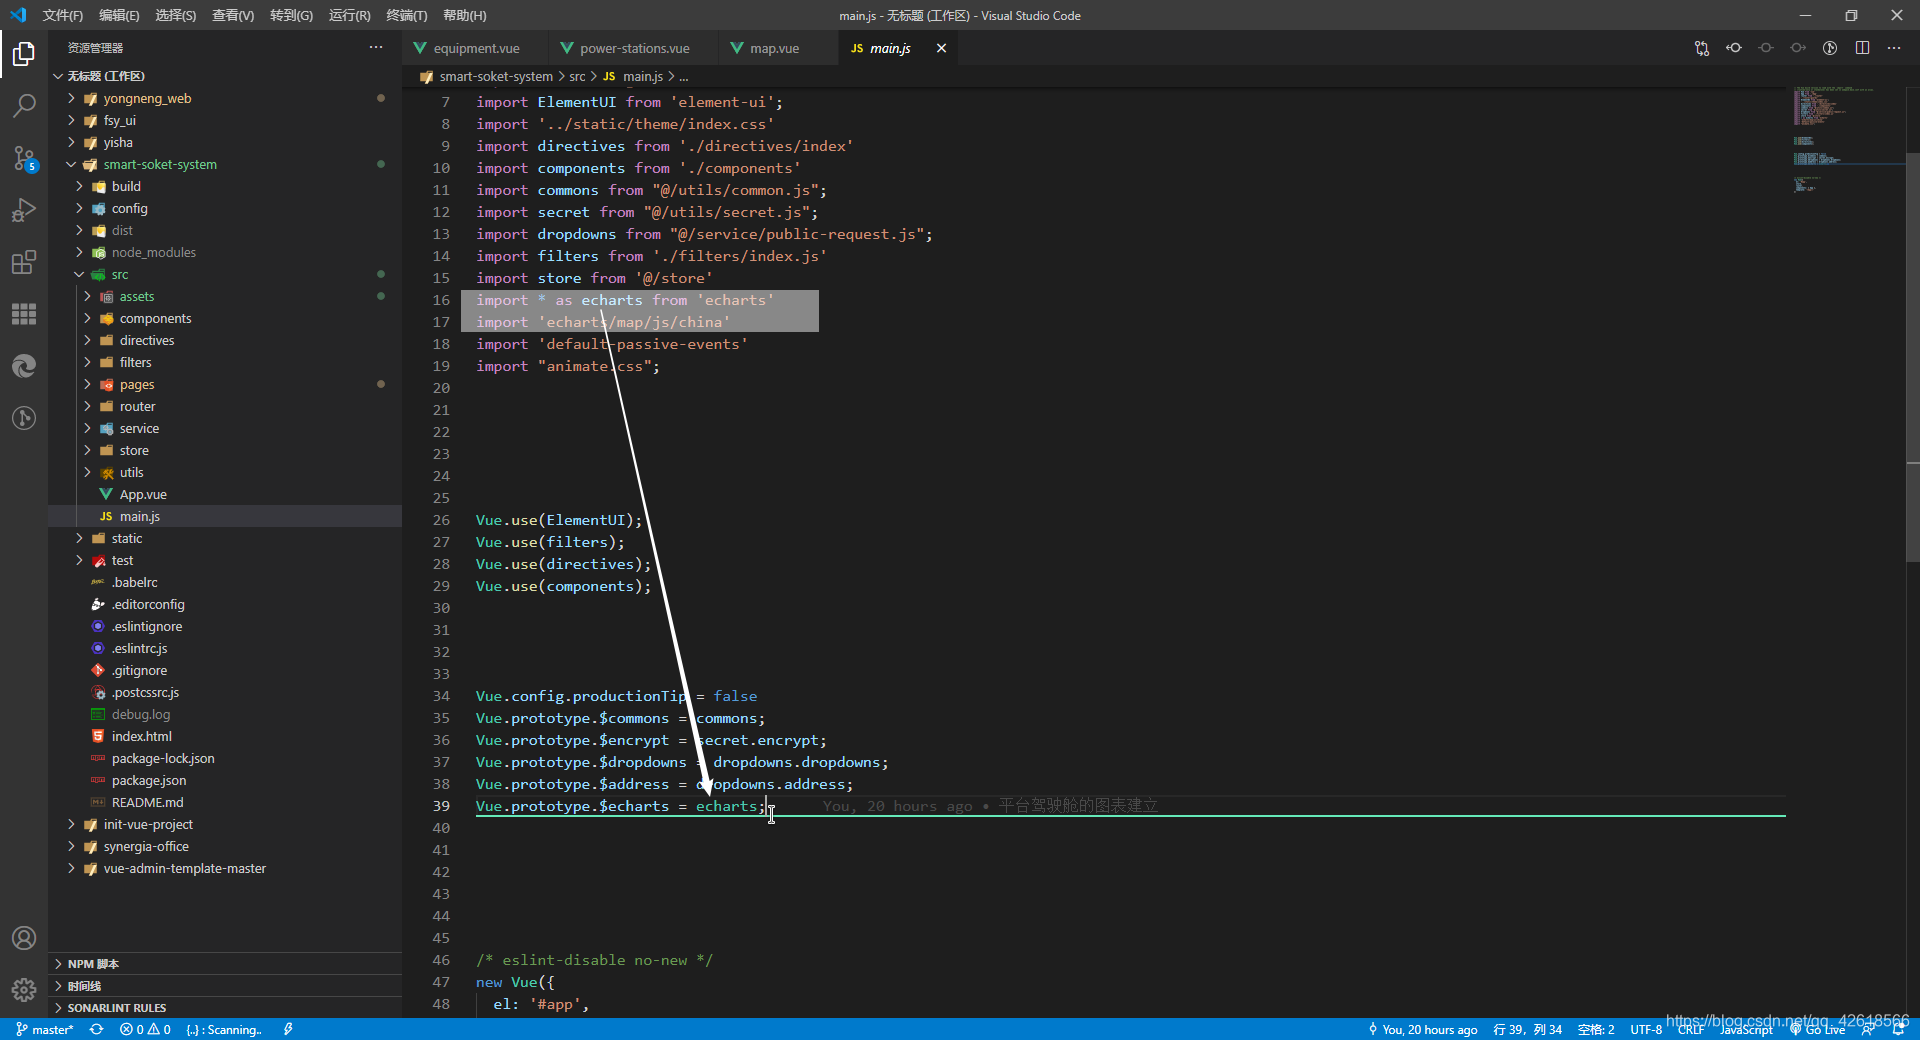
import * as echarts from 'echarts'
import 'echarts/map/js/china'Vue.prototype.$echarts = echarts;

使用:
<template><div ref="chart" class="mapChart" style="width: 100%; height: 75vh"></div>
</template><script>
export default {name: "mapChina",data() {return {cityData: [],regions: [{name: "南海诸岛",itemStyle: {areaColor: "#6F798D",opacity: 0.65,},},{name: "北京",itemStyle: {areaColor: "#034DE4",opacity: 0.65,},},{name: "天津",itemStyle: {areaColor: "#034DE4",opacity: 0.65,},},{name: "上海",itemStyle: {areaColor: "#27E9FD",opacity: 0.65,},},{name: "重庆",itemStyle: {areaColor: "#0E7DEB",opacity: 0.65,},},{name: "河北",itemStyle: {areaColor: "#034DE4",opacity: 0.65,},},{name: "河南",itemStyle: {areaColor: "#034DE4",opacity: 0.65,},},{name: "云南",itemStyle: {areaColor: "#20CAF8",opacity: 0.65,},},{name: "辽宁",itemStyle: {areaColor: "#034DE4",opacity: 0.65,},},{name: "黑龙江",itemStyle: {areaColor: "#17A3F1",opacity: 0.65,},},{name: "湖南",itemStyle: {areaColor: "#0554E4",opacity: 0.65,},},{name: "安徽",itemStyle: {areaColor: "#27E8FD",opacity: 0.65,},},{name: "山东",itemStyle: {areaColor: "#4BFFFF",opacity: 0.65,},},{name: "新疆",itemStyle: {areaColor: "#17A3F1",opacity: 0.65,},},{name: "江苏",itemStyle: {areaColor: "#00b6f6",opacity: 0.65,},},{name: "浙江",itemStyle: {areaColor: "#00b6f6",opacity: 0.65,},},{name: "江西",itemStyle: {areaColor: "#01a4f1",opacity: 0.65,},},{name: "湖北",itemStyle: {areaColor: "#005ce5",opacity: 0.65,},},{name: "广西",itemStyle: {areaColor: "#0088ec",opacity: 0.65,},},{name: "甘肃",itemStyle: {areaColor: "#0042df",opacity: 0.65,},},{name: "山西",itemStyle: {areaColor: "#01d0fa",opacity: 0.65,},},{name: "内蒙古",itemStyle: {areaColor: "#00ccf7",opacity: 0.65,},},{name: "陕西",itemStyle: {areaColor: "#01b0f3",opacity: 0.65,},},{name: "吉林",itemStyle: {areaColor: "#0051e1",opacity: 0.65,},},{name: "福建",itemStyle: {areaColor: "#0158e3",opacity: 0.65,},},{name: "贵州",itemStyle: {areaColor: "#0199ef",opacity: 0.65,},},{name: "广东",itemStyle: {areaColor: "#00d9fc",opacity: 0.65,},},{name: "青海",itemStyle: {areaColor: "#005ae4",opacity: 0.65,},},{name: "西藏",itemStyle: {areaColor: "#01e9fd",opacity: 0.65,},},{name: "四川",itemStyle: {areaColor: "#0069e8",opacity: 0.65,},},{name: "宁夏",itemStyle: {areaColor: "#01b0f3",opacity: 0.65,},},{name: "海南",itemStyle: {areaColor: "#00f0ff",opacity: 0.65,},},{name: "台湾",itemStyle: {areaColor: "#0067e7",opacity: 0.65,},},{name: "香港",itemStyle: {areaColor: "#00dafa",opacity: 0.65,},},{name: "澳门",itemStyle: {areaColor: "#00dafa",opacity: 0.65,},},],};},created() {this.getData();},methods: {getData() {// api.stationCovers().then((res) => {//   console.log(res);// if (res === 0) {// 假设接口返回的散点的数据this.cityData = [{ name: "海门", value: 9, location: [121.15, 31.89] },{ name: "鄂尔多斯", value: 12, location: [109.781327, 39.608266] },{ name: "招远", value: 12, location: [120.38, 37.35] },{ name: "舟山", value: 12, location: [122.207216, 29.985295] },{ name: "齐齐哈尔", value: 14, location: [123.97, 47.33] },{ name: "盐城", value: 15, location: [120.13, 33.38] },{ name: "赤峰", value: 16, location: [118.87, 42.28] },{ name: "青岛", value: 18, location: [120.33, 36.07] },{ name: "乳山", value: 18, location: [121.52, 36.89] },{ name: "金昌", value: 19, location: [102.188043, 38.520089] },{ name: "泉州", value: 21, location: [118.58, 24.93] },{ name: "莱西", value: 21, location: [120.53, 36.86] },{ name: "日照", value: 21, location: [119.46, 35.42] },{ name: "胶南", value: 22, location: [119.97, 35.88] },{ name: "南通", value: 23, location: [121.05, 32.08] },{ name: "拉萨", value: 24, location: [91.11, 29.97] },{ name: "云浮", value: 24, location: [112.02, 22.93] },{ name: "梅州", value: 25, location: [116.1, 24.55] },{ name: "文登", value: 25, location: [122.05, 37.2] },{ name: "上海", value: 25, location: [121.48, 31.22] },];this.$nextTick(() => {this.$echarts.init(this.$refs.chart).setOption({tooltip: {trigger: "item",},geo: {map: "china",show: true,roam: true, //拖拽和伸缩label: {emphasis: {show: false,},},itemStyle: {/*  normal: {//地图背景色areaColor: "#034DE4",opacity: 0.65,}, */emphasis: {//鼠标放上去区域背景色areaColor: "#034DE4",opacity: 0.7,},},regions: this.regions, // 给每个省份的区域加上背景色},series: {// name: "电站投放地",type: "effectScatter",coordinateSystem: "geo",data: this.convertData(this.cityData),symbolSize: function (val) {//设置散点大小return val[2] / (val[2] / 10);},showEffectOn: "render", //配置何时显示特效。可选:'render' 绘制完成后显示特效rippleEffect: {//涟漪特效相关配置brushType: "stroke", //波纹的绘制方式,可选 'stroke' 和 'fill'},hoverAnimation: true, //是否开启鼠标 hover 的提示动画效果label: {//图形上的文本标签,可用于说明图形的一些数据信息,比如值,名称等,normal: {formatter: "{b}",position: "right",show: false,},},itemStyle: {//图形样式,normal 是图形在默认状态下的样式;emphasis 是图形在高亮状态下的样式,比如在鼠标悬浮或者图例联动高亮时normal: {color: "#0bfb50", //散点的颜色shadowBlur: 10,shadowColor: 20,fontSize: "12px",},},zlevel: 1,},});});// }// });},// 数据处理convertData(data) {var res = [];for (var i = 0; i < data.length; i++) {let geoCoord = data[i].location;if (geoCoord) {res.push({name: data[i].name,value: geoCoord.concat(data[i].value),});}}return res;},},
};
</script>
<style lang="less" scoped>
</style>
效果:

但是现在也有个遗留问题,缩放或拖动地图时,会报Unable to preventDefault inside passive event listener invocation. ,如您遇到解决办法,请指教
特别感谢:https://www.cnblogs.com/zzwlong/p/13597211.html
这篇关于vue echarts引入中国地图使用散点地图的文章就介绍到这儿,希望我们推荐的文章对编程师们有所帮助!


