鲁棒性很好的可变剪切探测
北卡2016年1月发表在Nucleic Acids Research上的一篇Methodology
当然主要是为了介绍他们的SingleSplice 软件,python脚本实现。但是we should focus on its specific strategies to solve transcripts finding and quantificating issues
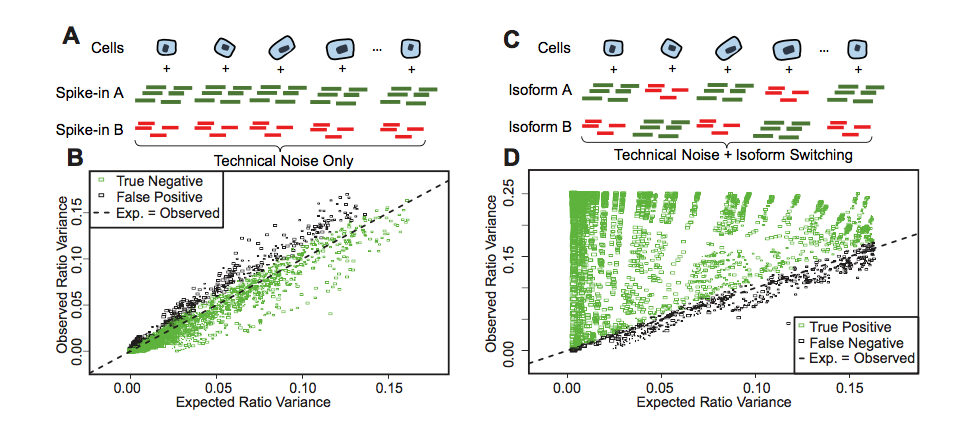
The SingleSplice method consists of three main phases(文章就说主要思路分三步走). In the first phase, we compute expression levels for the longest pieces of transcripts (通过DIFsplice方法,把scRNAseq下来的短reads去计算最长转录本的丰度)that can be unambiguously identified using short reads. We accomplish this using the DiffSplice method(也是上博提到的扩散方法中的一个分支). Briefly, we construct a directed, acyclic splice graph(DAG,有向无环图,非常非常重要的概念,而这里是直接从比对上的reads产生的有向无环剪切图) directly from read alignments so that possible transcripts correspond to paths through the graph. Using this splice graph, we identify single-entry, single-exit modules in the graph (Figure 1A). These single-entry, single-exit portions of the graph are called alternative splicing modules (ASMs), and each path through an ASM corresponds to a piece of one or more transcripts spanning two or more exons; there may be one or more ASMs per gene. ASMs possess the important property that any alternative splicing a gene undergoes will cause a change in the ratio of at least one pair of ASM paths.
解释再多还是不如一张图好使,如下
任何一个path就是一个转录本可能存在的有向的剪切事件,因为是从5‘到3’所以是directional的一个path,一个ASM里面可能有1个甚至更多个的ASMs path,所以可以用这个AGM graph很好的描述我们sc RNASeq数据中各个时期各个细胞不同水平的AS事件的发生频数,之后再用ratio来衡量AS的差异among different cells
The second phase of SingleSplice fits distributions describing the expected expression variation(每条path in ASM中因为技术噪声产生的变异的期望表达情况) of each ASM path due to technical noise In the third phase, to determine whether a gene shows significant splicing changes across a set of cells, we sample values from the fitted noise model of each ASM path to predict the variance of isoform ratios due to technical noise alone, then use these predicted values to assess the significance of the observed variation in isoform ratio (Figure 1C). Intuitively, performing this sampling procedure (a statistical technique known as parametric bootstrapping参数枚举或者参数自举法,重要而基础的参数估计概念) is like sequencing the same set of cells repeatedly to see how the isoform usage changes from technical variation alone.
parametric bootstrapping之后只有系统噪音的observed variation in isoform ratio,以及有isoform变异的observed variation in isoform ratio
Then comes to the specific steps:
首先对转录本丰度matrix做normalized:
纠正了细胞程长度以及分子表达量的转录本覆盖率
再用mixed model to predict technical variants:
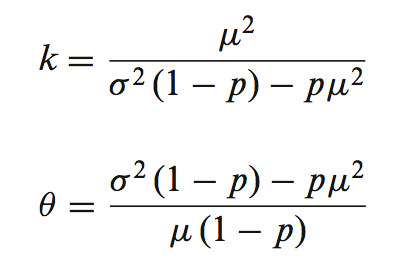
其中p=dropout probability,来自于逻辑回归的参数估计,转录本表达的分布模型用gamma分布来进行参数估计
而gamma分布的参数,k以及塞塔:可以直接来自转录本表达值的均数和方差:

在计算好系统变异方程之后,我们可以对cell size对表达水平的影响做均一化处理了:
首先得到一个叫做scaler factor的因子:

and using it in the following equation:

which yielding a quantity similar to reads per kilobase length per million reads (RPKM),and then multiply by the Si
至此,我们均一化之后的转录本覆盖度已经没有cell size effect了
接着,作者继续论证:
Detecting biological variation in isoform usage
也就是用isoform使用你path多少的比例来算出ratio:这一步就是parameters boosting的运用项
首先定义在含n个细胞的set 中,两个转录本A、B在不同平均表达水平下u1、u2的表达水平: 

Then, for each of the 1000 sets of n values, we compute the sample variance of the isoform proportions:
之后对1000个这样的cell set 做isoform丰度的样本之间的变异量统计:
公式如下:

r是 isoform proportion的一个经验分布(可以用我们在测序结果中直接观测到的isoform分布作为r)
上述公式其实就是一个自参数的迭代过程,算法有点像2个均数的方差计算方法,不过这里不是方差而是平方差。ri随着i=1to1000,不停变化。S^2,here。就是零假设(只有系统噪声的isoform丰度)的经验p值,作为一个是否有isoform variants影响的一个threshold。因为S^2是单单只有系统噪声的p-value。(自举参数估计的思想核心应用,repeatly count)
RESULTS
SingleSplice accurately predicts behavior of spike-in transcripts
本篇重点:DAG:有向无环图for the path(ASMs)finding、Parameters Boosting:参数自举法估计单纯系统噪声的Pvalue


