本文主要是介绍使用Mathematica动态绘制参数方程(Manipulate, ParametricPlot),希望对大家解决编程问题提供一定的参考价值,需要的开发者们随着小编来一起学习吧!
最近才明白一个道理,原来很多复杂的图形,没办法用函数来表示(因为函数要求每个自变量x只能对应唯一的因变量y)。复杂的图形,可用参数方程来表示。
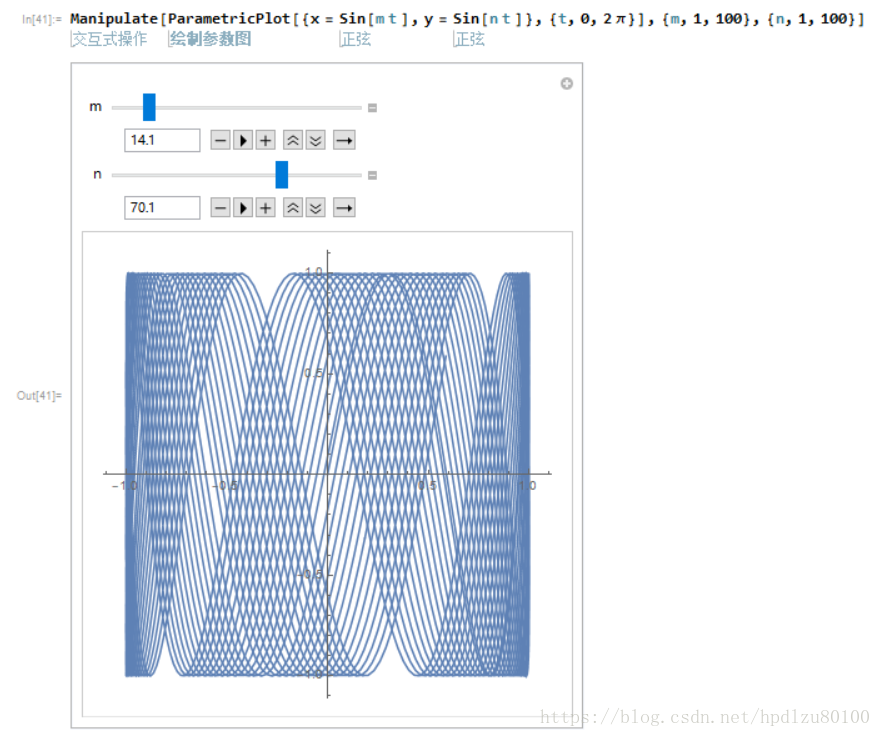
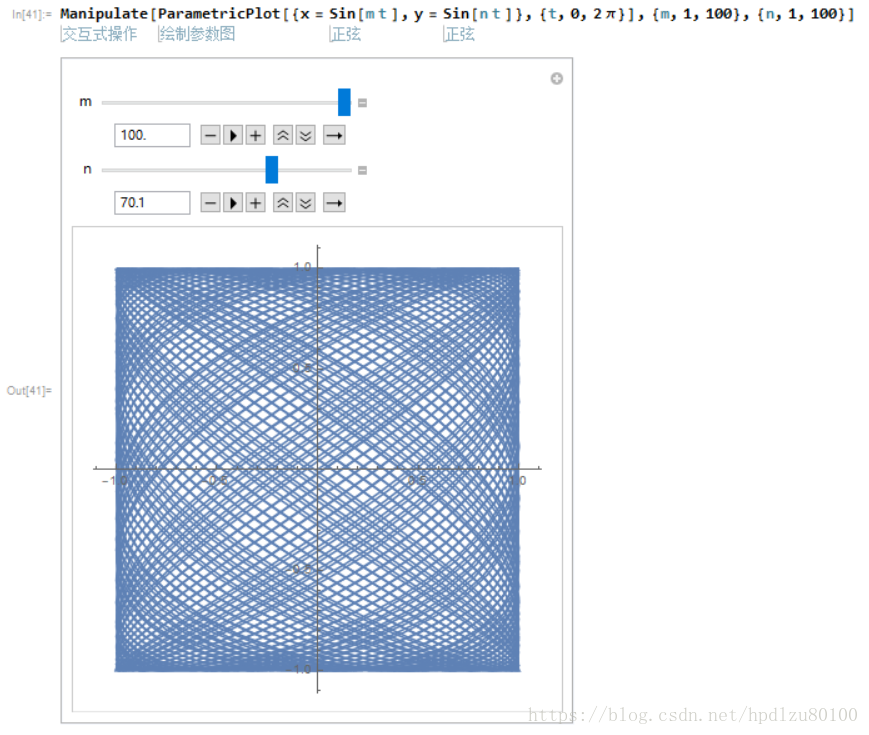
1. ParametricPlot[{fx, fy,{u,uMin,uMax}]
generates a parametric plot of a curve with x and y coordinates Subscript[f, x] and Subscript[f, y] as a function of u.
generates a parametric plot of a curve with x and y coordinates Subscript[f, x] and Subscript[f, y] as a function of u.
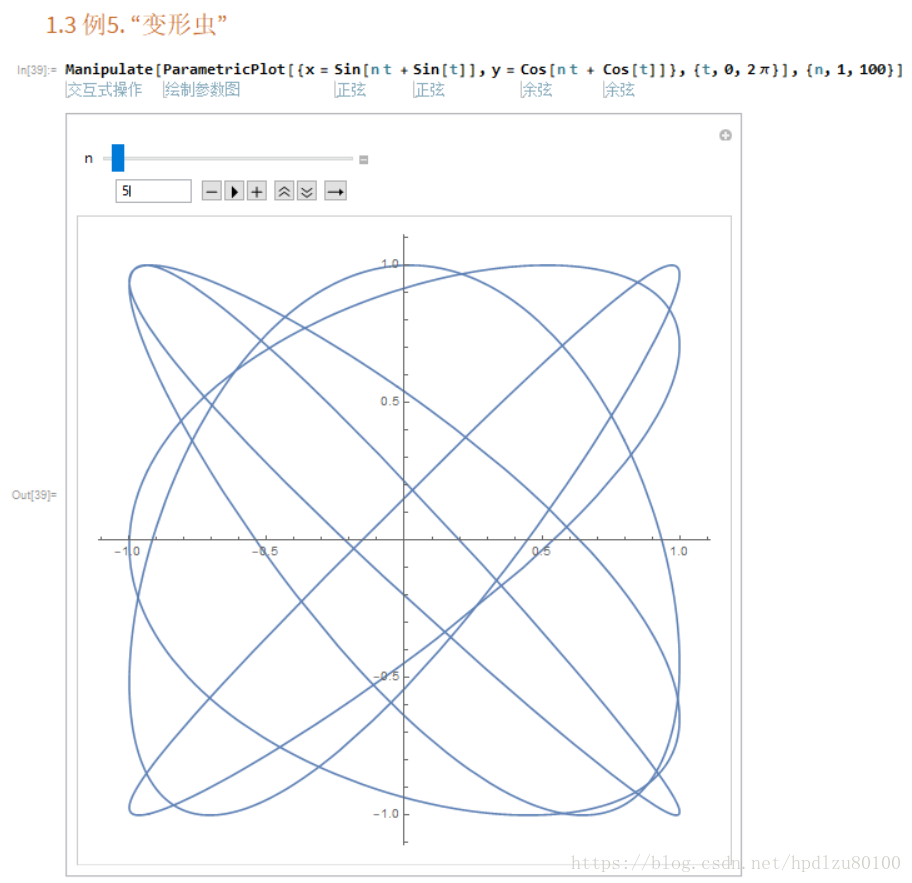
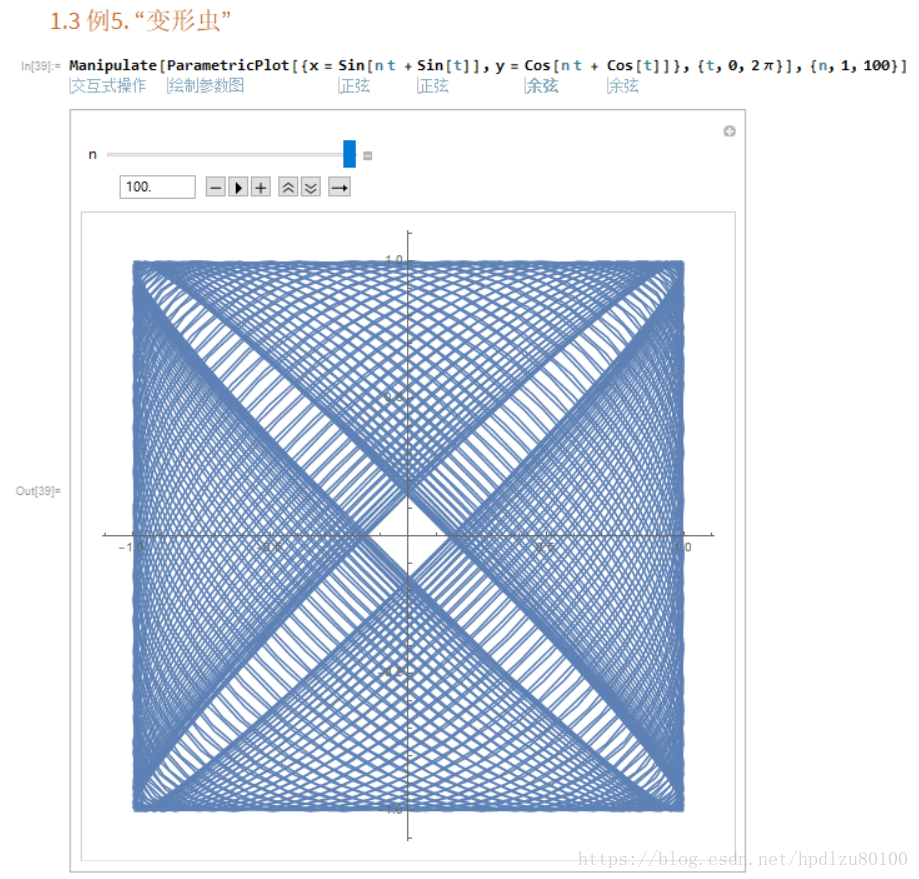
2. Manipulate[expr,{u,uMin,Subscript[u, max]}]
generates a version of expr with controls added to allow interactive manipulation of the value of u.
generates a version of expr with controls added to allow interactive manipulation of the value of u.
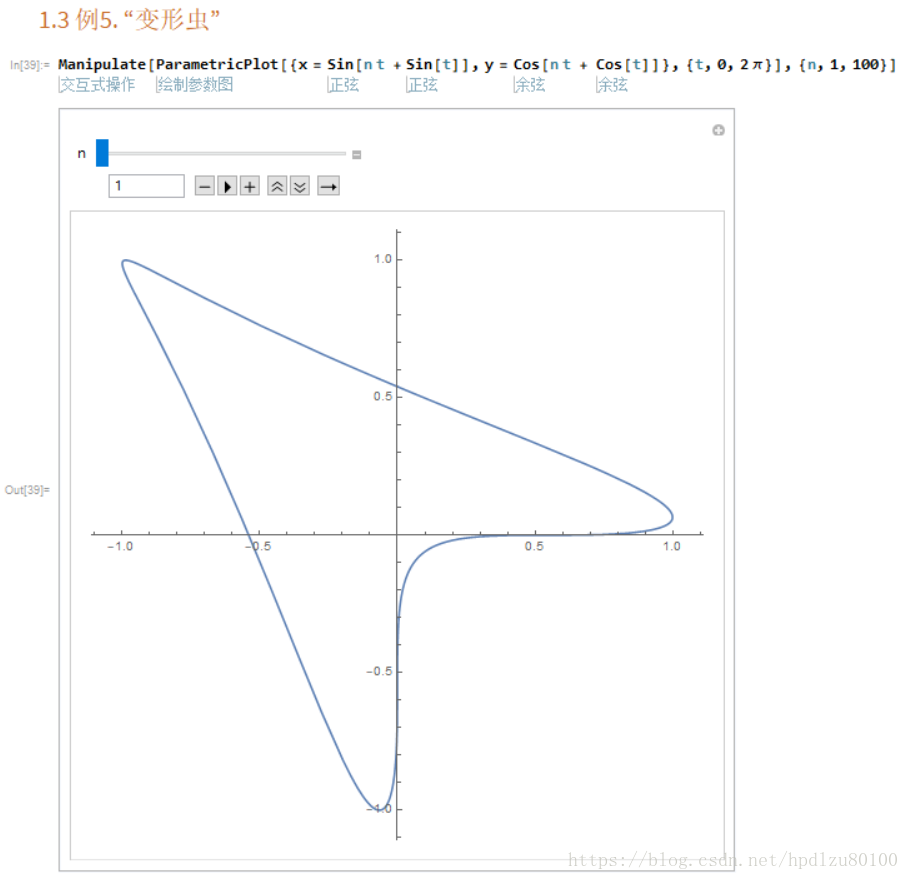
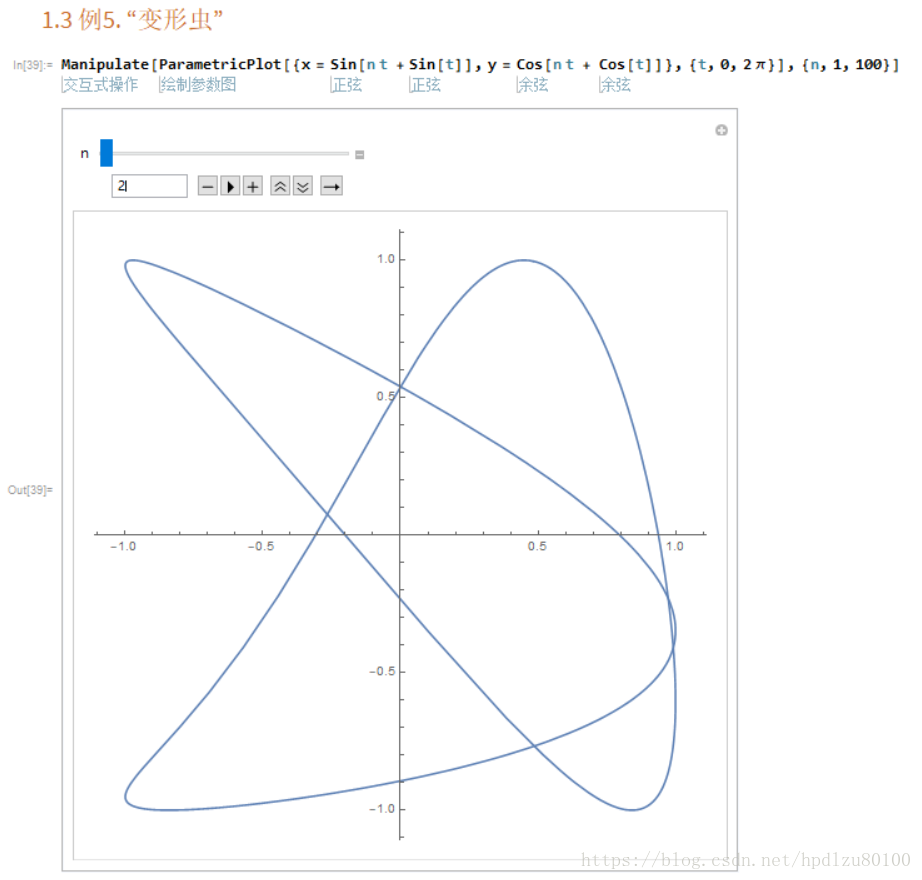
有了这个Manipulate功能,我们可以轻松查看图形怎样随参数变化而变化。教材中的这个例子,实际动手操作了一下,没想到如此好玩,大大超出了我的想象。所以,我索性给这个参数方程起了个名字——变形虫。
这篇关于使用Mathematica动态绘制参数方程(Manipulate, ParametricPlot)的文章就介绍到这儿,希望我们推荐的文章对编程师们有所帮助!


