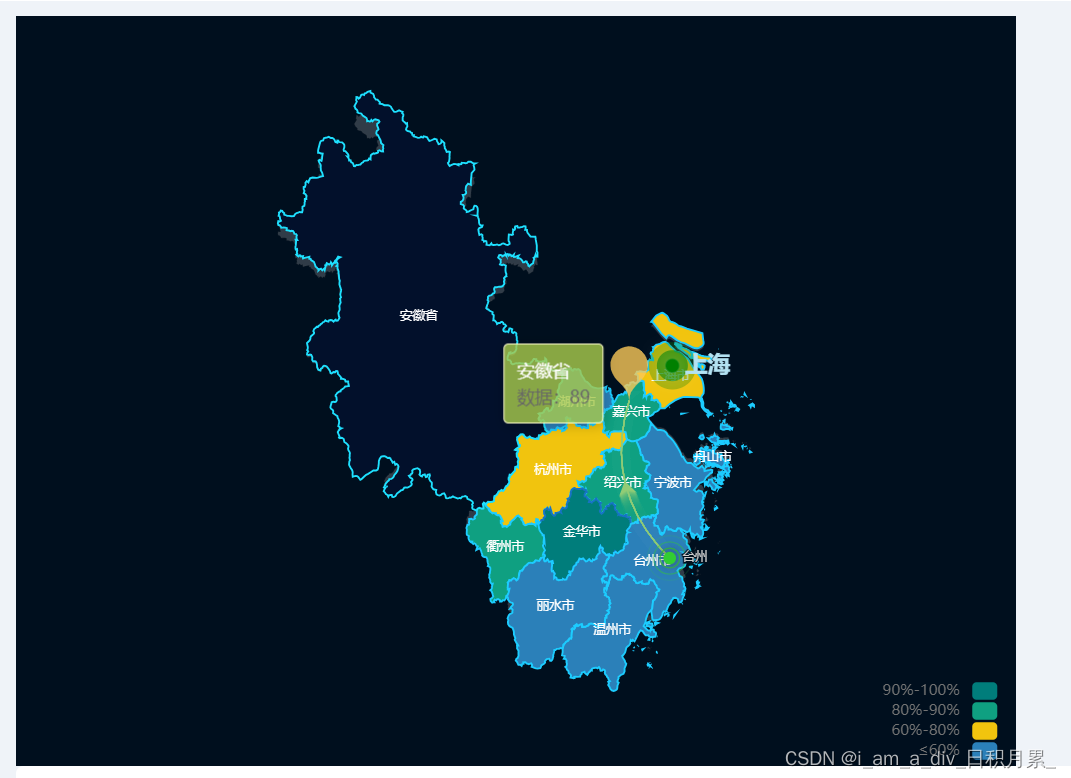
本文主要是介绍vue3使用echarts实现地图撒点、飞线等功能,希望对大家解决编程问题提供一定的参考价值,需要的开发者们随着小编来一起学习吧!
echarts地图配置参考链接
链接2
vue3使用echarts
map.vue
<template><div class="echart-demo" id="demo"></div>
</template><script setup lang="ts">
//引入echart和json数据
import * as echarts from 'echarts'
import ShAhZj from './map.json'
import { onMounted } from 'vue'//设置echart数据
let setOption = () => {//获取echart对象let dom = document.getElementById('demo')if (dom) {console.log(1111);let data = [{name: "上海市",value: Math.round(Math.random() * 100),},{name: "安徽省",value: Math.round(Math.random() * 100),},{name: "杭州市",value: Math.round(Math.random() * 100),},{name: "湖州市",value: Math.round(Math.random() * 100),},{name: "嘉兴市",value: Math.round(Math.random() * 100),}, {name: "舟山市",value: Math.round(Math.random() * 100),},{name: "绍兴市",value: Math.round(Math.random() * 100),},{name: "宁波市",value: Math.round(Math.random() * 100),},{name: "金华市",value: Math.round(Math.random() * 100),itemStyle: {areaColor: '#F50508',borderColor: '#1773c3', // 区域边框shadowColor: '#1773c3', // 阴影}}, {name: "台州市",value: Math.round(Math.random() * 100),},{name: "丽水市",value: Math.round(Math.random() * 100),},, {name: "温州市",value: Math.round(Math.random() * 100),},{name: "衢州市",value: Math.round(Math.random() * 100),},]//初始化let myEchart = echarts.init(dom)//注册地图echarts.registerMap('上海安徽浙江', ShAhZj)let option = {backgroundColor: '#000f1e',geo: {map: '上海安徽浙江',aspectScale: 0.8,layoutCenter: ['50%', '50%'], //地图位置layoutSize: '75%',itemStyle: {normal: {shadowColor: '#276fce',shadowOffsetX: 0,shadowOffsetY: 0,opacity: 0.2},emphasis: {areaColor: '#276fce'}}},tooltip: {trigger: 'item',backgroundColor: 'rgba(166, 200, 76, 0.82)',borderColor: '#FFFFCC',showDelay: 0,hideDelay: 0,enterable: true,transitionDuration: 0,extraCssText: 'z-index:100',formatter: function (params, ticket, callback) {console.log('params', params.value);//根据业务自己拓展要显示的内容var res = ''var name = params.namevar value = params.value[params.seriesIndex + 1] || params.valueres = "<span style='color:#fff;'>" + name + '</span><br/>数据:' + valuereturn res}},//是视觉映射组件,用于进行『视觉编码』,也就是将数据映射到视觉元素(视觉通道)。visualMap: {// 左下角定义 在选中范围中的视觉元素 渐变地区颜色type: "piecewise", // 类型为分段型top: "bottom",// calculable: true, //是否显示拖拽用的手柄(手柄能拖拽调整选中范围)。right: 10,splitNumber: 6,seriesIndex: [0],itemWidth: 20, // 每个图元的宽度itemGap: 2, // 每两个图元之间的间隔距离,单位为pxpieces: [// 自定义每一段的范围,以及每一段的文字// { gte: 10000, label: "10000人以上", color: "#1890FF" }, // 不指定 max,表示 max 为无限大(Infinity)。{gte: 90,lte: 100,label: "90%-100%",color: "#007D7B",},{gte: 80,lte: 90,label: "80%-90%",color: "#0FA081",},{gte: 60,lte: 80,label: "60%-80%",color: "#F1C40E",},{gte: 0,lte: 60,label: "≤60%",color: "#2B80B9",},// { lte: 0, label: "无", color: "#FAFAFA" }, // 不指定 min,表示 min 为无限大(-Infinity)。],textStyle: {color: "#737373",},},series: [{tooltip: {trigger: 'item',},name: '上海安徽浙江数据',type: 'map',map: '上海安徽浙江', // 自定义扩展图表类型showLegendSymbol: true, // 存在legend时显示label: { // 文字show: true,color: '#fff',fontSize: 10},itemStyle: { // 地图样式// areaColor: '#282C34',  //区域颜色// borderColor: '#ffffff',  //边框颜色// borderWidth: 1normal: {areaColor: '#0c274b',borderColor: '#1cccff',borderWidth: 1.5},emphasis: {areaColor: '#02102b',label: {color: '#fff'}}},emphasis: { // 鼠标移入时显示的默认样式itemStyle: {areaColor: '#4adcf0',borderColor: '#404a59',borderWidth: 1},label: { // 文字show: true,color: '#0D5EFF',fontSize: 12,fontWeight: 600},},data: data// [//   //自定义区域的颜色//   {//     name: '金华市',//   }// ],},// 区域散点图{type: 'effectScatter',coordinateSystem: 'geo',zlevel: 2,symbolSize: 10,rippleEffect: {//坐标点动画period: 3,scale: 5,brushType: 'fill'},label: {normal: {show: true,position: 'right',formatter: '{b}',color: '#b3e2f2',fontWeight: 'bold',fontSize: 18}},data: [{ name: '上海', value: [121.472644, 31.231706] }],itemStyle: {//坐标点颜色normal: {show: true,color: 'green',shadowBlur: 20,shadowColor: '#fff'},emphasis: {areaColor: '#f00'}}},// 飞线{type: 'lines',zlevel: 1,effect: {show: true,period: 4, // 箭头指向速度,值越小速度越快trailLength: 0.1, // 特效尾迹长度[0,1]值越大,尾迹越长重symbol: 'arrow', // 箭头图标symbolSize: 10 // 图标大小},lineStyle: {normal: {width: 1, // 尾迹线条宽度opacity: 1, // 尾迹线条透明度curveness: 0.3 // 尾迹线条曲直度}},data: [{fromName: '台州',toName: '嘉兴',coords: [[121.428599, 28.661378], // 起始[120.750865, 30.762653] // 结束]}]},// 气泡,用于突出目的地{type: 'effectScatter',coordinateSystem: 'geo', // 使用地理坐标系// 要有对应的经纬度才显示,先经度再维度data: [{ name: '台州', value: [121.428599, 28.661378] }],showEffectOn: 'render', // 绘制完成后显示特效rippleEffect: {scale: 4, // 波纹的最大缩放比例brushType: 'stroke'},hoverAnimation: true,label: { // 图形上的文本标签show: true,formatter: '{b}',position: 'right',fontWeight: 500,fontSize: 10},// 默认样式itemStyle: {color: '#32cd32',shadowBlur: 10,shadowColor: '#333'},// 鼠标移入时样式emphasis: {itemStyle: {color: '#f4e925' // 高亮颜色}},zlevel: 1},// 坐标用于突出起点{type: 'scatter',coordinateSystem: 'geo',zlevel: 2,rippleEffect: {period: 3,brushType: 'stroke',scale: 3},symbol: 'pin',symbolSize: 50,data: [{name: '嘉兴',value: [120.750865, 30.762653]}]}],}myEchart.setOption(option);window.addEventListener('resize', function () {myEchart.resize();});}}onMounted(() => {setOption()
})</script><style scoped lang="scss">
.echart-demo {width: 800px;height: 600px;
}
</style>
地图的map.json数据自己获取
我是获取可上海、安徽、以及浙江省的市级子区域坐标
这篇关于vue3使用echarts实现地图撒点、飞线等功能的文章就介绍到这儿,希望我们推荐的文章对编程师们有所帮助!


