plotting专题
Plotting in R for Biologists
数据 library(ggplot2) filename <- "/home/taoyan/Plotting in R for Biologists/Lesson-01/Encode_HMM_data.txt" my_data <- read.csv(filename, sep="\t", header=FALSE) # 查看一下数据 head(my_data) 对数据列名重命名 na
Backtrader 文档学习- Plotting
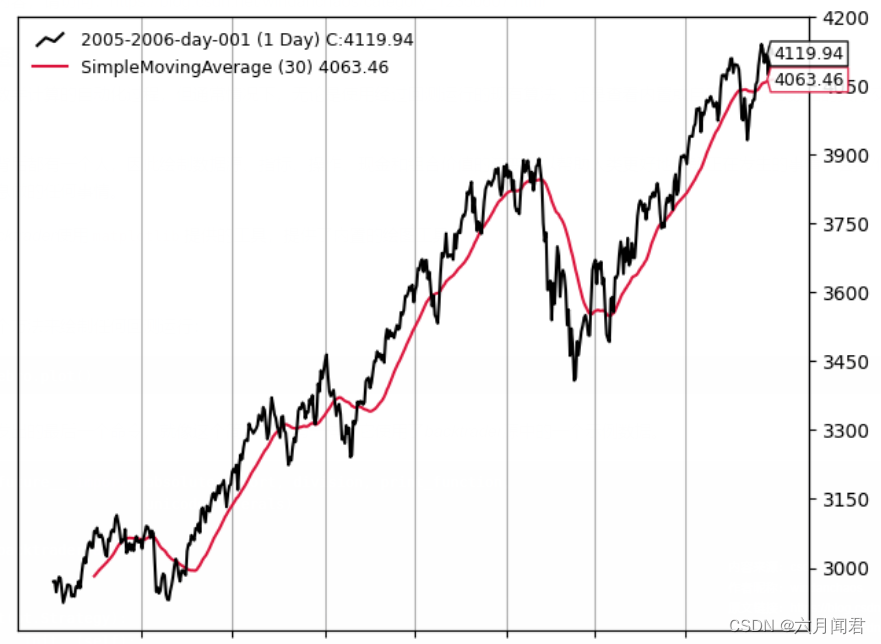
Backtrader 文档学习- Plotting 虽然回测是一个基于数学计算的自动化过程,还是希望实际通过可视化验证。无论是使用现有算法回测,还是观察数据驱动的指标(内置或自定义)。 凡事都要有人完成,绘制数据加载、指标、操作执行、现金和投资组合价值的演变,可以帮助人们更好地了解正在发生的事情,放弃/修改/创造的思考,查看图表的人对可视化信息做处理 。 这就是为什么backtrader使用
Backtrader 文档学习- Plotting -Plotting on the same axis
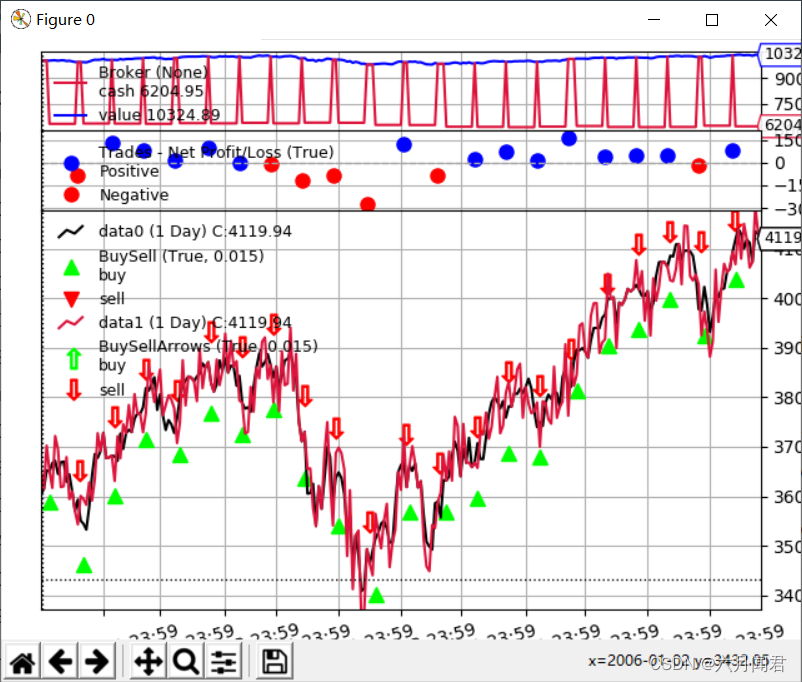
Backtrader 文档学习- Plotting -Plotting on the same axis 1.概述 在同一轴上绘图,绘图是在同一空间上绘制原始数据和稍微(随机)修改的数据,但不是在同一轴上。 核心代码,data数据正负50点。 # The filter which changes the close pricedef close_changer(data, *args,
Plotting Logarithmic Error Bars(如何在log log plot中绘制误差条)
Suppose that one has a sufficient number of measurements to make an estimate of a measured quantity y y y and report its absolute error, ± δ y \pm\delta y ±δy. The absolute error ± δ y \pm\delta y


