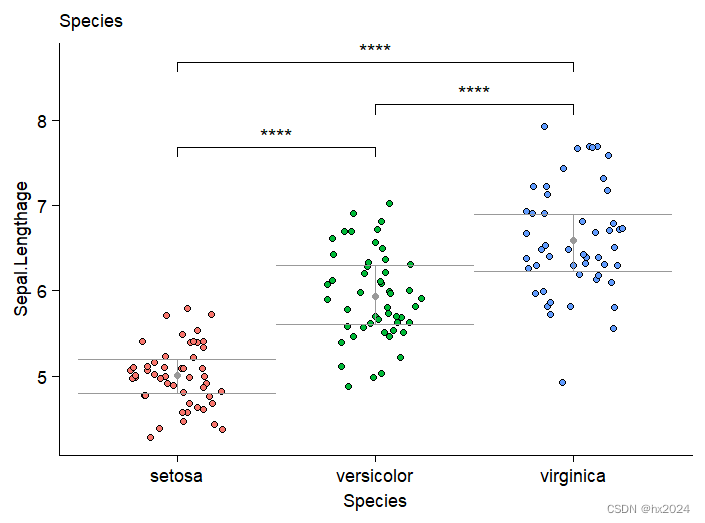
本文主要是介绍多组间比较散点图+误差棒(自备),希望对大家解决编程问题提供一定的参考价值,需要的开发者们随着小编来一起学习吧!
目录
数据
计算四分位值
作图
数据
rm(list = ls())
library(ggplot2)
library(dplyr)
library(ggpubr)
library(reshape2)
library(tidyverse)data <- iris##鸢尾花数据集
dat <- data[,c(5,1)]#单个数据进行分析
计算四分位值
#根据分组计算四分位及中位数
dat1 <- dat %>% Species_by(Species) %>% mutate(upper =  quantile(Sepal.Length, 0.75), lower = quantile(Sepal.Length, 0.25),mean = mean(Sepal.Length),median = median(Sepal.Length))
> head(dat1)
# A tibble: 6 × 6
# Groups:   Species [1]Species Sepal.Length upper lower  mean median<fct>          <dbl> <dbl> <dbl> <dbl>  <dbl>
1 setosa           5.1   5.2   4.8  5.01      5
2 setosa           4.9   5.2   4.8  5.01      5
3 setosa           4.7   5.2   4.8  5.01      5
作图
#比较分组
my_comparisons =list( c("setosa","versicolor"),c("versicolor","virginica"),c("setosa","virginica"))
P <- ggplot(dat1,aes(x=Species,y=Sepal.Length)) + #ggplot作图geom_jitter(shape = 21,aes(fill=Species),width = 0.25) + stat_summary(fun=mean, geom="point", color="grey60") +theme_cowplot() +theme(axis.text = element_text(size = 10),axis.title = element_text(size = 10),legend.text = element_text(size = 10),legend.title = element_text(size = 10),plot.title = element_text(size = 10,face = 'plain'),legend.position = 'none') + labs(title = "Species",y='Sepal.Lengthage') +geom_errorbar(aes(ymin = lower, ymax = upper),col = "grey60",width =  1)+#误差棒#差异检验stat_compare_means(comparisons=my_comparisons,label.y = c(7.5, 8, 8.5),method="t.test",#wilcox.testlabel="p.signif")
P
dev.off()
ggplot2画各种误差线和森林图 - 知乎 (zhihu.com)
R进阶绘图--散点箱线图+显著性 / 组间差异比较 / ggpubr包 - 知乎 (zhihu.com)
这篇关于多组间比较散点图+误差棒(自备)的文章就介绍到这儿,希望我们推荐的文章对编程师们有所帮助!


