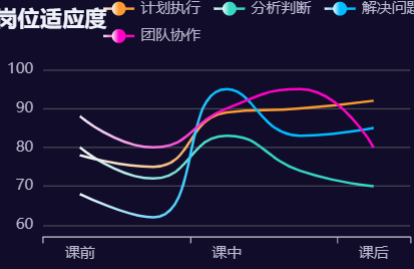
本文主要是介绍echars设置渐变颜色的方法,希望对大家解决编程问题提供一定的参考价值,需要的开发者们随着小编来一起学习吧!
在我们日常的开发中,难免会遇到有需求,需要使用echars设置渐变的图表,如果我们需要设置给图表设置渐变颜色的话,我们只需要在 series 配置项中 添加相应的属性配置项即可。

方式一:colorStops
- type:‘linear’,线性渐变
- x,y,x2,y2,代表包围框中的百分比,数值范围 0-1;
代码实例 注意:这个color 是配置在 series 内的
color: {type: 'linear', // 表示线性渐变//代表包围框中的百分比,数值范围 0-1x: 0,y: 0,x2: 0,y2: 1,colorStops: [{offset: 0,//23, 82, 233color: 'rgba(23, 82, 233,1)' // 0% 处的颜色},{//7, 158, 228offset: 0.8,color: 'rgba(7, 158, 228,1)' // 80% 处的颜色}]},方式二:new echarts.graphic.LinearGradient((x,y,x2,y2)
- x,y,x2,y2,包围框中的百分比,数值范围 0-1;
- offset,类似颜色线性梯度,数值范围 0-1;
代码实例 这个itemStyle是配置在 series 内的
itemStyle: {color: new echarts.graphic.LinearGradient(0, 0, 1, 0, [{offset: 0.5, // 50%位置的颜色color: 'rgba(252, 154, 48, 1)'},{offset: 0, // 0%位置的颜色color: 'rgba(246, 248, 252, 1)' //渐变颜色}])},这篇关于echars设置渐变颜色的方法的文章就介绍到这儿,希望我们推荐的文章对编程师们有所帮助!


