本文主要是介绍使用Python的netCDF4和matplotlib.basemap包进行气象数据的可视化,希望对大家解决编程问题提供一定的参考价值,需要的开发者们随着小编来一起学习吧!
首先,安装netCDF4和Basemap,Windows下和Linux下会稍微有些不一样,请自行百度。
NetCDF4:https://github.com/Unidata/netcdf4-python
Basemap:http://matplotlib.org/basemap/users/installing.html
下面是一个示例代码:
from netCDF4 import Dataset
import numpy as np
import matplotlib.pyplot as plt
from mpl_toolkits.basemap import Basemapmeteo_file = "/home/theone/Data/GreatKhingan/MERRA/MERRA2_400.inst1_2d_lfo_Nx.20131201.nc4"
fh = Dataset(meteo_file, mode='r')# 获取每个变量的值
lons = fh.variables['lon'][:]
lats = fh.variables['lat'][:]
tlml = fh.variables['TLML'][:]tlml_units = fh.variables['TLML'].units# 经纬度平均值
lon_0 = lons.mean()
lat_0 = lats.mean()m = Basemap(lat_0=lat_0, lon_0=lon_0)
lon, lat = np.meshgrid(lons, lats)
xi, yi = m(lon, lat)# Plot Data
# 这里我的tlml数据是24小时的,我这里只绘制第1小时的(tlml_0)
tlml_0 = tlml[0:1:, ::, ::]
cs = m.pcolor(xi, yi, np.squeeze(tlml_0))# Add Grid Lines
# 绘制经纬线
m.drawparallels(np.arange(-90., 91., 20.), labels=[1,0,0,0], fontsize=10)
m.drawmeridians(np.arange(-180., 181., 40.), labels=[0,0,0,1], fontsize=10)# Add Coastlines, States, and Country Boundaries
m.drawcoastlines()
m.drawstates()
m.drawcountries()# Add Colorbar
cbar = m.colorbar(cs, location='bottom', pad="10%")
cbar.set_label(tlml_units)# Add Title
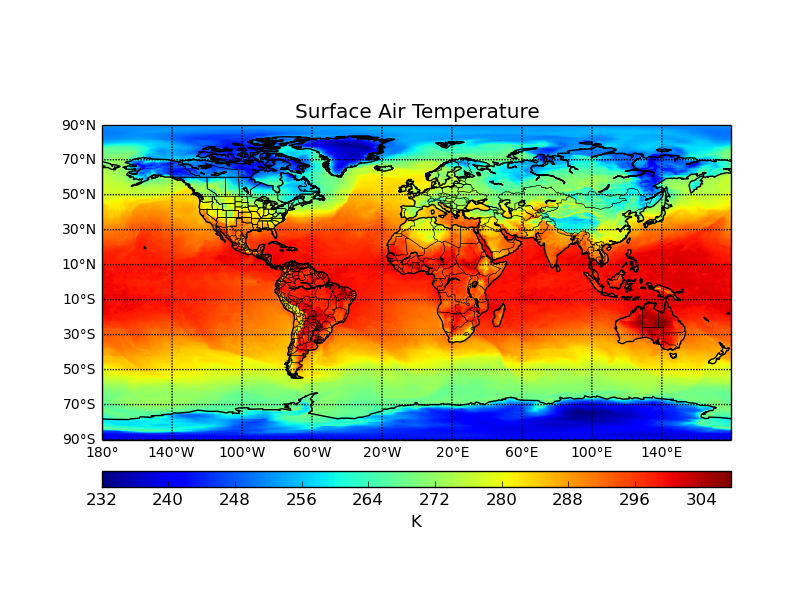
plt.title('Surface Air Temperature')
plt.show()fh.close()运行结果:
这篇关于使用Python的netCDF4和matplotlib.basemap包进行气象数据的可视化的文章就介绍到这儿,希望我们推荐的文章对编程师们有所帮助!


