本文主要是介绍Python检验样本是否服从正态分布,希望对大家解决编程问题提供一定的参考价值,需要的开发者们随着小编来一起学习吧!
在进行t检验、F检验之前,我们往往要求样本大致服从正态分布,下面介绍两种检验样本是否服从正态分布的方法。
1 可视化
我们可以通过将样本可视化,看一下样本的概率密度是否是正态分布来初步判断样本是否服从正态分布。
代码如下:
import numpy as np
import pandas as pd
import matplotlib.pyplot as plt# 使用pandas和numpy生成一组仿真数据
s = pd.DataFrame(np.random.randn(500),columns=['value'])
print(s.shape)      # (500, 1)# 创建自定义图像
fig = plt.figure(figsize=(10, 6))
# 创建子图1
ax1 = fig.add_subplot(2,1,1)
# 绘制散点图
ax1.scatter(s.index, s.values)
plt.grid()      # 添加网格# 创建子图2
ax2 = fig.add_subplot(2, 1, 2)
# 绘制直方图
s.hist(bins=30,alpha=0.5,ax=ax2)
# 绘制密度图
s.plot(kind='kde', secondary_y=True,ax=ax2)     # 使用双坐标轴
plt.grid()      # 添加网格# 显示自定义图像
plt.show()
可视化图像如下:
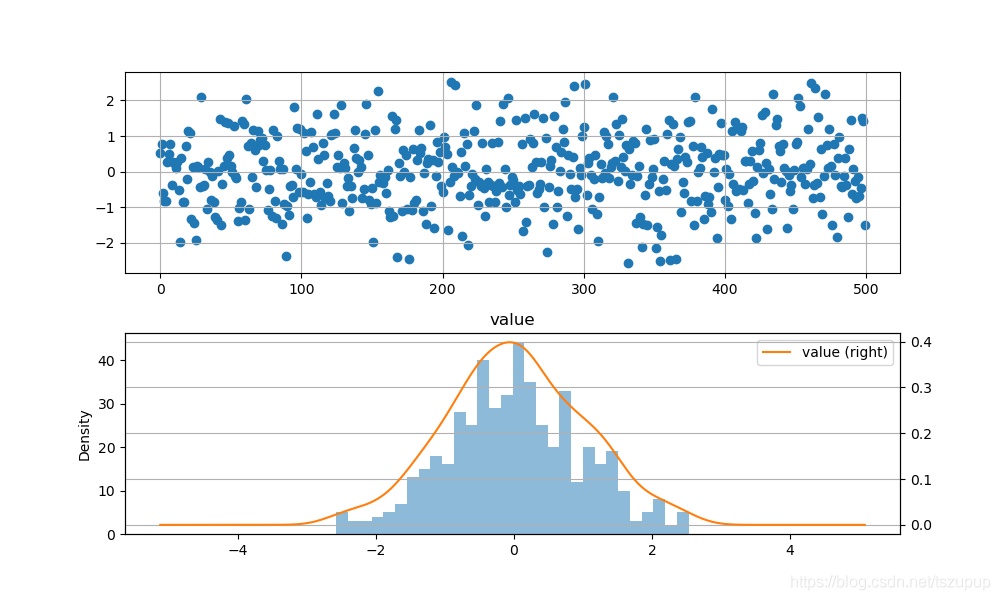
从图中可以初步看出生成的数据近似服从正态分布。为了得到更具说服力的结果,我们可以使用统计检验的方法,这里使用的是.scipy.stats中的函数。
2 统计检验
1)kstest
scipy.stats.kstest函数可用于检验样本是否服从正态、指数、伽马等分布,函数的源代码为:
def kstest(rvs, cdf, args=(), N=20, alternative='two-sided', mode='approx'):"""Perform the Kolmogorov-Smirnov test for goodness of fit.This performs a test of the distribution F(x) of an observedrandom variable against a given distribution G(x). Under the nullhypothesis the two distributions are identical, F(x)=G(x). Thealternative hypothesis can be either 'two-sided' (default), 'less'or 'greater'. The KS test is only valid for continuous distributions.Parameters----------rvs : str, array or callableIf a string, it should be the name of a distribution in `scipy.stats`.If an array, it should be a 1-D array of observations of randomvariables.If a callable, it should be a function to generate random variables;it is required to have a keyword argument `size`.cdf : str or callableIf a string, it should be the name of a distribution in `scipy.stats`.If `rvs` is a string then `cdf` can be False or the same as `rvs`.If a callable, that callable is used to calculate the cdf.args : tuple, sequence, optionalDistribution parameters, used if `rvs` or `cdf` are strings.N : int, optionalSample size if `rvs` is string or callable. Default is 20.alternative : {'two-sided', 'less','greater'}, optionalDefines the alternative hypothesis (see explanation above).Default is 'two-sided'.mode : 'approx' (default) or 'asymp', optionalDefines the distribution used for calculating the p-value.- 'approx' : use approximation to exact distribution of test statistic- 'asymp' : use asymptotic distribution of test statisticReturns-------statistic : floatKS test statistic, either D, D+ or D-.pvalue : floatOne-tailed or two-tailed p-value.2)normaltest
scipy.stats.normaltest函数专门用于检验样本是否服从正态分布,函数的源代码为:
def normaltest(a, axis=0, nan_policy='propagate'):"""Test whether a sample differs from a normal distribution.This function tests the null hypothesis that a sample comesfrom a normal distribution. It is based on D'Agostino andPearson's [1]_, [2]_ test that combines skew and kurtosis toproduce an omnibus test of normality.Parameters----------a : array_likeThe array containing the sample to be tested.axis : int or None, optionalAxis along which to compute test. Default is 0. If None,compute over the whole array `a`.nan_policy : {'propagate', 'raise', 'omit'}, optionalDefines how to handle when input contains nan. 'propagate' returns nan,'raise' throws an error, 'omit' performs the calculations ignoring nanvalues. Default is 'propagate'.Returns-------statistic : float or array``s^2 + k^2``, where ``s`` is the z-score returned by `skewtest` and``k`` is the z-score returned by `kurtosistest`.pvalue : float or arrayA 2-sided chi squared probability for the hypothesis test.3)shapiro
scipy.stats.shapiro函数也是用于专门做正态检验的,函数的源代码为:
def shapiro(x):"""Perform the Shapiro-Wilk test for normality.The Shapiro-Wilk test tests the null hypothesis that thedata was drawn from a normal distribution.Parameters----------x : array_likeArray of sample data.Returns-------W : floatThe test statistic.p-value : floatThe p-value for the hypothesis test.下面我们使用第一部分生成的仿真数据,用这三种统计检验函数检验生成的样本是否服从正态分布(p > 0.05),代码如下:
import numpy as np
import pandas as pd
import matplotlib.pyplot as plt# 使用pandas和numpy生成一组仿真数据
s = pd.DataFrame(np.random.randn(500),columns=['value'])
print(s.shape)      # (500, 1)# 计算均值
u = s['value'].mean()
# 计算标准差
std = s['value'].std()  # 计算标准差
print('scipy.stats.kstest统计检验结果:----------------------------------------------------')
print(stats.kstest(s['value'], 'norm', (u, std)))
print('scipy.stats.normaltest统计检验结果:----------------------------------------------------')
print(stats.normaltest(s['value']))
print('scipy.stats.shapiro统计检验结果:----------------------------------------------------')
print(stats.shapiro(s['value']))
统计检验结果如下:
scipy.stats.kstest统计检验结果:----------------------------------------------------
KstestResult(statistic=0.01596290473494305, pvalue=0.9995623150120069)
scipy.stats.normaltest统计检验结果:----------------------------------------------------
NormaltestResult(statistic=0.5561685865675511, pvalue=0.7572329891688141)
scipy.stats.shapiro统计检验结果:----------------------------------------------------
(0.9985257983207703, 0.9540967345237732)
可以看到使用三种方法检验样本是否服从正态分布的结果中p-value都大于0.05,说明服从原假设,即生成的仿真数据服从正态分布。
参考
python数据分析----卡方检验,T检验,F检验,K-S检验
python使用scipy.stats数据(正态)分布检验方法
python 如何判断一组数据是否符合正态分布
这篇关于Python检验样本是否服从正态分布的文章就介绍到这儿,希望我们推荐的文章对编程师们有所帮助!


