本文主要是介绍Python环境下基于动态模态分解的股票价格预测,希望对大家解决编程问题提供一定的参考价值,需要的开发者们随着小编来一起学习吧!
动态模态分解模型的基本思想是直接从数据模拟得到的流场中提取流动的动态信息,根据不同频率的流场变动寻找数据映射,基于动态非线性无穷维转化成动态线性有穷维的方式,采用了Arnoldi 方法以及奇异值分解SVD降维的思想,借鉴了ARIMA、SARIMA 以及季节模型等许多时间序列的关键特征,被广泛的使用在数学、物理、金融等领域。
动态模态分解按照频率对系统进行排序,提取系统特征频率,从而观察不同频率的流动结构对流场的贡献,同时动态模态分解模态特征值可以进行流场预测。因为动态模态分解算法理论的严密性、稳定性、简易性等优点,在不断被运用的同时,动态模态分解算法也在本来的基础之上不断被完善,如与SPA检验结合起来,以验证股票价格预测对比基准点的强有效性;以及通过联系动态模态分解算法和光谱研究的方式,模拟股票市场在循环经济当中的震动,均能够有效地采集分析数据,并最终得到结果。
import numpy as np
import pandas as pd
import datetime
import matplotlib.pyplot as plt
import matplotlib as mpl#%% Load data
data = pd.read_csv('historical_stock_prices.csv')#%% User inputs
# Choose dates
start_date = '2014-03-18'
end_date = '2015-03-18'# Choose tickers
s1 = 'AEO'
s2 = 'ANF'
s3 = 'FL'
s4 = 'GPS'
s5 = 'SCVL'
s6 = 'RL'
s7 = 'URBN'
s8 = 'ROST'# Number of past days to build the DMD model on
mp = 7
# Number of future days to predict with DMD
mf = 1# Percentage of portfolio to sell off each day
sell_perc = 0.25# Initial capital
init_cap = 1e6#%% Functionsdef GetPrices(portfolio_size, bigX, current_day):'''Gets the day close prices of each company in the portfolio at the currentdayInputs:portfolio_size: int, the number of companies that we can trade withbigX: array (portfolio size * number of days), consisting of time series close prices along the columns and new companies along the rowscurrent_day: int, the last day considered in the DMD model construction inorder to make a prediction about the next dayreturns: day_close: array (portfolio size * 1), consisting of close prices for each company on the current day'''# Find prices on a given dayday_close = np.zeros(shape=(portfolio_size,1))for i in range(0,portfolio_size):day_close[i,0] = bigX[i,current_day-1]return day_closedef Trade(current_day, mp, mf, bigX, portfolio_size, stock_amounts, day_close, sell_perc):'''The core algorithm, executing trades and stepping forward days in time.Inputs:current_day: int, the last day considered in the DMD model construction inorder to make a prediction about the next daymp: int, number of historical days used to build the DMD modelmf: int, number of days to predict in the future with the DMD modelbigX: array (portfolio size * number of days), consisting of time series close prices along the columns and new companies along the rowsportfolio_size: int, the number of companies that we can trade withstock_amounts: array (portfolio size * 1), the number of stocks for each company held in the portfolio at the current dayday_close: array (portfolio size * 1), consisting of close prices for each company on the current daysell_perc: float, a user input defining which proportion of the portfolio valueshould be sold at the end of each dayreturns: stock_amounts: array (portfolio size * 1), the number of stocks for each company held in the portfolio after trades have been executedday_close: array (portfolio size * 1), consisting of the new day close prices after stepping forward one daycurrent_day: int, the next day after taking one step forward'''first_day = current_day - (mp-1)# Time vector spans mp+mf, DMD will extrapolate to make a prediction about mft = list(range(first_day,mp+first_day+1))# Form the DMD matricesX1 = bigX[:,(first_day-1):(current_day-1)]X2 = bigX[:,(first_day):current_day]# Snapshots separated by 1 trading daydt = 1# Conduct DMDPhi, b, omega = DMD(X1, X2, dt)# DMD reconstruction to predict price on current_day + 1price_predictions = DMDreconstruct(X1, t, b, omega, Phi, mp, mf)# Calculate increases in price between current_day and the following dayprice_increases = np.zeros(shape=(portfolio_size,1))for i in range(0,portfolio_size):price_increases[i,0] = (price_predictions[i] - bigX[i,current_day-1])/bigX[i,current_day-1]# Calculate current portfolio valueportfolio_value = np.zeros(shape=(portfolio_size,1))for i in range(0,portfolio_size):portfolio_value[i,0] = stock_amounts[i,0]*day_close[i,0]# Sell bottom 25% of portfoliocash, stock_amounts = Sell(portfolio_value, sell_perc, price_increases, portfolio_size, stock_amounts, day_close)# Buy best performing shares with cash from sales.stock_amounts = Buy(price_increases, cash, day_close, stock_amounts)# Increment daycurrent_day += 1# Get new day_close pricesday_close = GetPrices(portfolio_size, bigX, current_day)return stock_amounts, day_close, current_daydef Sell(portfolio_value, sell_perc, price_increases, portfolio_size, stock_amounts, day_close):'''Conducts the sale of a proportion of the stocks in the portfolio with theworst predicted next-day pricesInputs:portfolio_value: array (portfolio size * 1), calculating the total value of all stocks held in the portfolio according to the current day close pricessell_perc: float, a user input defining which proportion of the portfolio valueshould be sold at the end of each dayprice_increases: array (portfolio size * 1), calculating the predicted changesin price between the current day and the next-day prediction for each stock portfolio_size: int, the number of companies that we can trade withstock_amounts: array (portfolio size * 1), the number of stocks for each company held in the portfolio at the current dayday_close: array (portfolio size * 1), consisting of close prices for each company on the current dayreturns: cash: float, the amount of cash generated by the sale of the worst-performingstocksstock_amounts: array (portfolio size * 1), the number of stocks for each company held in the portfolio at the end of the sale'''sell_value = np.sum(portfolio_value)*sell_perccash = 0lowest = np.sort(price_increases,axis=None)for i in range(0,portfolio_size):# For each ticker, find location of lowest price in price_increases lowest_value = stock_amounts[price_increases == lowest[i]]*day_close[price_increases == lowest[i]]temp_cash = cash + lowest_valueif temp_cash < sell_value:stock_amounts[price_increases == lowest[i]] = 0cash = temp_cashelif temp_cash == sell_value:stock_amounts[price_increases == lowest[i]] = 0cash = temp_cashbreakelse:number_sold = (sell_value-cash)/day_close[price_increases == lowest[i]]stock_amounts[price_increases == lowest[i]] = stock_amounts[price_increases == lowest[i]] - number_soldnew_cash = number_sold*day_close[price_increases == lowest[i]]cash = new_cash + cashbreakreturn cash, stock_amountsdef Buy(price_increases, cash, day_close, stock_amounts):'''Purchases stocks using the cash generated by the sale of the bottom of the portfolio, with an even distribution between the top two performing stocks.Inputs:price_increases: array (portfolio size * 1), calculating the predicted changesin price between the current day and the next-day prediction for each stock cash: float, the amount of cash generated by the sale of the worst-performingstocksday_close: array (portfolio size * 1), consisting of close prices for each company on the current daystock_amounts: array (portfolio size * 1), the number of stocks for each company held in the portfolio at the end of the salereturns: stock_amounts: array (portfolio size * 1), the number of stocks for each company held in the portfolio at the end of the purchases'''best = np.sort(price_increases,axis=None)[::-1]number_bought1 = 0.5*cash/day_close[price_increases == best[0]]number_bought2 = 0.5*cash/day_close[price_increases == best[1]] stock_amounts[price_increases == best[0]] = stock_amounts[price_increases == best[0]] + number_bought1stock_amounts[price_increases == best[1]] = stock_amounts[price_increases == best[1]] + number_bought2return stock_amountsdef DMD(X1, X2, dt):'''Conducts the DMD analysisInputs:X1: array (portfolio size * (mp-1)), the first DMD matrixX2: array (portfolio size * (mp-1)), the second DMD matrixdt: float, the time difference between snapshots of data (ie days)returns: Phi: array (portfolio size * (mp-1)), the DMD modesb: array ((mp-1) * 1), the DMD mode amplitudesomega: array ((mp-1) * 1), the DMD mode frequencies'''# SVD on X1U,S,V = np.linalg.svd(X1,full_matrices=0)Sigmar = np.diag(S)# Calculate AtildeAtilde = np.linalg.solve(Sigmar.T,(U.T @ X2 @ V.T).T).T# Eigendecomp of AtildeLambda, W = np.linalg.eig(Atilde)L = np.diag(Lambda)# DMD modesPhi = X2 @ np.linalg.solve(Sigmar.T,V).T @ W# DMD amplitudesalpha1 = Sigmar @ V[:,0]b = np.linalg.solve(W @ L,alpha1)# Frequencyomega = np.log(Lambda)/dtreturn Phi, b, omegadef DMDreconstruct(X1, t, b, omega, Phi, mp, mf):'''Conducts the DMD reconstruction in order to make a next-day price predictionInputs:X1: array (portfolio size * (mp-1)), the first DMD matrixt: list (length mp+mf), time vector used to reconstruct the data matrixb: array ((mp-1) * 1), the DMD mode amplitudesomega: array ((mp-1) * 1), the DMD mode frequenciesPhi: array (portfolio size * (mp-1)), the DMD modesmp: int, number of historical days used to build the DMD modelmf: int, number of days to predict in the future with the DMD modelreturns: price_predictions: array (portfolio size * 1), the DMD model of day close prices projected out mf day(s) into the future'''time_dynamics = np.zeros(shape=(X1.shape[1],len(t)),dtype=np.complex128)for i in range(0,len(t)):time_dynamics[:,i] = np.multiply(b,np.exp(omega*t[i]))X_dmd = Phi @ time_dynamicsprice_predictions = np.real(X_dmd[:,(mp)])return price_predictions#%% Set parameters and reduce table size
after_start_date = data['date'] >= start_date
before_end_date = data['date'] <= end_date
between_two_dates = after_start_date & before_end_datetabledates = data.loc[between_two_dates]tickers = [s1,s2,s3,s4,s5,s6,s7,s8]
portfolio_size = len(tickers)# Get retail_table in the specified date range
reduced_table = []
for i in tickers:ticker_loc = tabledates['ticker'] == ireduced_table.append(tabledates.loc[ticker_loc])retail_table = pd.concat(reduced_table)# Form the big data matrix.
# For each ticker, get all the close prices and store.
days = len(retail_table[retail_table['ticker'] == tickers[0]])
bigX = np.zeros(shape=(portfolio_size,days))
for i in range(0,portfolio_size):temp = retail_table[retail_table['ticker'] == tickers[i]]temp_price_vector = temp['close'].values.tolist()bigX[i,:] = temp_price_vector#%% Initialise the trading
# Initialise at day 7, as DMD uses data on the previous 7 days to predict
# the price on the following day
current_day = 7# Initialise capital and date
init_each = 1e6/portfolio_size
init_day = datetime.datetime.strptime(start_date,'%Y-%m-%d') + datetime.timedelta(days = (mp-1))day_close = GetPrices(portfolio_size, bigX, current_day)# Evenly distribute stock
stock_amounts = np.zeros(shape=(portfolio_size,1))
for i in range(0,portfolio_size):stock_amounts[i,0] = init_each/day_close[i]#%% The trading
# Initialise portfolio value over time
valuet = np.zeros(shape=(1,days))# Trade
for i in range(0,days-mp-1):stock_amounts, day_close, current_day = Trade(current_day, mp, mf, bigX, portfolio_size, stock_amounts, day_close, sell_perc);# Calculate value of portfolio and store in valuetvalue = np.sum(stock_amounts*day_close)valuet[0,i] = value#%% Load S&P data
SP = pd.read_csv('S&Pretail_reduced.csv')#%% Average returns
returnDMD = valuet[0,0:days-(mp+mf)] - 1e6
avreturnDMD = np.mean(returnDMD)
returnSP = SP['close'][0:days-(mp+mf)] - 1e6
avreturnSP = np.mean(returnSP)
DMDperformance = avreturnDMD/avreturnSP
print('DMD produces average returns of',round(DMDperformance,1),'times the S&P index.')#%% Plot
axdates = pd.to_datetime(SP['date'][0:days-(mp+mf)],dayfirst=True)plt.figure()
mpl.rc('font',family='Times New Roman')
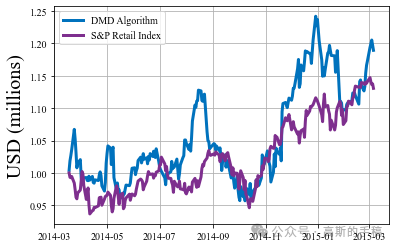
plt.plot(axdates,valuet[0,0:days-(mp+mf)]/1e6,linewidth=3,color="#0072BD")
plt.plot(axdates,SP['close'][0:days-(mp+mf)]/1e6,linewidth=3,color="#7E2F8E")
plt.ylabel('USD (millions)',fontsize=20)
plt.legend(['DMD Algorithm','S&P Retail Index'],)
plt.grid()
plt.show()
知乎学术咨询:
哥廷根数学学派 - 知乎
工学博士,担任《Mechanical System and Signal Processing》,《中国电机工程学报》等期刊审稿专家,擅长领域:现代信号处理,机器学习,深度学习,数字孪生,时间序列分析,设备缺陷检测、设备异常检测、设备智能故障诊断与健康管理PHM等。
这篇关于Python环境下基于动态模态分解的股票价格预测的文章就介绍到这儿,希望我们推荐的文章对编程师们有所帮助!


