本文主要是介绍MySQL(8)——Show Profile、Trace和全局查询日志,希望对大家解决编程问题提供一定的参考价值,需要的开发者们随着小编来一起学习吧!
一、Show Profile
show profile是mysql提供的可以用来分析当前会话中语句执行的资源消耗情况。可以用于SQL的调优的测量。
默认情况下,该参数处于关闭状态,并保存最近15次的运行结果。
(一)开启
1. 查看当前版本mysql是否支持
mysql> select @@have_profiling;
+------------------+
| @@have_profiling |
+------------------+
| YES              |
+------------------+
1 row in set, 1 warning (0.00 sec)
2. 查看是否开启
mysql> select @@profiling;
+-------------+
| @@profiling |
+-------------+
|           0 |
+-------------+
1 row in set, 1 warning (0.00 sec)mysql> show variables like 'profiling';
+---------------+-------+
| Variable_name | Value |
+---------------+-------+
| profiling     | OFF   |
+---------------+-------+
1 row in set (0.01 sec)
3. 开启
mysql> set profiling=on;
Query OK, 0 rows affected, 1 warning (0.00 sec)mysql> show variables like 'profiling';
+---------------+-------+
| Variable_name | Value |
+---------------+-------+
| profiling     | ON    |
+---------------+-------+
1 row in set (0.00 sec)
(二)测试
1. 创建相关table
--创建部门表
create table tb_dept_bigdata(
id int unsigned primary key auto_increment,
deptno mediumint unsigned not null default 0,
dname varchar(20) not null default '',
loc varchar(13) not null default ''
);
-- 创建员工表
create table tb_emp_bigdata(
id int unsigned primary key auto_increment,empno mediumint unsigned not null default 0,
empname varchar(20) not null default '',
job varchar(9) not null default '',
mgr mediumint unsigned not null default 0,
hiredate date not null,
sal decimal(7,2) not null,
comm decimal(7,2) not null,
deptno mediumint unsigned not null default 0);
2. 创建函数
设置log_bin_trust_function_creators,由于在创建函数时,可能会报:This function has none
of DETERMINISTIC…因此我们需开启函数创建的信任功能。
mysql> show variables like 'log_bin_trust_function_creators';
+---------------------------------+-------+
| Variable_name                   | Value |
+---------------------------------+-------+
| log_bin_trust_function_creators | OFF   |
+---------------------------------+-------+
1 row in set (0.00 sec)mysql> set global log_bin_trust_function_creators=1;
Query OK, 0 rows affected (0.00 sec)mysql> show variables like 'log_bin_trust_function_creators';
+---------------------------------+-------+
| Variable_name                   | Value |
+---------------------------------+-------+
| log_bin_trust_function_creators | ON    |
+---------------------------------+-------+
1 row in set (0.01 sec)
创建随机生成字符串的函数:
delimiter $$
drop function if exists rand_string;
create function rand_string(n int) returns varchar(255)
begin
declare chars_str varchar(52) default 'abcdefghijklmnopqrstuvwxyzABCDEFGHIJKLMNOPQRSTUVWXYZ';
declare return_str varchar(255) default '';
declare i int default 0;
while i<n do
set return_str=concat(return_str,substring(chars_str,floor(1+rand()*52),1));
set i=i+1;
end while;
return return_str;
end $$
创建随机生成编号的函数:
delimiter $$
drop function if exists rand_num;
create function rand_num() returns int(5)
begin
declare i int default 0;
set i=floor(100+rand()*100);
return i;
end $$
3. 创建存储过程
创建往tb_dept_bigdata表中插入数据的存储过程:
delimiter $$
drop procedure if exists insert_dept;
create procedure insert_dept(in start int(10),in max_num int(10))
begin
declare i int default 0;
set autocommit=0;
repeat
set i=i+1;
insert into tb_dept_bigdata (deptno,dname,loc) values(rand_num(),rand_string(10),rand_string(8));
until i=max_num
end repeat;
commit;
end $$
创建往tb_emp_bigdata表中插入数据的存储过程:
delimiter $$
drop procedure if exists insert_emp;
create procedure insert_emp(in start int(10),in max_num int(10))
begin
declare i int default 0;
set autocommit=0;
repeat
set i=i+1;
insert into tb_emp_bigdata (empno,empname,job,mgr,hiredate,sal,comm,deptno) values((start+i),rand_string(6),'developer',0001,curdate(),2000,400,rand_num());
until i=max_num
end repeat;
commit;
end $$
4. 插入数据
delimiter ;
插入100条部门数据:
call insert_dept(100,100);
插入50万条员工数据:
call insert_emp(100,500000);
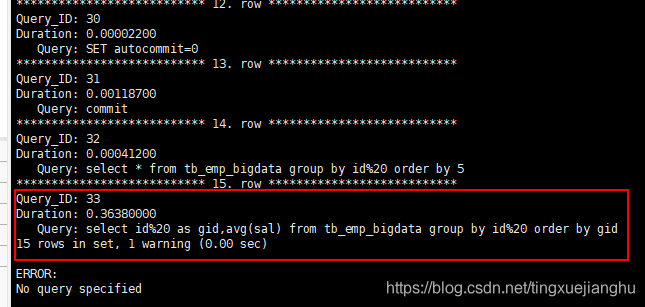
5. 测试查询
select id%20 as gid,avg(sal) from tb_emp_bigdata group by id%20 order by gid;
show profiles;
指定query_id:
mysql> show profile cpu,block io for query 33;
+----------------------+----------+----------+------------+--------------+---------------+
| Status               | Duration | CPU_user | CPU_system | Block_ops_in | Block_ops_out |
+----------------------+----------+----------+------------+--------------+---------------+
| starting             | 0.000123 | 0.000058 |   0.000059 |            0 |             0 |
| checking permissions | 0.000009 | 0.000003 |   0.000004 |            0 |             0 |
| Opening tables       | 0.000017 | 0.000009 |   0.000009 |            0 |             0 |
| init                 | 0.000040 | 0.000020 |   0.000020 |            0 |             0 |
| System lock          | 0.000011 | 0.000005 |   0.000006 |            0 |             0 |
| optimizing           | 0.000006 | 0.000003 |   0.000002 |            0 |             0 |
| statistics           | 0.000035 | 0.000017 |   0.000018 |            0 |             0 |
| preparing            | 0.000018 | 0.000009 |   0.000010 |            0 |             0 |
| Creating tmp table   | 0.000047 | 0.000024 |   0.000023 |            0 |             0 |
| Sorting result       | 0.000005 | 0.000002 |   0.000003 |            0 |             0 |
| executing            | 0.000004 | 0.000002 |   0.000002 |            0 |             0 |
| Sending data         | 0.363316 | 0.363466 |   0.000000 |            0 |             0 |
| Creating sort index  | 0.000084 | 0.000079 |   0.000000 |            0 |             0 |
| end                  | 0.000006 | 0.000005 |   0.000000 |            0 |             0 |
| query end            | 0.000009 | 0.000009 |   0.000000 |            0 |             0 |
| removing tmp table   | 0.000007 | 0.000007 |   0.000000 |            0 |             0 |
| query end            | 0.000004 | 0.000004 |   0.000000 |            0 |             0 |
| closing tables       | 0.000007 | 0.000006 |   0.000000 |            0 |             0 |
| freeing items        | 0.000034 | 0.000035 |   0.000000 |            0 |             0 |
| cleaning up          | 0.000018 | 0.000018 |   0.000000 |            0 |             0 |
+----------------------+----------+----------+------------+--------------+---------------+
20 rows in set, 1 warning (0.00 sec)
6.常用查询参数。
-
ALL:显示所有的开销信息。
-
BLOCK IO:显示块IO开销。
-
CONTEXT SWITCHES:上下文切换开销。
-
CPU:显示CPU开销信息。
-
IPC:显示发送和接收开销信息。
-
MEMORY:显示内存开销信息。
-
PAGE FAULTS:显示页面错误开销信息。
-
SOURCE:显示和Source_function,Source_file,Source_line相关的开销信息。
-
SWAPS:显示交换次数开销信息。
7.日常开发需注意的结论。
- converting HEAP to MyISAM:查询结果太大,内存不够,数据往磁盘上搬了。
- Creating tmp table:创建临时表。先拷贝数据到临时表,用完后再删除临时表。
- Copying to tmp table on disk:把内存中临时表复制到磁盘上,危险!!!
- locked。
如果在show profile诊断结果中出现了以上4条结果中的任何一条,则sql语句需要优化。
二、Trace
MySQL5.6版本后提供了对SQL的跟踪工具trace,通过使用trace可以让我们明白optimizer如何选择执行计划的。
同样,开启该功能,会对 MySQL 性能有所影响,因此只建议分析问题时临时开启。
1. 开启
set optimier_trace="enabled=on",end_markers_in_JSON=on;
2. 使用
执行一条查询语句:
mysql> select count(*) from tb_emp_bigdata emp where emp.deptno=101;
+----------+
| count(*) |
+----------+
|     4965 |
+----------+
1 row in set (0.12 sec)
使用trace:
select *from information_schema.optimizer_trace \G
查询结果如下:
*************************** 1. row ***************************QUERY: select count(*) from tb_emp_bigdata emp where emp.deptno=101TRACE: {"steps": [{"join_preparation": {    //预备工作"select#": 1,"steps": [{"expanded_query": "/* select#1 */ select count(0) AS `count(*)` from `tb_emp_bigdata` `emp` where (`emp`.`deptno` = 101)"}] /* steps */} /* join_preparation */},{"join_optimization": {    //开始优化"select#": 1,"steps": [{"condition_processing": {    //where条件处理"condition": "WHERE","original_condition": "(`emp`.`deptno` = 101)","steps": [{"transformation": "equality_propagation","resulting_condition": "multiple equal(101, `emp`.`deptno`)"},{"transformation": "constant_propagation","resulting_condition": "multiple equal(101, `emp`.`deptno`)"},{"transformation": "trivial_condition_removal","resulting_condition": "multiple equal(101, `emp`.`deptno`)"}] /* steps */} /* condition_processing */},{"substitute_generated_columns": {    //替换生成的列} /* substitute_generated_columns */},{"table_dependencies": [   //表的依赖关系{"table": "`tb_emp_bigdata` `emp`","row_may_be_null": false,"map_bit": 0,"depends_on_map_bits": [] /* depends_on_map_bits */}] /* table_dependencies */},{"ref_optimizer_key_uses": [       //使用的键] /* ref_optimizer_key_uses */},{"rows_estimation": [   //行判断{"table": "`tb_emp_bigdata` `emp`","table_scan": {        //扫描表"rows": 498615,"cost": 1828} /* table_scan */}] /* rows_estimation */},{"considered_execution_plans": [{"plan_prefix": [] /* plan_prefix */,"table": "`tb_emp_bigdata` `emp`","best_access_path": {"considered_access_paths": [{"rows_to_scan": 498615,    //需要扫描的行"access_type": "scan","resulting_rows": 498615,"cost": 101551,"chosen": true}] /* considered_access_paths */} /* best_access_path */,"condition_filtering_pct": 100,"rows_for_plan": 498615,"cost_for_plan": 101551,"chosen": true}] /* considered_execution_plans */},{"attaching_conditions_to_tables": {"original_condition": "(`emp`.`deptno` = 101)","attached_conditions_computation": [] /* attached_conditions_computation */,"attached_conditions_summary": [{"table": "`tb_emp_bigdata` `emp`","attached": "(`emp`.`deptno` = 101)"}] /* attached_conditions_summary */} /* attaching_conditions_to_tables */},{"refine_plan": [{"table": "`tb_emp_bigdata` `emp`"}] /* refine_plan */}] /* steps */} /* join_optimization */},{"join_execution": {"select#": 1,"steps": [] /* steps */} /* join_execution */}] /* steps */
}
MISSING_BYTES_BEYOND_MAX_MEM_SIZE: 0INSUFFICIENT_PRIVILEGES: 0
1 row in set (0.00 sec)
3. 关闭
set session optimizer_trace="enabled=off",end_markers_in_JSON=off;
三、全局查询日志
1. 开启
set global general_log=1;
set global log_output='TABLE';
2. 允许查询语句
随便允许查询语句
select * from tb_dept_bigdata;
3. 查看全局查询日志
use mysql;mysql> select * from general_log;
+----------------------------+---------------------------+-----------+-----------+--------------+-------------------------------+
| event_time                 | user_host                 | thread_id | server_id | command_type | argument                      |
+----------------------------+---------------------------+-----------+-----------+--------------+-------------------------------+
| 2021-04-19 16:04:16.924192 | root[root] @ localhost [] |         7 |         0 | Query        | show tables                   |
| 2021-04-19 16:04:29.340680 | root[root] @ localhost [] |         7 |         0 | Query        | select * from tb_dept_bigdata |
| 2021-04-19 16:04:34.387550 | root[root] @ localhost [] |         7 |         0 | Query        | SELECT DATABASE()             |
| 2021-04-19 16:04:34.387735 | root[root] @ localhost [] |         7 |         0 | Init DB      | mysql                         |
| 2021-04-19 16:04:34.388744 | root[root] @ localhost [] |         7 |         0 | Query        | show databases                |
| 2021-04-19 16:04:34.389076 | root[root] @ localhost [] |         7 |         0 | Query        | show tables                   |
| 2021-04-19 16:04:34.389466 | root[root] @ localhost [] |         7 |         0 | Field List   | columns_priv                  |
| 2021-04-19 16:04:34.389814 | root[root] @ localhost [] |         7 |         0 | Field List   | db                            |
| 2021-04-19 16:04:34.390252 | root[root] @ localhost [] |         7 |         0 | Field List   | engine_cost                   |
| 2021-04-19 16:04:34.390482 | root[root] @ localhost [] |         7 |         0 | Field List   | event                         |
| 2021-04-19 16:04:34.390926 | root[root] @ localhost [] |         7 |         0 | Field List   | func                          |
| 2021-04-19 16:04:34.391071 | root[root] @ localhost [] |         7 |         0 | Field List   | general_log                   |
| 2021-04-19 16:04:34.391278 | root[root] @ localhost [] |         7 |         0 | Field List   | gtid_executed                 |
| 2021-04-19 16:04:34.391445 | root[root] @ localhost [] |         7 |         0 | Field List   | help_category                 |
| 2021-04-19 16:04:34.391629 | root[root] @ localhost [] |         7 |         0 | Field List   | help_keyword                  |
| 2021-04-19 16:04:34.391756 | root[root] @ localhost [] |         7 |         0 | Field List   | help_relation                 |
| 2021-04-19 16:04:34.391897 | root[root] @ localhost [] |         7 |         0 | Field List   | help_topic                    |
| 2021-04-19 16:04:34.392103 | root[root] @ localhost [] |         7 |         0 | Field List   | innodb_index_stats            |
| 2021-04-19 16:04:34.392383 | root[root] @ localhost [] |         7 |         0 | Field List   | innodb_table_stats            |
| 2021-04-19 16:04:34.392640 | root[root] @ localhost [] |         7 |         0 | Field List   | ndb_binlog_index              |
| 2021-04-19 16:04:34.392972 | root[root] @ localhost [] |         7 |         0 | Field List   | plugin                        |
| 2021-04-19 16:04:34.393074 | root[root] @ localhost [] |         7 |         0 | Field List   | proc                          |
| 2021-04-19 16:04:34.393469 | root[root] @ localhost [] |         7 |         0 | Field List   | procs_priv                    |
| 2021-04-19 16:04:34.393704 | root[root] @ localhost [] |         7 |         0 | Field List   | proxies_priv                  |
| 2021-04-19 16:04:34.393938 | root[root] @ localhost [] |         7 |         0 | Field List   | server_cost                   |
| 2021-04-19 16:04:34.394107 | root[root] @ localhost [] |         7 |         0 | Field List   | servers                       |
| 2021-04-19 16:04:34.394358 | root[root] @ localhost [] |         7 |         0 | Field List   | slave_master_info             |
| 2021-04-19 16:04:34.395124 | root[root] @ localhost [] |         7 |         0 | Field List   | slave_relay_log_info          |
| 2021-04-19 16:04:34.395438 | root[root] @ localhost [] |         7 |         0 | Field List   | slave_worker_info             |
| 2021-04-19 16:04:34.395886 | root[root] @ localhost [] |         7 |         0 | Field List   | slow_log                      |
| 2021-04-19 16:04:34.396285 | root[root] @ localhost [] |         7 |         0 | Field List   | tables_priv                   |
| 2021-04-19 16:04:34.396534 | root[root] @ localhost [] |         7 |         0 | Field List   | time_zone                     |
| 2021-04-19 16:04:34.396721 | root[root] @ localhost [] |         7 |         0 | Field List   | time_zone_leap_second         |
| 2021-04-19 16:04:34.396910 | root[root] @ localhost [] |         7 |         0 | Field List   | time_zone_name                |
| 2021-04-19 16:04:34.397046 | root[root] @ localhost [] |         7 |         0 | Field List   | time_zone_transition          |
| 2021-04-19 16:04:34.397241 | root[root] @ localhost [] |         7 |         0 | Field List   | time_zone_transition_type     |
| 2021-04-19 16:04:34.397529 | root[root] @ localhost [] |         7 |         0 | Field List   | user                          |
| 2021-04-19 16:04:36.886266 | root[root] @ localhost [] |         7 |         0 | Query        | show tables                   |
| 2021-04-19 16:04:48.678892 | root[root] @ localhost [] |         7 |         0 | Query        | select * from general_log     |
+----------------------------+---------------------------+-----------+-----------+--------------+-------------------------------+
39 rows in set (0.00 sec)
4. 关闭
set global general_log=0;
这篇关于MySQL(8)——Show Profile、Trace和全局查询日志的文章就介绍到这儿,希望我们推荐的文章对编程师们有所帮助!


