本文主要是介绍supervision CV视觉可视化辅助工具,希望对大家解决编程问题提供一定的参考价值,需要的开发者们随着小编来一起学习吧!
参考:
https://supervision.roboflow.com/latest/
https://github.com/roboflow/supervision/tree/develop/examples
版本:
pip install -U supervision
ultralytics-8.1.35 (大于8.1才行,不然可能会有错误AttributeError: ‘Results’ object has no attribute ‘obb’ )
supervision 0.16.0
简单案例:
import cv2
import supervision as sv
from ultralytics import YOLOimage = cv2.imread(...)
model = YOLO('yolov8s.pt')
result = model(image)[0]
detections = sv.Detections.from_ultralytics(result)len(detections)
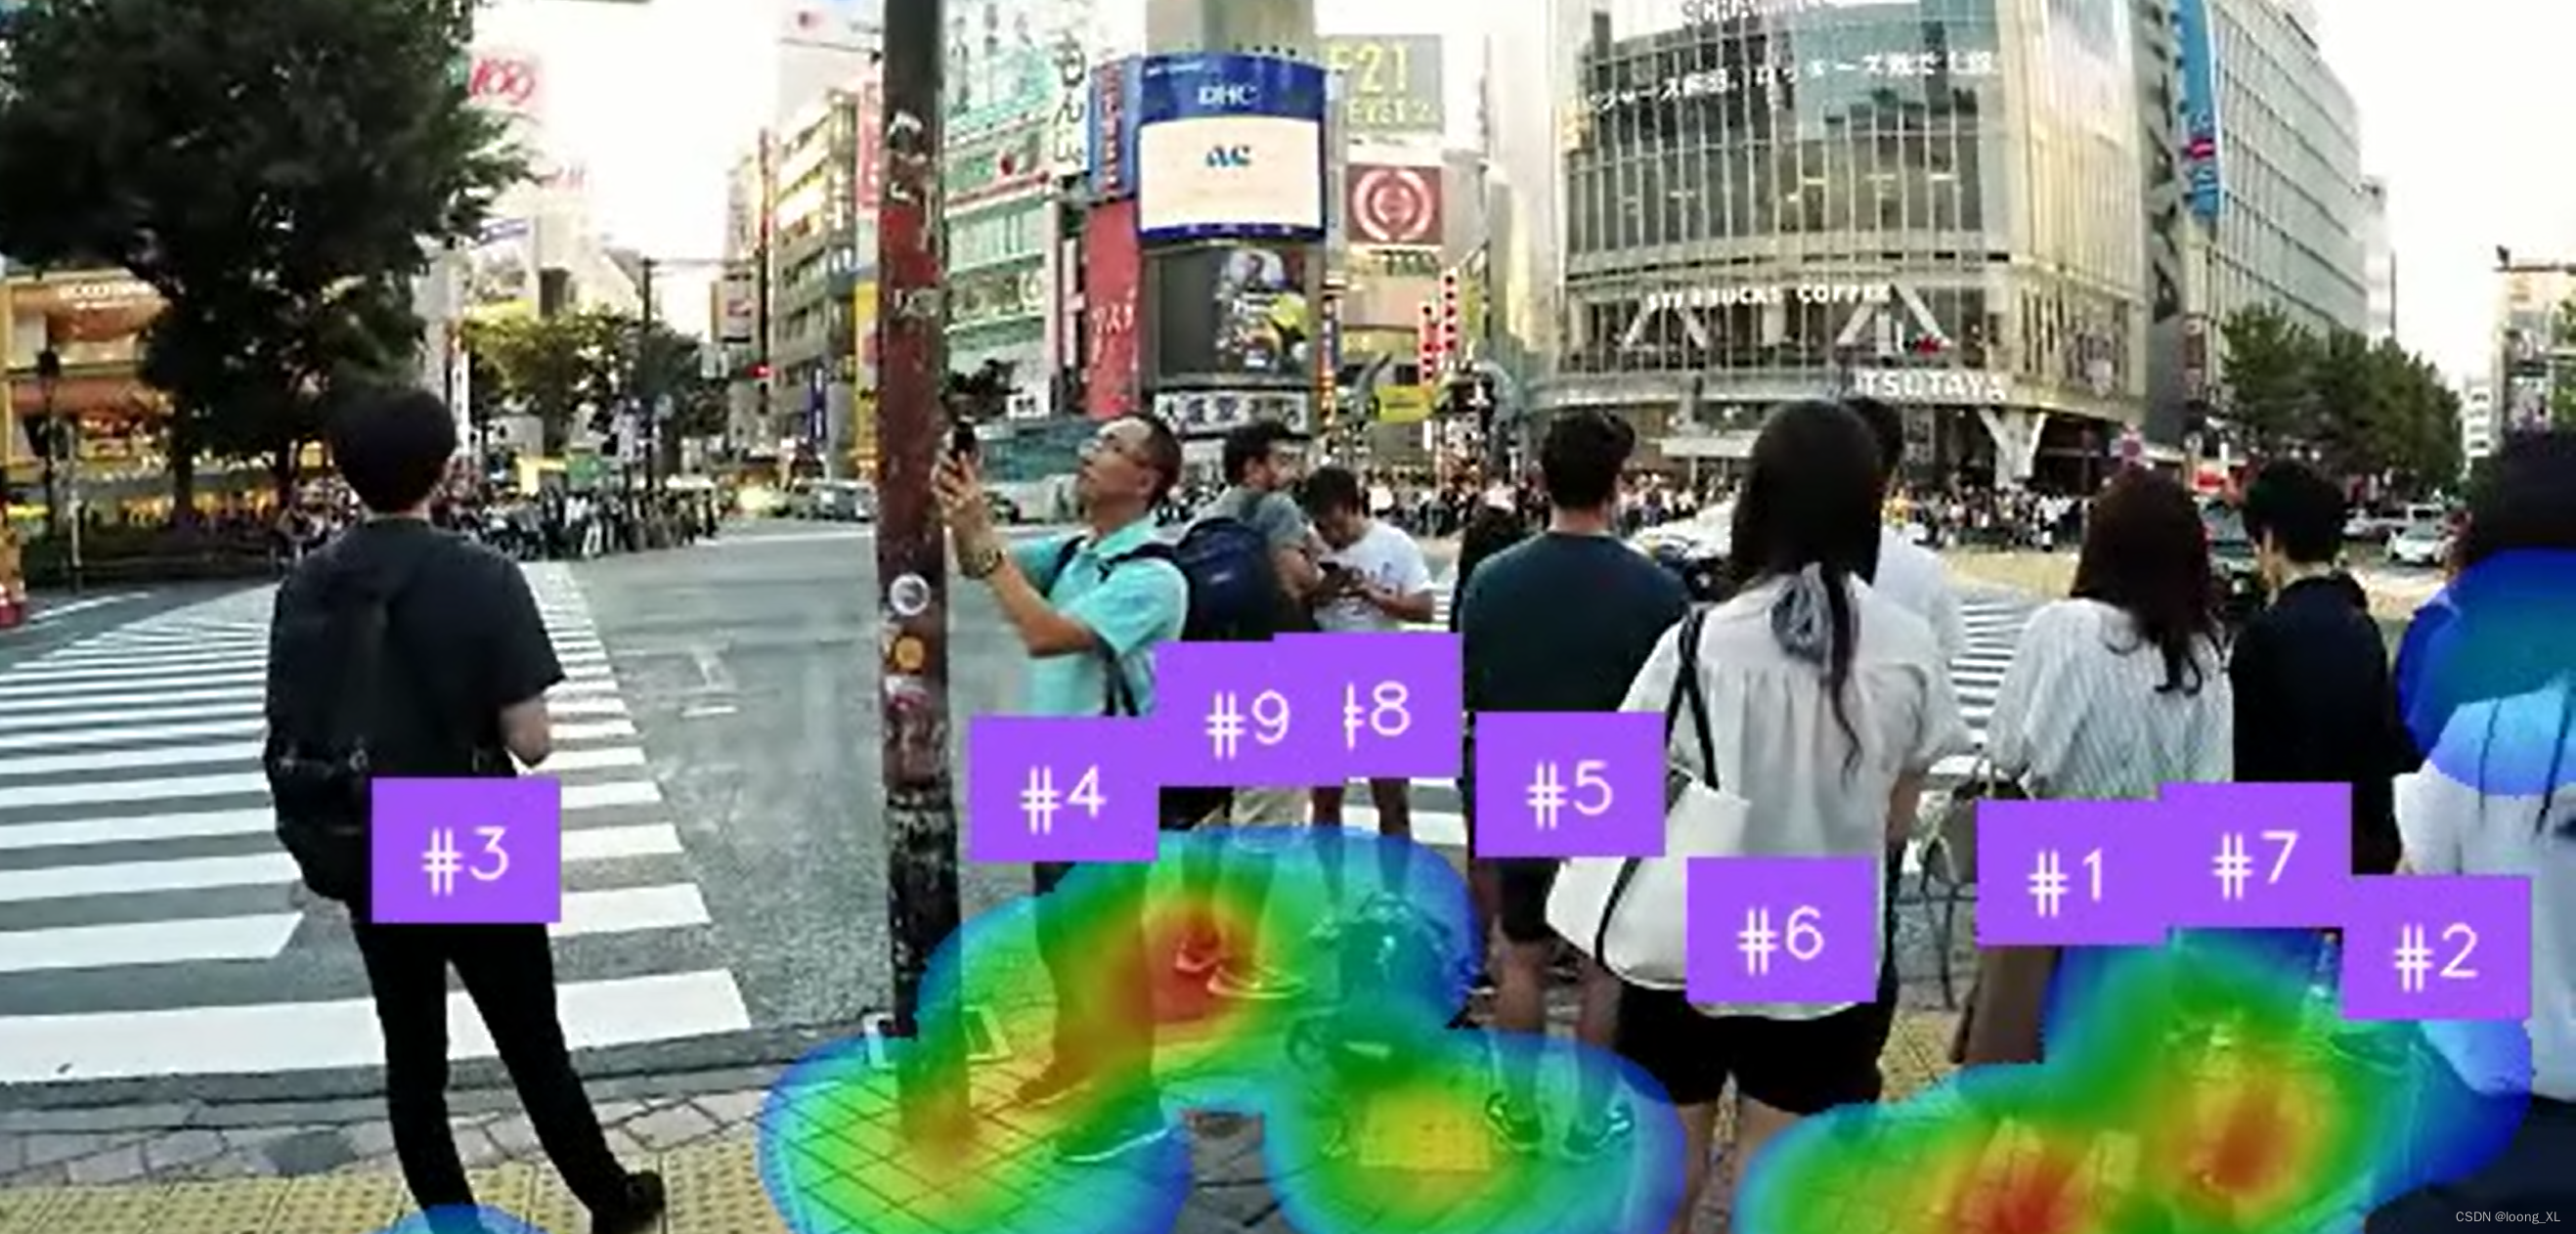
跟踪案例
https://github.com/roboflow/supervision/tree/develop/examples/heatmap_and_track
运行结果:
python D:\opencv2\supervision_cv\test.py --source_weights_path "C:\Users\loong\Downloads\yolov8m (1).pt" --source_video_path "C:\Users\loong\Downloads\istockphoto-1047817112-640_adpp_is.mp4" --confidence_threshold 0.3 --iou_threshold 0.5 --target_video_path output_video.mp4
具体代码:
import argparseimport cv2
from ultralytics import YOLOimport supervision as sv
from supervision.assets import VideoAssets, download_assetsdef download_video() -> str:download_assets(VideoAssets.PEOPLE_WALKING)return VideoAssets.PEOPLE_WALKING.valuedef heatmap_and_track(source_weights_path: str,source_video_path: str,target_video_path: str,confidence_threshold: float = 0.35,iou_threshold: float = 0.5,heatmap_alpha: float = 0.5,radius: int = 25,track_threshold: float = 0.35,track_seconds: int = 5,match_threshold: float = 0.99,
) -> None:### instantiate modelmodel = YOLO(source_weights_path)### heatmap configheat_map_annotator = sv.HeatMapAnnotator(position=sv.Position.BOTTOM_CENTER,opacity=heatmap_alpha,radius=radius,kernel_size=25,top_hue=0,low_hue=125,)### annotation configlabel_annotator = sv.LabelAnnotator(text_position=sv.Position.CENTER)### get the video fpscap = cv2.VideoCapture(source_video_path)fps = int(cap.get(cv2.CAP_PROP_FPS))cap.release()### tracker configbyte_tracker = sv.ByteTrack(track_thresh=track_threshold,track_buffer=track_seconds * fps,match_thresh=match_threshold,frame_rate=fps,)### video configvideo_info = sv.VideoInfo.from_video_path(video_path=source_video_path)frames_generator = sv.get_video_frames_generator(source_path=source_video_path, stride=1)### Detect, track, annotate, savewith sv.VideoSink(target_path=target_video_path, video_info=video_info) as sink:for frame in frames_generator:result = model(source=frame,classes=[0],  # only person classconf=confidence_threshold,iou=iou_threshold,# show_conf = True,# save_txt = True,# save_conf = True,# save = True,device=None,  # use None = CPU, 0 = single GPU, or [0,1] = dual GPU# agnostic_nms=True)[0]detections = sv.Detections.from_ultralytics(result)  # get detectionsdetections = byte_tracker.update_with_detections(detections)  # update tracker### draw heatmapannotated_frame = heat_map_annotator.annotate(scene=frame.copy(), detections=detections)### draw other attributes from `detections` objectlabels = [f"#{tracker_id}"for class_id, tracker_id in zip(detections.class_id, detections.tracker_id)]label_annotator.annotate(scene=annotated_frame, detections=detections, labels=labels)sink.write_frame(frame=annotated_frame)if __name__ == "__main__":parser = argparse.ArgumentParser(description="Heatmap and Tracking with Supervision")parser.add_argument("--source_weights_path",required=True,help="Path to the source weights file",type=str,)parser.add_argument("--source_video_path",default=download_video(),help="Path to the source video file",type=str,)parser.add_argument("--target_video_path",default="output.mp4",help="Path to the target video file (output)",type=str,)parser.add_argument("--confidence_threshold",default=0.35,help="Confidence threshold for the model",type=float,)parser.add_argument("--iou_threshold",default=0.5,help="IOU threshold for the model",type=float,)parser.add_argument("--heatmap_alpha",default=0.5,help="Opacity of the overlay mask, between 0 and 1",type=float,)parser.add_argument("--radius",default=25,help="Radius of the heat circle",type=float,)parser.add_argument("--track_threshold",default=0.35,help="Detection confidence threshold for track activation",type=float,)parser.add_argument("--track_seconds",default=5,help="Number of seconds to buffer when a track is lost",type=int,)parser.add_argument("--match_threshold",default=0.99,help="Threshold for matching tracks with detections",type=float,)args = parser.parse_args()heatmap_and_track(source_weights_path=args.source_weights_path,source_video_path=args.source_video_path,target_video_path=args.target_video_path,confidence_threshold=args.confidence_threshold,iou_threshold=args.iou_threshold,heatmap_alpha=args.heatmap_alpha,radius=args.radius,track_threshold=args.track_threshold,track_seconds=args.track_seconds,match_threshold=args.match_threshold,)
这篇关于supervision CV视觉可视化辅助工具的文章就介绍到这儿,希望我们推荐的文章对编程师们有所帮助!