本文主要是介绍【理解机器学习算法】之Clustering算法(K-Means),希望对大家解决编程问题提供一定的参考价值,需要的开发者们随着小编来一起学习吧!
实现 K-means 聚类从零开始涉及几个关键步骤:初始化质心、将点分配给最近的质心、根据分配更新质心,以及重复这个过程直到收敛。这里是一个基本的 Python 实现:
K-means 算法步骤:
- 初始化质心:从数据点中随机选择 `k` 个初始质心。
- 将点分配给最近的质心:对于数据集中的每个点,找到最近的质心并将该点分配到那个簇中。
- 更新质心:重新计算作为每个簇中所有点的平均值的质心。
- 重复:重复步骤 2 和 3,直到质心不再显著变化,表明算法已经收敛。
import numpy as npdef initialize_centroids(points, k):"""从数据点中随机初始化质心。"""indices = np.random.choice(points.shape[0], k, replace=False)return points[indices]def closest_centroid(points, centroids):"""返回一个数组,包含每个点到最近质心的索引。"""distances = np.sqrt(((points - centroids[:, np.newaxis])**2).sum(axis=2))return np.argmin(distances, axis=0)def update_centroids(points, closest, centroids):"""更新质心为每个簇分配的所有点的平均值。"""new_centroids = np.array([points[closest==k].mean(axis=0) for k in range(centroids.shape[0])])return new_centroidsdef k_means(points, k, max_iters=100):"""实现 K-means 算法。"""centroids = initialize_centroids(points, k)for _ in range(max_iters):closest = closest_centroid(points, centroids)new_centroids = update_centroids(points, closest, centroids)# 检查收敛if np.all(centroids == new_centroids):breakcentroids = new_centroidsreturn centroids, closest# 示例用法
if __name__ == "__main__":# 生成一些数据(例如,在 2D 空间中的两个簇)np.random.seed(42)cluster_1 = np.random.normal(0, 1, (100, 2))cluster_2 = np.random.normal(5, 1, (100, 2))points = np.vstack((cluster_1, cluster_2))# 应用 K-meansk = 2centroids, assignments = k_means(points, k)print("质心:\n", centroids)
K-means 算法的计算成本和时间成本主要依赖于几个因素:数据点的数量、特征的维数、质心的数量(k 值)以及算法迭代次数。算法的时间复杂度通常表示为 O(n*k*i*d),其中 n 是数据点的数量,k 是质心的数量,i 是迭代次数,d 是特征的维数。
计算成本和时间成本:
- 数据点数量(n):数据点越多,每次计算距离和更新质心的时间就越长。
- 质心数量(k):质心越多,计算每个数据点到每个质心的距离的成本就越高。
- 迭代次数(i):算法需要更多的迭代次数来收敛到最终的簇分配,特别是对于初始质心选择不理想或数据分布复杂的情况。
- 特征的维数(d):维度越高,计算距离就越复杂,因此时间成本更高。
局限性:
- 初始质心的选择:K-means 的结果可能对初始质心的选择非常敏感,不同的初始质心可能导致不同的最终簇划分。
- 簇的形状和大小:K-means 假设每个簇在所有方向上的方差都相同,因此它最适合识别球形簇。对于非球形簇或大小差异很大的簇,K-means 可能不会很有效。
- 确定 k 值:在实际应用中,确定最佳的 k 值(即簇的数量)通常是一个挑战。
- 局部最小值:K-means 可能会收敛到局部最优解而不是全局最优解,这意味着算法的结果可能不是最优的簇划分。
由于这些限制,虽然 K-means 在许多情况下都是一个有用和高效的聚类方法,但在应用时需要考虑数据的特性,并可能需要尝试不同的初始质心或使用如 K-means++ 这样的方法来改进初始质心的选择。
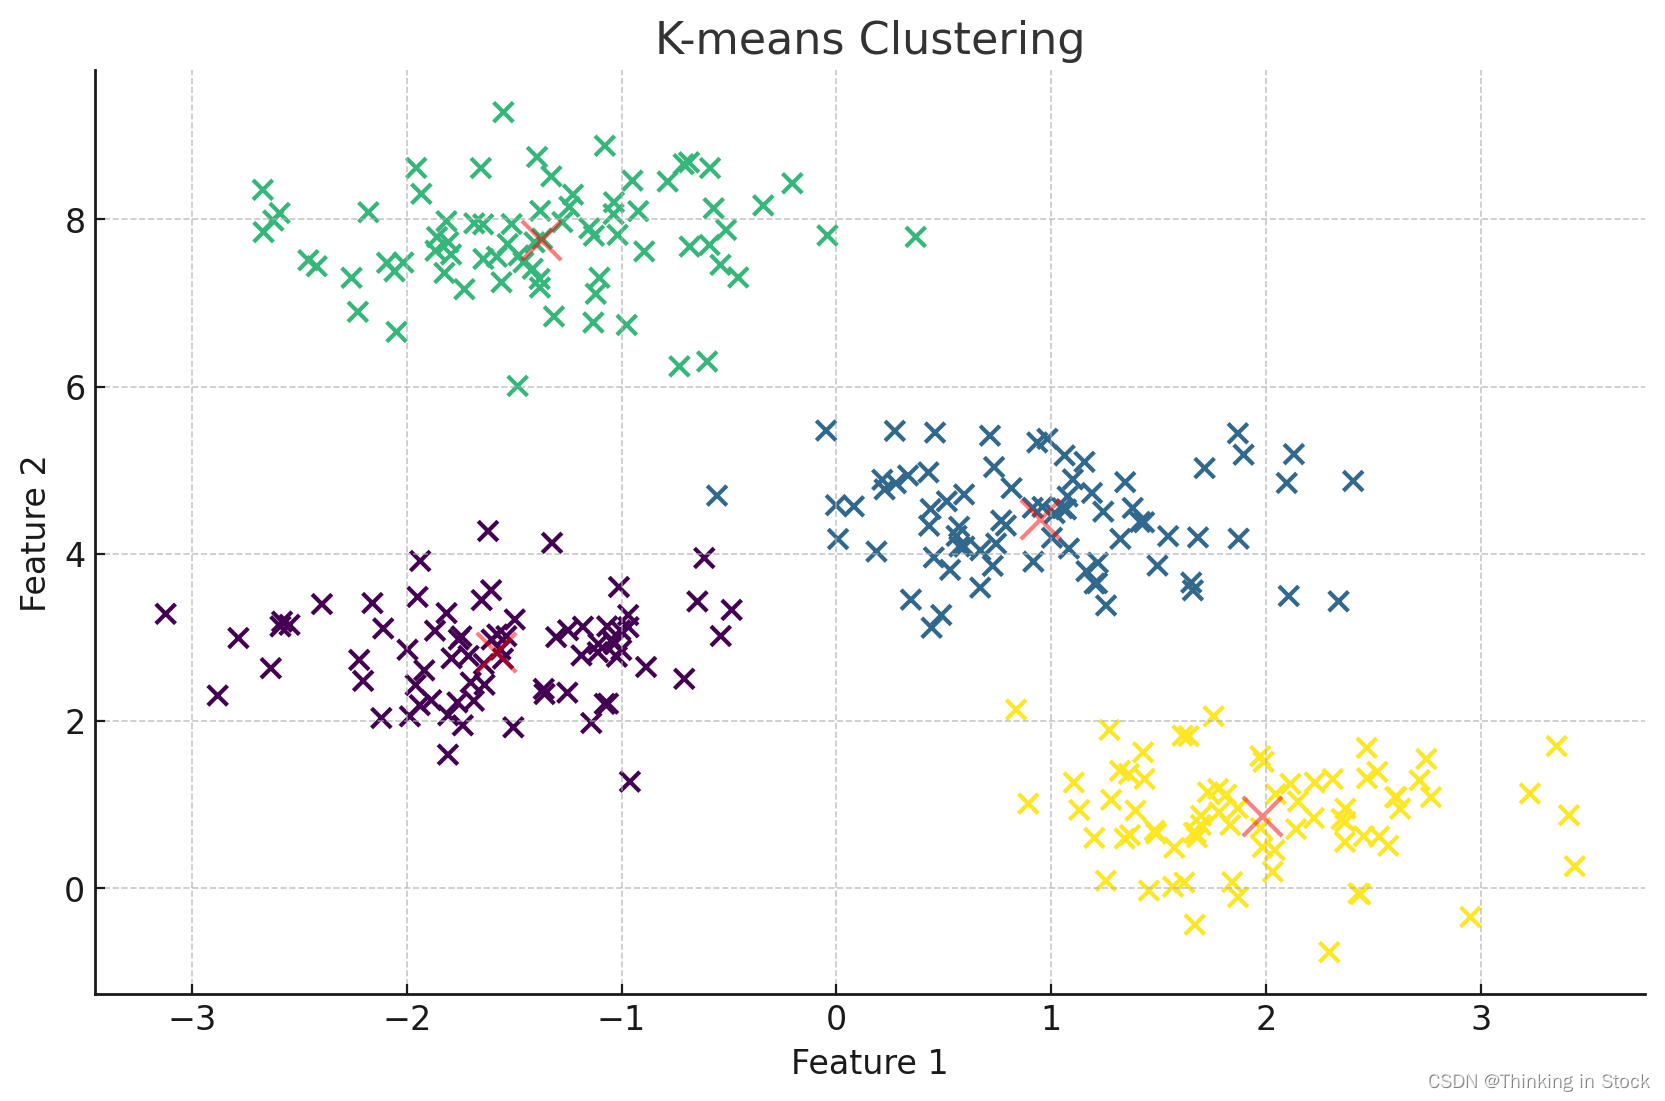
绘制二维的K-means
import matplotlib.pyplot as plt
from sklearn.datasets import make_blobs
from sklearn.cluster import KMeans# Generate synthetic two-dimensional data
X, y_true = make_blobs(n_samples=300, centers=4, cluster_std=0.60, random_state=0)# Apply KMeans clustering
kmeans = KMeans(n_clusters=4)
kmeans.fit(X)
y_kmeans = kmeans.predict(X)# Plot the data points
plt.scatter(X[:, 0], X[:, 1], s=50, c=y_kmeans, cmap='viridis')# Plot the centroids
centers = kmeans.cluster_centers_
plt.scatter(centers[:, 0], centers[:, 1], c='red', s=200, alpha=0.5)
plt.title('K-means Clustering')
plt.xlabel('Feature 1')
plt.ylabel('Feature 2')
plt.show()

这篇关于【理解机器学习算法】之Clustering算法(K-Means)的文章就介绍到这儿,希望我们推荐的文章对编程师们有所帮助!


