本文主要是介绍数据科学导引——AdaBoost对红酒品质预测,希望对大家解决编程问题提供一定的参考价值,需要的开发者们随着小编来一起学习吧!
数据科学导引——红酒品质预测
这个由于当时时间仓促,写的不好,看看就行,现在快考试了,也没时间在完善了,有空再说吧。
一、看看老师给的例题案例
二、检查数据
最近在弄的很多东西都有一个共同点,就是数据要先分析一波!不分析上来就做题,那么很大概率就是瞎弄,为什么?你要处理的东西你自己内心都不太清楚你就按照例题的方法去做你自己的问题,那么很容易出现问题的,例题虽然和题目很像,基本操作给人感觉都一样,但是他们终究只能是一个类型的两道题,之间一定会有差异性。所以拿到数据先观察一波。

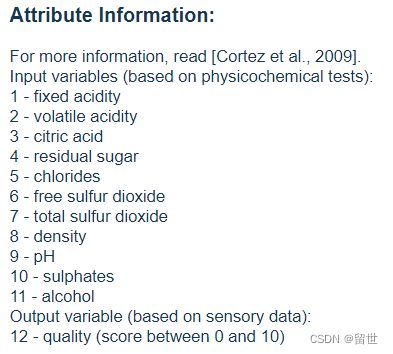
可以看到一共12个属性,我们要做的事就是用AdaBoost对前11个数据进行分析然后给出第12个数据的预测结果。非常完美,思路清晰,再打开数据集看一看
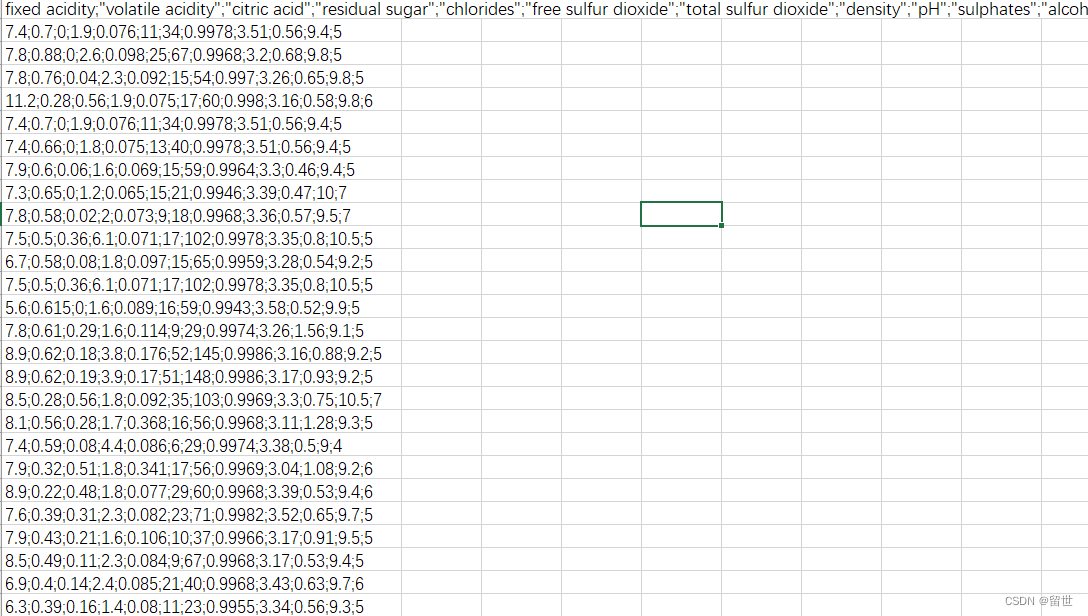
……怎么说呢,我可能需要自己进行一下数据处理了,问题不大。我记得我之前写过一个txt转换为excel的,应该能用,实在不行在那个的基础上修改一下。
from openpyxl import Workbook, load_workbook
book_name_xlsx = r'D:\学习\数据科学导引\第五次作业\红酒品质数据集\data.xlsx'  # 文件路径,把文档路径复制过来即可
wb = Workbook()
wb.save(book_name_xlsx)
# 打开Excel
wb = load_workbook(book_name_xlsx)
# 创建工作簿,导入的新数据会存在当前excel文件下新建一个‘s’的sheet里
sheet = wb.create_sheet('Sheet')
aa = []
f = open(r'D:\学习\数据科学导引\第五次作业\红酒品质数据集\winequality-red.csv', encoding='utf-8')  # 将从文献上的表格数据贴到txt文档中,将txt文档路径复制到此,encoding='utf-8'——编码格式
for line in f.readlines():data = line.split('\n\t')for str in data:sub_str = str.split(';')  # 每个数据间是按什么划分的,我的是两个空格符aa.append(sub_str)
for i in range(len(aa)):sheet.append(aa[i])# 保存文件wb.save(book_name_xlsx)
print("题目写入数据成功!")
事实证明这串代码还是能跑的,只需要稍加修改便可以用到这个新的数据上了。虽然效率有点低,以后有空了写一个通用型的,顺带把效率提高一下,不然每次都要等那么久受不了。当然那都是后话了。
搞定了数据的问题,咱们就把数据读出来
red_wine = pd.read_excel('D:\学习\数据科学导引\第五次作业\红酒品质数据集\data.xlsx')#读取目标数据
print(red_wine.head())

检查数据中是否有空值
print(np.any(red_wine.isnull()))
结果:False
进行不平衡分析和异常值检测
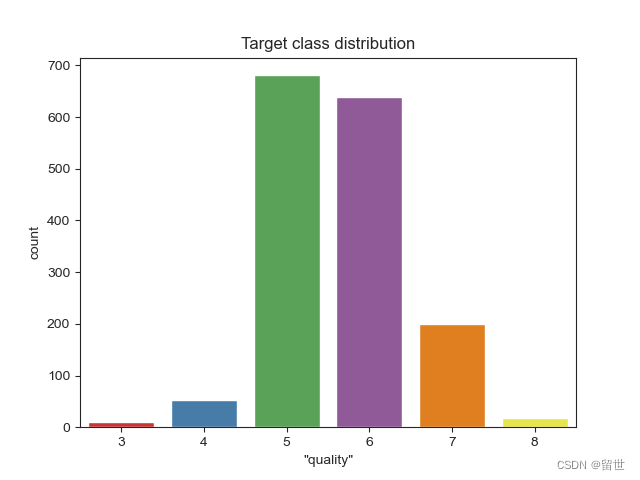
可以看到各个品质的葡萄酒的数量是非常不平衡的,这以为这我们需要对其进行不平衡处理,关于不平衡样本的处理方法我是根据下面那个文章来的
https://blog.csdn.net/huangguohui_123/article/details/105706846
样本不均衡从数据规模的角度分为:
大数据分布不均衡:例如1000万条数据集中,50万条的小类别。
小数据分布不均衡:例如1000条数据集中,10条的小类别。此情况属于严重的数据样本分布不均衡。
可以清楚的看到这个是后者
不平衡的解决方法
1、抽样
1)过抽样
通过增加分类中少数类样本的数量来实现样本均衡,缺点在于:如果样本特征少则可能导致过拟合的问题。可通过在少数类中加入随机噪声、干扰数据或通过一定规则产生新的合成样本
#使用RandomUnderSampler进行欠抽样处理
from imblearn.under_sampling import RandomUnderSampler #欠抽样处理库RandomUnderSamplermodel_RandomUnderSampler=RandomUnderSampler()   #实例化
x_RandomUnderSampler_resampled,y_RandomUnderSampler_resampled=model_RandomUnderSampler.fit_sample(x,y)  #输入数据进行欠抽样处理
y_RandomUnderSampler_resampled=pd.DataFrame(y_RandomUnderSampler_resampled,columns=['label'])RandomUnderSampler_resampled=pd.concat([x_RandomUnderSampler_resampled,y_RandomUnderSampler_resampled],axis=1)  #将特征和标签重新拼接
group_data_RandomUnderSampler=RandomUnderSampler_resampled.groupby(['label'])['label'].count()   #查看标签类别个数
group_data_RandomUnderSampler
2)欠抽样
通过减少分类中多数类样本的数量来实现样本均衡,例如随机去掉一些多数类中的样本,缺点是会丢失多数类样本中的一些重要信息。
#使用RandomUnderSampler进行欠抽样处理
from imblearn.under_sampling import RandomUnderSampler #欠抽样处理库RandomUnderSamplermodel_RandomUnderSampler=RandomUnderSampler()   #实例化
x_RandomUnderSampler_resampled,y_RandomUnderSampler_resampled=model_RandomUnderSampler.fit_sample(x,y)  #输入数据进行欠抽样处理
y_RandomUnderSampler_resampled=pd.DataFrame(y_RandomUnderSampler_resampled,columns=['label'])RandomUnderSampler_resampled=pd.concat([x_RandomUnderSampler_resampled,y_RandomUnderSampler_resampled],axis=1)  #将特征和标签重新拼接
group_data_RandomUnderSampler=RandomUnderSampler_resampled.groupby(['label'])['label'].count()   #查看标签类别个数
group_data_RandomUnderSampler
经过RandomUnderSampler处理后的数据集,减少label=0的样本量,使得label=0的样本量和label=1的样本量相同,从而使分类样本得到平衡。
2、通过正负样本的惩罚权重
核心思想在于:不同样本数量的类别分别赋予不同的权重,小样本量类别权重高,大样本量类别权重低。
使用这种方法无需对样本本身做额外处理,只需在算法模型的参数中进行相应设置即可。如scikit-learn中的SVM为例,通过设置参数class_weight,针对不同类别来手动指定权重。该参数可设置为字典、None或字符串balanced三种模式:
字典:手动指定不同类别的权重,例如{1:10,0:1}
None:代表类别的
如果使用默认的balanced,SVM会将权重设置为与不同类别样本数量呈反比的权重来进行自动均衡处理,公式为:n_samples/n_classes*np.bincount(y)。例如本例:
import numpy as np1000/(2*np.bincount(y))
#使用SVM的权重调节处理不均衡样本
from sklearn.svm import SVC model_svm=SVC(class_weight='balanced')  #创建SVC对象并指定类别权重
model_svm.fit(x,y)
经过设置后,算法自动处理样本分类权重,无须用户做其他处理。要对新数据集做预测,只要调用model_svm模型对象的predict方法即可。
然后我们利用盒图对数据集中的数值型变量进行异常值检测,盒图示意如下:boxplot
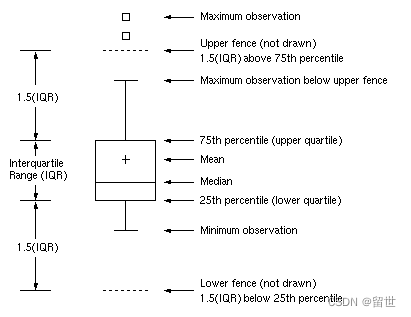
我们先提取出数据集中的数值型变量,然后对所有的数值型变量按不同的目标变量值画出其盒图,如下所示:

f,axarr = plt.subplots(3,4,figsize=(20,15))
sns.set_context("notebook", font_scale=1.8) # 放大横纵坐标标记,更容易看清
sns.stripplot(x='"quality"',y='"fixed acidity"',data=red_wine,jitter=True,ax=axarr[0,0])
sns.boxplot(x='"quality"',y='"fixed acidity"',data=red_wine,ax=axarr[0,0])
sns.stripplot(x='"quality"',y='"volatile acidity"',data=red_wine,jitter=True,ax=axarr[0,1])
sns.boxplot(x='"quality"',y='"volatile acidity"',data=red_wine,ax=axarr[0,1])
sns.stripplot(x='"quality"',y='"citric acid"',data=red_wine,jitter=True,ax=axarr[0,2])
sns.boxplot(x='"quality"',y='"citric acid"',data=red_wine,ax=axarr[0,2])
sns.stripplot(x='"quality"',y='"residual sugar"',data=red_wine,jitter=True,ax=axarr[0,3])
sns.boxplot(x='"quality"',y='"residual sugar"',data=red_wine,ax=axarr[0,3])
sns.stripplot(x='"quality"',y='"chlorides"',data=red_wine,jitter=True,ax=axarr[1,0])
sns.boxplot(x='"quality"',y='"chlorides"',data=red_wine,ax=axarr[1,0])
sns.stripplot(x='"quality"',y='"free sulfur dioxide"',data=red_wine,jitter=True,ax=axarr[1,1])
sns.boxplot(x='"quality"',y='"free sulfur dioxide"',data=red_wine,ax=axarr[1,1])
sns.stripplot(x='"quality"',y='"total sulfur dioxide"',data=red_wine,jitter=True,ax=axarr[1,2])
sns.boxplot(x='"quality"',y='"total sulfur dioxide"',data=red_wine,ax=axarr[1,2])
sns.stripplot(x='"quality"',y='"density"',data=red_wine,jitter=True,ax=axarr[1,3])
sns.boxplot(x='"quality"',y='"density"',data=red_wine,ax=axarr[1,3])
sns.stripplot(x='"quality"',y='"pH"',data=red_wine,jitter=True,ax=axarr[2,0])
sns.boxplot(x='"quality"',y='"pH"',data=red_wine,ax=axarr[2,0])
sns.stripplot(x='"quality"',y='"sulphates"',data=red_wine,jitter=True,ax=axarr[2,1])
sns.boxplot(x='"quality"',y='"sulphates"',data=red_wine,ax=axarr[2,1])
sns.stripplot(x='"quality"',y='"alcohol"',data=red_wine,jitter=True,ax=axarr[2,2])
sns.boxplot(x='"quality"',y='"alcohol"',data=red_wine,ax=axarr[2,2])
plt.tight_layout()
我们可以从盒图中看出 fixed acidity、chiorides、residual sugar、free sulfur dioxide、density 这几个属性异常值较多我们在之后的训练中会将这些异常值去除掉,并讨论去除异常值与不去除异常值对模型训练的影响。
我们画出点对图来分析变量之间的相关关系:
sns.pairplot(red_wine,vars = ['"fixed acidity"','"citric acid"','"free sulfur dioxide"','"total sulfur dioxide"','"density"','"pH"'],hue='"quality"',diag_kind='kde',diag_kws=dict(shade=True),size=6)
plt.savefig("./1.jpg")
plt.show()

这里本来应该是一个11*11的图,但是我提前观察了一下,将一下没有太明显相关性的变量删除了,这张图上可以看出有几个变量之间存在着明显的线性相关性
由于这里没有名义型变量,所以不对其进行处理,如果有需要这边又一串代码可以拿去用于处理名义型变量
f, axarr = plt.subplots(11, figsize=(20, 35))
plt.xticks(fontsize=0.01)
sns.countplot(x='"fixed acidity"', hue='"quality"', data=red_wine, ax=axarr[0])
sns.countplot(x='"volatile acidity"', hue='"quality"', data=red_wine, ax=axarr[1])
sns.countplot(x='"citric acid"', hue='"quality"', data=red_wine, ax=axarr[2])
sns.countplot(x='"residual sugar"', hue='"quality"', data=red_wine, ax=axarr[3])
sns.countplot(x='"chlorides"', hue='"quality"', data=red_wine, ax=axarr[4])
sns.countplot(x='"free sulfur dioxide"', hue='"quality"', data=red_wine, ax=axarr[5])
sns.countplot(x='"total sulfur dioxide"', hue='"quality"', data=red_wine, ax=axarr[6])
sns.countplot(x='"density"', hue='"quality"', data=red_wine, ax=axarr[7])
sns.countplot(x='"pH"', hue='"quality"', data=red_wine, ax=axarr[8])
sns.countplot(x='"sulphates"', hue='"quality"', data=red_wine, ax=axarr[9])
sns.countplot(x='"alcohol"', hue='"quality"', data=red_wine, ax=axarr[10])
plt.tight_layout()
plt.savefig("./2.jpg")
plt.show()
数据清洗
1、检查是否有空数据
print(red_wine.any().isnull())
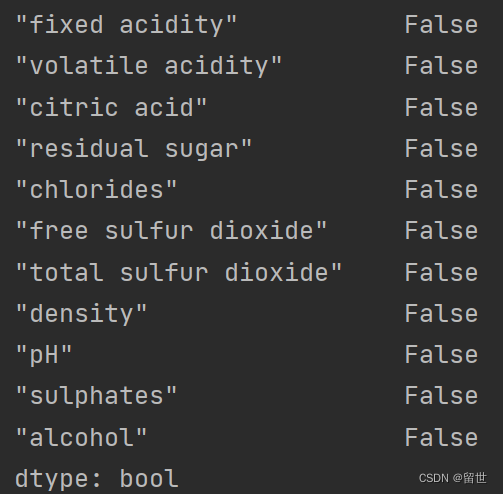
可以看到不存在缺失值。
这里做出这些数据的相关系数矩阵
pMatric =np.corrcoef(red_wine,rowvar=False)
可以直观的看出不同变量之间的相关性。
通过观察可以看到,3,5,8,与红酒最后的评分没有太大的相关性
(0,1),(0,7),(0,8)之间有着比较强的相关性。
因此我决定删除0,3,5,8这几个变量
red_wine_cl = red_wine.copy()   #创建一份拷贝
target = red_wine_cl['"quality"'].copy()
# #去掉一些列
red_wine_cl.drop('"fixed acidity"',axis=1,inplace=True)
red_wine_cl.drop('"residual sugar"',axis=1,inplace=True)
red_wine_cl.drop('"free sulfur dioxide"',axis=1,inplace=True)
red_wine_cl.drop('"pH"',axis=1,inplace=True)
下面我们将定义用于异常值检测的函数,用于模型训练前去除异常值:
#定义异常值检测函数
def detect_outliers(series,whis=1.5):q75,q25 = np.percentile(series,[75,25])iqr = q75 - q25return ~((series - series.median()).abs() <= (whis * iqr))
数据集的划分
这里可以看到我按照三七分划分了数据集
x_train, x_test, y_train, y_test = train_test_split(X, Y, test_size=0.3)
利用随机森林选出最重要的特征-Top 3
由于本样本属性较少就选三个特征属性
model = RandomForestClassifier()
model.fit(X, Y)feature_imp = pd.DataFrame(model.feature_importances_, index=X.columns, columns=["importance"])
feat_rf_3 = feature_imp.sort_values("importance", ascending=False).head(3).index
print(list(feat_rf_3))
[‘“alcohol”’, ‘“total sulfur dioxide”’, ‘“sulphates”’]
可以看到红酒的品质由以上三个变量主要决定
利用 χ2 检验进行单变量的特征选择-Top 20
#首先对变量进行0-1标准化
X_minmax = MinMaxScaler(feature_range=(0,1)).fit_transform(X)
X_scored = SelectKBest(score_func=chi2, k='all').fit(X_minmax, Y)
feature_scoring = pd.DataFrame({'feature': X.columns,'score': X_scored.scores_})
feat_chi2_20 = feature_scoring.sort_values('score', ascending=False).head(20)['feature'].values
list(feat_chi2_20)
[‘“alcohol”’, ‘“volatile acidity”’, ‘“citric acid”’]
容易看出 χ2 检验得到的变量重要程度排序与随机森林得到的重要程度排序不同,下面我们再试试RFE方法。
利用RFE方法选择特征-Top 3
RFE叫做递归特征排除法,是Recursive Feature Elimination的简写,也是一种常用的特征选择方法。
rfe = RFE(LogisticRegression(), 20)
rfe.fit(X, Y)
feature_rfe_scoring = pd.DataFrame({'feature': X.columns,'score': rfe.ranking_})
feat_rfe_20 = feature_rfe_scoring[feature_rfe_scoring['score'] == 1]['feature'].values
list(feat_rfe_20)
[‘“volatile acidity”’, ‘“chlorides”’, ‘“sulphates”’]
也不一样
我们将以上三种方式得到的Top 3小结一下:
feature_scoring = pd.DataFrame({'feat_rf_20': feat_rf_20,'feat_chi2_20': feat_chi2_20,'feat_rfe_20': feat_rfe_20})
feature_scoring
[‘“volatile acidity”’, ‘“chlorides”’, ‘“sulphates”’]
feat_rf_20 feat_chi2_20 feat_rfe_20
0 “alcohol” “alcohol” “volatile acidity”
1 “total sulfur dioxide” “volatile acidity” “chlorides”
2 “sulphates” “citric acid” “sulphates”
我们将以上几种方式联合起来进行特征选择:
features = np.hstack([feat_var_threshold, feat_rf_3,feat_chi2_3,feat_rfe_3])
features = np.unique(features)
print('Final features set:\n')
for f in features:print("-{}".format(f))
结果如下
Final features set:
-“alcohol”
-“chlorides”
-“citric acid”
-“sulphates”
-“total sulfur dioxide”
-“volatile acidity”
4.PCA降维
由于本人的维数不是很高,所以不要需要再降维了,再将就没了。这里把方法粘贴一下
根据第三部分特征选择得到的变量重新整理数据框训练集kobe_cl和测试集kobe_submit:
kobe_cl = kobe_cl.ix[:, features]
kobe_submit = kobe_submit.ix[:, features]
X = X.ix[:, features]
print(‘完整数据集shape: {}’.format(kobe_cl.shape))
print(‘测试集shape: {}’.format(kobe_submit.shape))
print(‘训练集shape: {}’.format(X.shape))
print(‘目标标签shape: {}’.format(Y.shape))
完整数据集shape: (30697, 63)
测试集shape: (5000, 63)
训练集shape: (25697, 63)
目标标签shape: (25697,)
62个变量过多,我们需要在模型训练前进行降维,使得维度减为8:
components = 8
pca = PCA(n_components = components).fit(X)
我们来看一下每个变量对目标变量方差的解释程度:
pca_variance_explained_df = pd.DataFrame({
“component”: np.arange(1, components+1),
“variance_explained”: pca.explained_variance_ratio_
})
ax = sns.barplot(x=‘component’,
y=‘variance_explained’,
data=pca_variance_explained_df,
palette=“Set1”, )
ax.set_title(“PCA - Variance explained”)
<matplotlib.text.Text at 0x11ff0acf8>
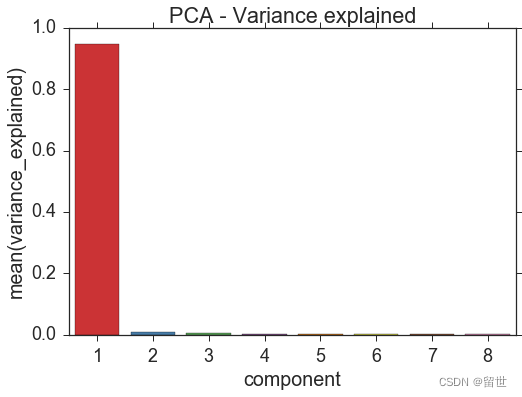
我们只取前两个主成分,命名为x1和x2,并在二维特征空间中画出散点图:
X_pca = pd.DataFrame(pca.transform(X)[:,:2])
X_pca[‘target’] = Y.values
X_pca.columns = [“x1”, “x2”, “target”]
sns.lmplot(‘x1’,‘x2’,
data=X_pca,
hue=“target”,
fit_reg=False,
markers=[“o”, “x”],
palette=“Set1”,
size=6,
)
<seaborn.axisgrid.FacetGrid at 0x1228e6550>

可以看出主成分x1对target的影响,在 [−70,−20] 范围内几乎全为投失的情况,在 [−20,20] 部分为投中,部分为投失,而x2对投球的决定作用要比x1小非常多。
5.AdaBoost模型训练
这里直接套用 AdaBoostClassifier训练
model = AdaBoostClassifier(n_estimators=6, algorithm='SAMME', random_state=0, learning_rate=1)# 训练模型
model.fit(x_train, y_train)
# 获得 训练集和测试集 得分
print(model.score(x_train, y_train))
print(model.score(x_test, y_test))

这里呢我们再用其他几个模型比较一下,看看其他的性能如何
结果如下:
LR: (0.569) +/- (0.008)
LDA: (0.587) +/- (0.019)
K-NN: (0.525) +/- (0.017)
CART: (0.583) +/- (0.011)
NB: (0.574) +/- (0.034)
可以直接的看到LR,LDA,CART ,NB比这个模型要优秀
# 模型包括逻辑回归、线性判别分析、K近邻、决策树和朴素贝叶斯
models = []
models.append(('LR', LogisticRegression()))
models.append(('LDA', LinearDiscriminantAnalysis()))
models.append(('K-NN', KNeighborsClassifier(n_neighbors=5)))
models.append(('CART', DecisionTreeClassifier()))
models.append(('NB', GaussianNB()))
# 对每个模型计算其cross_cal_score
results = []
names = []
for name, model in models:cv_results = cross_val_score(model, x_train, y_train )results.append(cv_results)names.append(name)print("{0}: ({1:.3f}) +/- ({2:.3f})".format(name, cv_results.mean(), cv_results.std()))
这篇关于数据科学导引——AdaBoost对红酒品质预测的文章就介绍到这儿,希望我们推荐的文章对编程师们有所帮助!


