本文主要是介绍echarts vue 动画效果的水球图、波浪图教程,希望对大家解决编程问题提供一定的参考价值,需要的开发者们随着小编来一起学习吧!
1、安装插件
前提是已经安装了echarts(我的版本是4.2.1)
npm install echarts-liquidfill --save
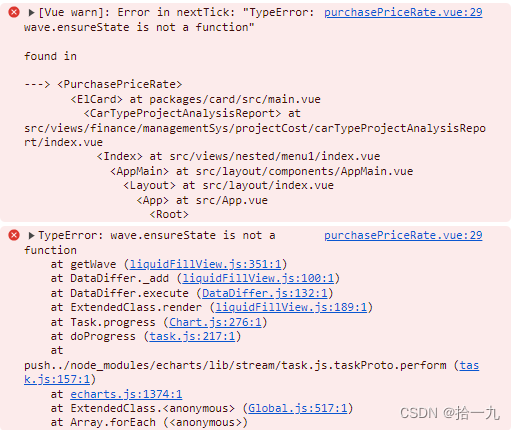
我安装了3.1.0版本的,结果运行时报错"TypeError: wave.ensureState is not a function"

原因:echarts版本和echarts-liquidfill的版本对应不上,根据下面的搭配版本安装就不会报错了
echarts@4.9.0 + echarts-liquidfill@2.0.6
echarts@5.2.0 + echarts-liquidfill@3.0.0
我安装了指定版本npm install echarts-liquidfill@2.0.6 --save
2、示例
2.1 效果图
里面的波浪有动画效果

2.2 代码实现
<template><div id="main" style="width: 110px; height: 110px;"></div>
</template>
import echarts from 'echarts';
import 'echarts-liquidfill';var chart = echarts.init(document.getElementById('architectureTarget'));
let option = {series: [{type: 'liquidFill',radius: '95%', // 波浪样式,不设置则为平直样式waveAnimation: true,direction: 'right', // 向右移动data: [{value: 0.85,itemStyle: {normal: {color: '#558bec'}},}],outline: {borderDistance: 7, // 外部轮廓与图表的距离itemStyle: {borderColor: '#558bec', // 边框的颜色borderWidth: 6, // 边框的宽度shadowBlur: 0, // 外部轮廓的阴影范围 一旦设置了内外都有阴影, 设为0可以去掉容器灰色背景},},label: { // 数据展示样式show: true,color: '#333',insideColor: '#fff',fontSize: 28,fontWeight: 600,align: 'center',baseline: 'middle',position: 'inside',},}]
};
option && charts.setOption(option);
这篇关于echarts vue 动画效果的水球图、波浪图教程的文章就介绍到这儿,希望我们推荐的文章对编程师们有所帮助!


