本文主要是介绍奇异值分解(SVD)的应用——图像压缩,希望对大家解决编程问题提供一定的参考价值,需要的开发者们随着小编来一起学习吧!
SVD方法是模型降阶的一类重要方法,本征正交分解(POD)和平衡截断(BT)都属于SVD类方法。

要想深入了解模型降阶技术,我们可以先从SVD的应用入手,做一个直观的了解。
1. SVD的定义和分类


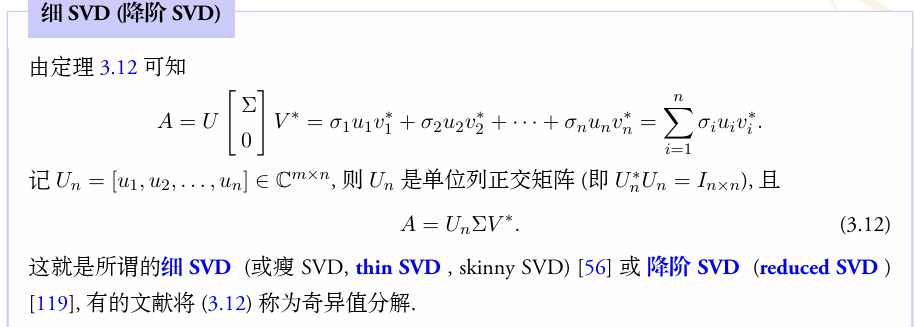
我们想寻找一个A的逼近:Ak,使得rank(Ak) = k < n,且|A - Ak|最小。
下面的定理(也称为Schmidt-Mirsky, Eckart-Young定理)说明矩阵A的低秩逼近可以用SVD实现:

2. SVD在图像压缩中的应用
原始图片, rank=720:

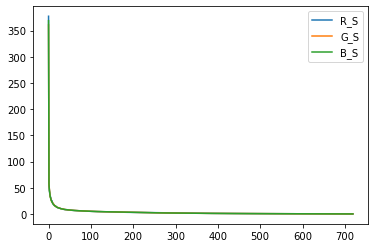
绘制其R,G,B的特征值:

压缩图片,rank=144:

压缩图片,rank=72:

代码:
import numpy as np
import matplotlib.pyplot as plt
import matplotlib.image as imageA = image.imread("svd-image-compression-img.jpg")# Each pixel (typically) consists of 3 bytes — for the red, green and blue components of the color, respectively.
# So, if we want to efficiently store the image, we need to somehow efficiently encode 3 matrices R, G and B
# for each color component, respectively.
# We can extract the 3 color component matrices as briefly mentioned above as follows:
# 0xff代表十进制数值255
R = A[:,:,0] / 0xff
G = A[:,:,1] / 0xff
B = A[:,:,2] / 0xff# Now, we compute the SVD decomposition:
R_U, R_S, R_VT = np.linalg.svd(R)
G_U, G_S, G_VT = np.linalg.svd(G)
B_U, B_S, B_VT = np.linalg.svd(B)# polt the singular values
xaxis = np.arange(0, len(R_S))
plt.plot(xaxis, R_S, label='R_S')
plt.plot(xaxis, G_S, label='G_S')
plt.plot(xaxis, B_S, label='B_S')
plt.legend()relative_rank = 0.1
max_rank = int(relative_rank * min(R.shape[0], R.shape[1]))
print("max rank = %d" % max_rank)  # 144def read_as_compressed(U, S, VT, k):Ak = np.zeros((U.shape[0], VT.shape[1]))for i in range(k):U_i = U[:,[i]]VT_i = np.array([VT[i]])Ak += S[i] * (U_i @ VT_i)return Ak## Actually, it is easier and more efficient to perform the same operation
## with a lower-rank matrix multiplication.
# def read_as_compressed(U, S, VT, k):
#     return (U[:,:k] @ np.diag(S[:k])) @ VT[:k]R_compressed = read_as_compressed(R_U, R_S, R_VT, max_rank)
G_compressed = read_as_compressed(G_U, G_S, G_VT, max_rank)
B_compressed = read_as_compressed(B_U, B_S, B_VT, max_rank)compressed_float = np.dstack((R_compressed, G_compressed, B_compressed))
compressed = (np.minimum(compressed_float, 1.0) * 0xff).astype(np.uint8)# Plot
plt.figure()
plt.imshow(A)plt.figure()
plt.imshow(compressed)image.imsave("compressed.jpg", compressed)
参考资料:
这篇关于奇异值分解(SVD)的应用——图像压缩的文章就介绍到这儿,希望我们推荐的文章对编程师们有所帮助!


