XDebug

2024-01-28 10:58
文章标签 xdebug

本文主要是介绍XDebug,希望对大家解决编程问题提供一定的参考价值,需要的开发者们随着小编来一起学习吧!

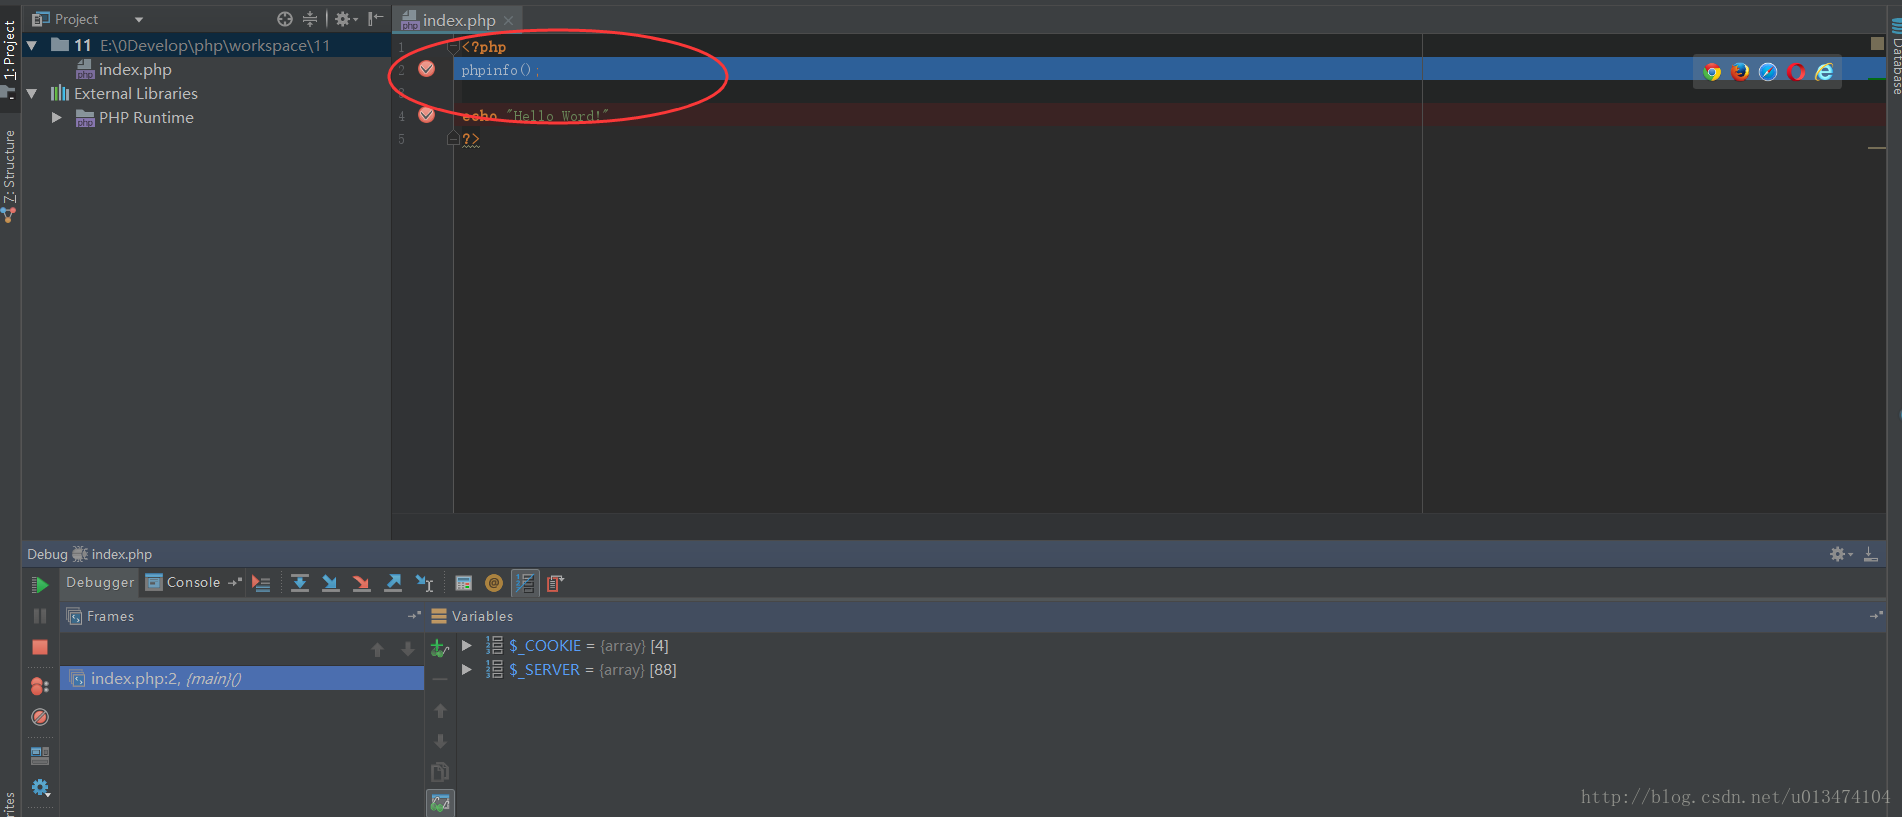
XDebug的下载可以到 http://xdebug.org/download.php 下载
XDebug的配置, 这个主要是在PHP.ini文件中进行配置,具体需要配置的项目如下:
[Xdebug]
zend_extension = "C:/php/ext/php_xdebug-2.2.3-5.4-vc9.dll"
xdebug.auto_trace= "On"
xdebug.collect_params= "On"
xdebug.collect_return= "On"
xdebug.trace_output_dir="D:/PHPWeb/xdebug/trace"
xdebug.profiler_enable= "true"
xdebug.profiler_output_dir="D:/PHPWeb/xdebug/profiler"
xdebug.profiler_append = 1
xdebug.profiler_enable_trigger = 1
xdebug.profiler_output_name = "cachegrind.out.%t-%s"xdebug.remote_enable= "On"  
xdebug.remote_autostart = "On"   
xdebug.remote_host=10.92.22.152 
xdebug.remote_port=19000 
xdebug.remote_handler = "dbgp"


 在PHP.ini尾部完整增加这些说明语句, 重新启动Apache;
注意两点:   
1 remote_port=19000,   默认XDebug的port端口为9000, 为了防止其他程序占用该端口, 
因此修改为19000,但是要注意这里的Port一定要和Zend Studio中的XDebug的端口设置一致, 否则不能调试成功!!!
2 remote_host=10.92.22.152,  这里要看你的网络环境,如果是局域网的话,一定要配置为你的IP地址,而不能仅配置为127.0.0.1

这篇关于XDebug的文章就介绍到这儿,希望我们推荐的文章对编程师们有所帮助!


http://www.chinasem.cn/article/653435

相关文章

php 7之PhpStorm + Nginx + Xdebug运行调试

操作环境: windows PHP 7.1.10 PhpStorm-2017.2.4 Xdebug 2.5.4 Xdebug helper 1.6.1 nginx-1.12.2 注意查看端口占用情况 netstat -ano //查看所以端口netstat -aon|findstr "80" //查看指定端口占用情况 比如80端口查询情况 TCP 0.0.0.0:8

Java远程调试 java -Xdebug各参数说明

用处:如果用命令执行某个项目中包含某个xxx.jar,然后有问题,你想去调试。那么你可以在命令启动的时候设置监听的端口12345,然后在编辑工具中如eclipse ,debug xxx.jar的原码并连接到 12345,然后请求项目时,就会在元源码中调试。 首先,JAVA自身支持调试功能,并提供了一个简单的调试工具--JDB,类似于功能强大的GDB,JDB也是一个字符界面的  调试环境,并

Xdebug+phpstorm配置

Xdebug+phpstorm配置 近期在做有关PHP的项目,IDE为phpstorm,之前做C#的时候,vs的调试功能很是喜欢,于是开始查找有关phpstorm调试的相关资料。由于之前是做桌面应用程序,以为web程序的调试和桌面程序相差无几,但是我错了,原来还需要浏览器相互配合的,下面把自己的调试环境配置过程记录下来,纠结了一个下午,好歹有点收获吧!   首先,把自己参考的

PHP的xdebug調試安裝

再次配置安装PHPstorm的xdebug 安装PHP对应版本xdebug扩展 1、通过PHPinfo确定php的扩展文件 Architecture x86 是32位的Zend Extension Build API320160303,NTS,VC14是没有TS的VC14 2、选择32位VC14的扩展文件下载 下载地址 PHP 7.1 VC14 (32 bit) 3、配置PH

php--xdebug安装失败

apache的错误日志老出现: Warning: DocumentRoot [D:/webserver/apache2.2/docs/dummy-host2.localhost] does not exist httpd.exe: Could not reliably determine the server's fully qualified domain name, using 19

xdebug详解及在vscode应用

Xdebug在vscode中的应用 优点:仅仅只需在vscode安装php debug插件,完全零配置,不需要在浏览器端装任何(即不需要担心http会话,浏览器传一些变量参数,设置idekey之类)插件。所需要的只是:打开vscode打断点后,按F5打开调试按钮运行,然后浏览器访问,再进入代码即可。 php.ini仅仅只需要开启以下两项配置,其他皆用默认值就够用了(前提安装好了扩展) xdeb

phpstorm配置Xdebug 步过 步入 步出意思

步过,就是遇到方法,不进入,直接下一行步入,就是遇到函数会进入函数步出,就是运行到退出本函数、返回上一级的下一行

phpstorm +xdebug+wampserver环境搭建

1、phpstrom 官网下载安装包 2、分别下载xdebug wampser安装 3、修改php.ini加入 xdebug.remote_enable = On xdebug.remote_handler = "dbgp" xdebug.remote_host = "localhost" xdebug.remote_port = 9000 xdebug.idekey = PHPSTROM

xdebug安装及配置phpStorm

MAC安装xdebug #查找php路径which is php #进入路径适用./pecl 自动安装匹配的xdebug扩展cd /usr/local/bin ./pecl install xdebug#配置php.ini php --ini (获取地址)vim /usr/local/etc/php/7.1/php.ini#写入以下内容xdebug.remote_enable =

win下php7.2安装xdebug和php-redis

先通过phpinfo()查看自己的php信息 确定我的版本为:7.2-nts-vc15-x86 1、安装xdebug https://xdebug.org/download.php 下载对应的版本dll文件 将dll文件复制到php文件夹的ext文件夹内 修改php.ini,添加 zend_extension=php_xdebug-2.7.0beta1-7.2-vc15-nts.