本文主要是介绍【金融数据分析】计算2023年沪深300成分股涨跌排行榜,希望对大家解决编程问题提供一定的参考价值,需要的开发者们随着小编来一起学习吧!
前言
之前的文章中我们已经获取了沪深300成分股的详细个股数据,本文我们来计算一下2023年成分股的涨跌排行榜。
首先看一下效果

详细代码
首先说一下后端的代码,涨跌幅的计算公式如下:
(2023年最后一天的收盘价-2023年第一天的收盘价)/ 2023年第一天的收盘价
计算完所有股票的涨跌幅后,再进行排序即可。
主要的函数如下
// 将查询的数据缓存到内存中private List<CSI300RankVO> cache = new ArrayList<>();// 查询沪深300成分股2023年涨跌排行榜public synchronized List<CSI300RankVO> query2023rank(int type, int limit) {// 首先将所有的股票查出来List<StockOptionVO> allCode = getAllCode();List<CSI300RankVO> csi300RankVOList = new ArrayList<>();if (cache.size() == 0) {log.info("需要重新计算数据");// 根据股票代码查询所有股票的涨跌幅for (int i = 0; i < allCode.size(); i++) {// 去除掉沪深300指数本身if (allCode.get(i).getCode().equals("399300")) {continue;}List<StockEntity> stockEntities = sqLiteStockDao.queryAllByCodeAndYear(allCode.get(i).getCode(), "2023");CSI300RankVO csi300RankVO = new CSI300RankVO();csi300RankVO.setCode(allCode.get(i).getCode());csi300RankVO.setName(allCode.get(i).getName());Double rise = (stockEntities.get(0).getClose_price() - stockEntities.get(stockEntities.size() - 1).getClose_price()) / stockEntities.get(stockEntities.size() - 1).getClose_price();rise = rise * 100;String str = String.format("%.2f", rise);rise = Double.parseDouble(str);csi300RankVO.setRise(rise);csi300RankVOList.add(csi300RankVO);}log.info("填充数据");// 将数据填充到缓存中for (int i=0; i<csi300RankVOList.size(); i++) {cache.add(csi300RankVOList.get(i));}} else {log.info("缓存中已存在数据,不需要重新计算");for (int i=0; i<cache.size(); i++) {csi300RankVOList.add(cache.get(i));}}// type==1查询涨幅if (type == 1) {// 按照涨幅升序排序Collections.sort(csi300RankVOList, new Comparator<CSI300RankVO>() {@Overridepublic int compare(CSI300RankVO o1, CSI300RankVO o2) {if (o1.getRise() > o2.getRise()) {return -1;} else if (o1.getRise() == o2.getRise()) {return 0;} else {return 1;}}});} else if (type == 2) { // type==2查询跌幅Collections.sort(csi300RankVOList, new Comparator<CSI300RankVO>() {@Overridepublic int compare(CSI300RankVO o1, CSI300RankVO o2) {if (o1.getRise() > o2.getRise()) {return 1;} else if (o1.getRise() == o2.getRise()) {return 0;} else {return -1;}}});}// 最后取limit个数据返回List<CSI300RankVO> result = new ArrayList<>();for (int i=0; i<limit; i++) {if (i > csi300RankVOList.size()-1) {return result;}if (type == 1 && csi300RankVOList.get(i).getRise()<0) { // 查询涨幅return result;}if (type == 2 && csi300RankVOList.get(i).getRise()>0) { // 查询跌幅return result;}result.add(csi300RankVOList.get(i));}return result;}由于计算的时候很慢,所以当第一次算完后就将结果保存在内存中,下一次再查询就不需要重复计算了。
接着是前端的代码,就是两张表格还有一个现实echarts图表的div
<template><div><el-row class="container"><div class="left-grid"><el-card class="box-card"><template #header><div class="card-header"><span>涨幅排行榜</span></div></template><el-tablev-loading="loading1":data="rise_data":show-header="true":max-height="500"stripe><el-table-columntype="index"label="排名"width="65%"></el-table-column><el-table-columnprop="name"label="公司简称"width="85%"></el-table-column><el-table-columnprop="rise"label="涨幅"width="85%":formatter="formatter"></el-table-column><el-table-column prop="industry" label="操作"><template #default="scope"><el-buttontype="primary"size="small"@click="queryData(scope.row)">查看</el-button></template></el-table-column></el-table></el-card><el-card><template #header><div class="card-header"><span>跌幅排行榜</span></div></template><el-tablev-loading="loading2":data="fall_data":show-header="true":max-height="500"stripe><el-table-columntype="index"label="排名"width="65%"></el-table-column><el-table-columnprop="name"label="公司简称"width="85%"></el-table-column><el-table-columnprop="rise"label="跌幅"width="85%":formatter="formatter"></el-table-column><el-table-column prop="industry" label="操作"><template #default="scope"><el-buttontype="primary"size="small"@click="queryData(scope.row)">查看</el-button></template></el-table-column></el-table></el-card></div><div class="right-grid" ref="myChart"></div></el-row></div>
</template><script>
import axios from "axios";
import { ElMessage } from "element-plus";
import { getCurrentInstance } from "vue";
export default {data() {return {// 涨幅排行榜rise_data: [],loading1: true,// 跌幅排行榜fall_data: [],// 个股详细数据stock_data: [],loading2: true,table_title: "",echarts: getCurrentInstance().appContext.config.globalProperties.$echarts,};},mounted() {this.init();},methods: {init() {var url1 = "http://localhost:9001/stock/query2023rank/1/10";axios.get(url1).then((response) => {this.rise_data = response.data;console.log(response);this.loading1 = false;}).catch((error) => {console.log(error);this.loading1 = false;});var url2 = "http://localhost:9001/stock/query2023rank/2/10";axios.get(url2).then((response) => {this.fall_data = response.data;console.log(response);this.loading2 = false;}).catch((error) => {console.log(error);this.loading2 = false;});},// 绘制折线图create_axis() {//3.初始化实例对象 echarts.init(dom容器)var data_xAxis = [];var data_yAxis = [];for (var i = this.stock_data.length - 1; i >= 0; i--) {data_xAxis.push(this.stock_data[i].record_date);data_yAxis.push(this.stock_data[i].close_price);}console.log(data_xAxis);console.log(data_yAxis);var dom = this.$refs["myChart"]; // 获取dom节点var myChart = this.echarts.init(dom);//4.指定配置项和数据var option = {tooltip: {trigger: "axis",position: function (pt) {return [pt[0], "10%"];},},title: {left: "center",text: this.table_title,},toolbox: {feature: {dataZoom: {yAxisIndex: "none",},restore: {},saveAsImage: {},},},xAxis: {type: "category",boundaryGap: false,data: data_xAxis,},yAxis: {type: "value",boundaryGap: [0, "100%"],},dataZoom: [{type: "inside",start: 0,end: 10,},{start: 0,end: 10,},],series: [{name: this.table_title,type: "line",symbol: "none",sampling: "lttb",itemStyle: {color: "rgb(135,206,235)",},areaStyle: {color: new this.echarts.graphic.LinearGradient(0, 0, 0, 1, [{offset: 0,color: "rgb(135,206,250)",},{offset: 1,color: "rgb(135,206,235)",},]),},data: data_yAxis,},],};//5.将配置项设置给echarts实例对象,使用刚指定的配置项和数据显示图表。myChart.setOption(option);},// 查询数据queryData(row) {var url = "http://localhost:9001/stock/querinfo2023/" + row.code;this.table_title = row.code + " " + row.name;ElMessage("开始查询 " + row.name + " 的数据");axios.get(url).then((response) => {this.stock_data = response.data;console.log(response);this.loading = false;ElMessage({message: "查询 " + row.name + " 的数据成功",type: "success",});// 绘制数据this.create_axis();}).catch((error) => {console.log(error);this.loading = false;ElMessage.error("查询 " + row.name + " 的数据失败");});},formatter(row) {return row.rise + "%";},},
};
</script><style scoped>
.card-header {display: flex;justify-content: space-between;align-items: center;
}
.container {display: grid;grid-template-columns: 35% 65%;width: 100%;height: 80vh;
}
.left-grid {background-color: #f0f0f0;border-radius: 2%;padding: 10px;height: 95%;
}
.right-grid {background-color: #f9ecc3;border-radius: 2%;padding: 10px;height: 650px;
}
</style>
数据分析
介绍完代码后,我们来看一下数据分析的结果,首先是涨幅排行榜

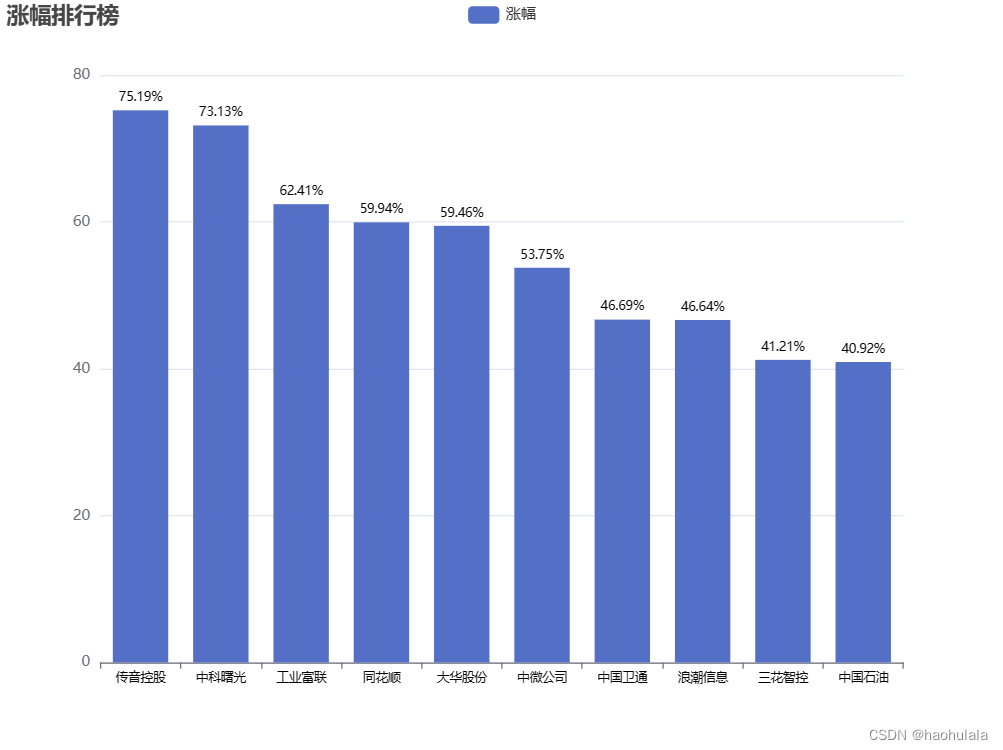
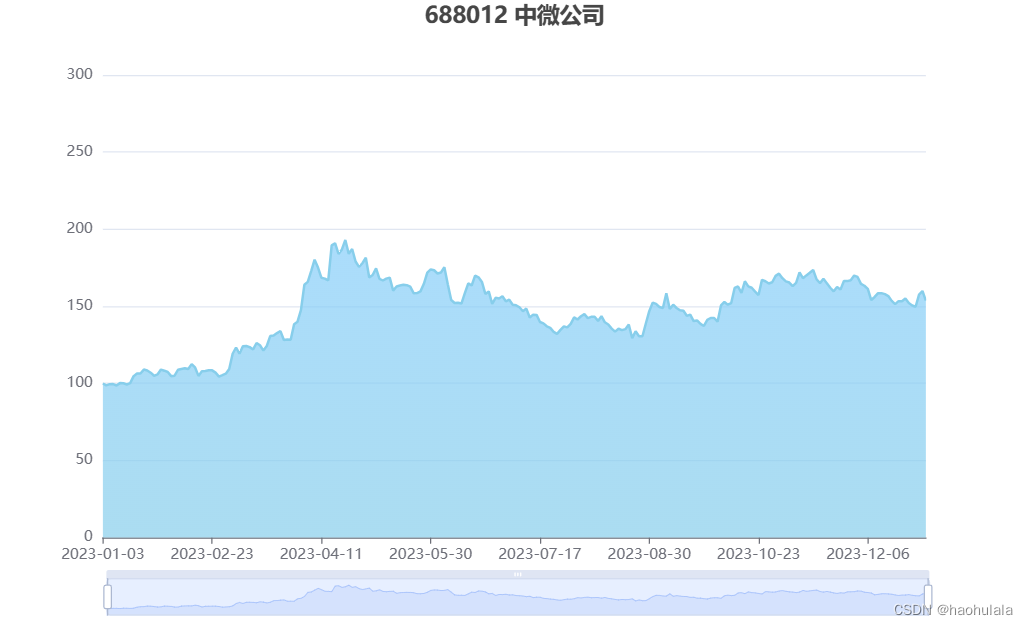
下面是排行榜上10只股票的走势图(顺序是根据文件名排的)


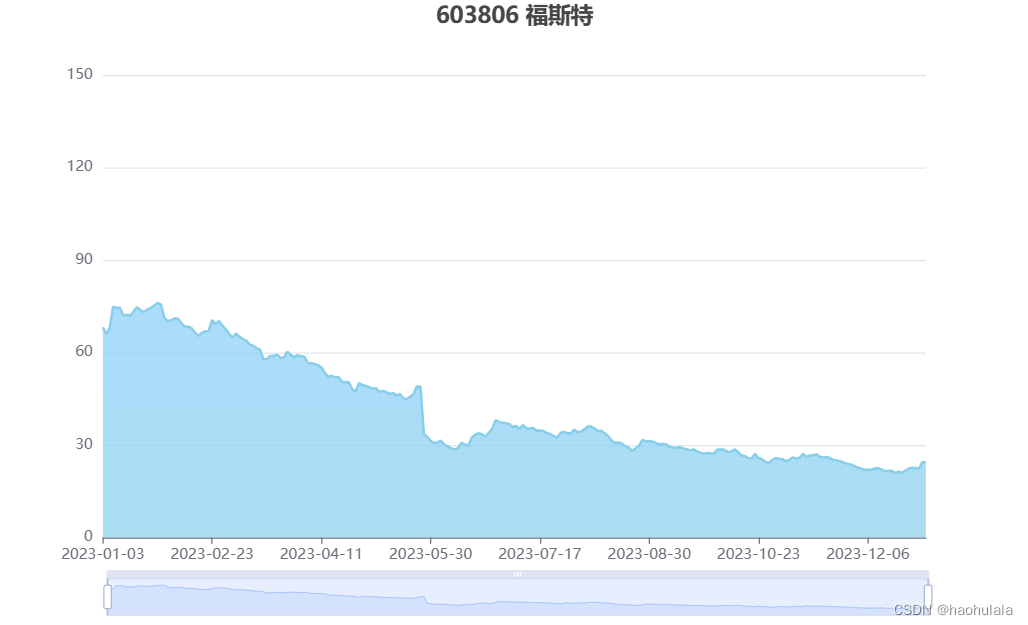
接着是跌幅排行榜


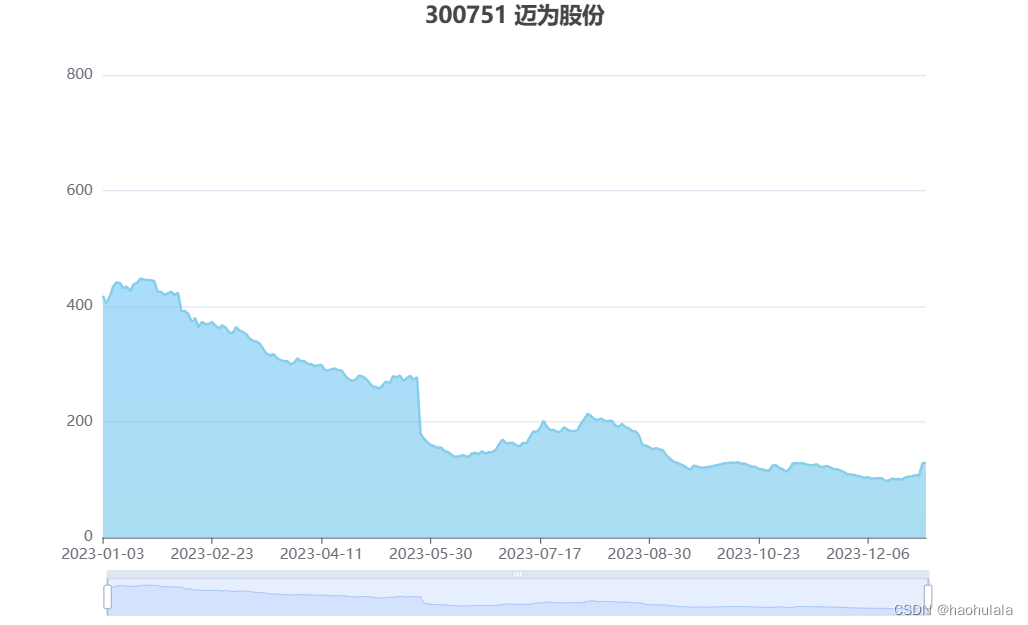
下面是排行榜上10只股票的走势图(顺序是根据文件名排的)


结语
本文介绍了获取计算涨跌排行榜的方法,以及进行涨幅排行榜前10名和跌幅排行榜前10名的股票数据展示,希望对你有所帮助。
这篇关于【金融数据分析】计算2023年沪深300成分股涨跌排行榜的文章就介绍到这儿,希望我们推荐的文章对编程师们有所帮助!


