本文主要是介绍uniapp H5项目使用ucharts的Echart组件方式创建圆环,希望对大家解决编程问题提供一定的参考价值,需要的开发者们随着小编来一起学习吧!
问题:没有报错但是图表不出来
【 调试了半天圆环图表没有不出来。是因为没有明示设置宽度与高度】
/* 请根据实际需求修改父元素尺寸,组件自动识别宽高 */
.charts-box {
width: 100%;
height: 300px;
}
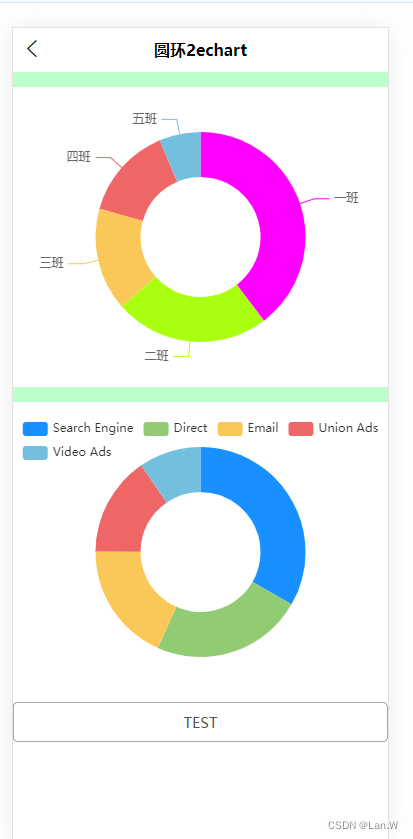
最终效果

先导入ucharts到项目
uniapp的项目导入参考: uniapp 导入ucharts图表插件 H5项目, 使用echarts eopts配置-CSDN博客
导入之后创建下面的ringEchart.vue
源码:
<template><view className="charts-box"><u-gap height="30" bg-color="#bfc"></u-gap><view class="charts-box"><!-- 演示动态改变eopts --><qiun-data-charts type="ring" :opts="{legend:{position:'bottom'}}" :eopts="ringOpts" :chartData="chartsDataPie2":echartsH5="true" :echartsApp="true"/></view><u-gap height="30" bg-color="#bfc"></u-gap><view class="charts-box"><qiun-data-charts type="ring" :chartData="Ring2" :echartsH5="true" :echartsApp="true"background="none" :eopts="eopts2"/></view><u-button @click="resetData">TEST</u-button></view>
</template><script>
import UGap from "@/uview-ui/components/u-gap/u-gap.vue";
import UButton from "@/uview-ui/components/u-button/u-button.vue";export default {components: {UButton, UGap},data() {return {ringOpts: {color: ['#FF00FF', '#AAFF11'],legend: {show: false}},chartsDataPie2: {},eopts2: {tooltip: {trigger: 'item'},extra: {pie: {offsetAngle: -45,ringWidth: 100,labelWidth: 15}},legend: {top: '5%',left: 'center'}},Ring2: {series: [{name: 'Access From',// type: 'pie',radius: ['40%', '70%'],avoidLabelOverlap: false,label: {show: false,position: 'center'},emphasis: {label: {show: true,fontSize: 40,fontWeight: 'bold'}},labelLine: {show: false},data: [{value: 1048, name: 'Search Engine'},{value: 735, name: 'Direct'},{value: 580, name: 'Email'},{value: 484, name: 'Union Ads'},{value: 300, name: 'Video Ads'}]}]},};},onLoad() {console.log('|--onLoad')},onReady() {setTimeout(() => {//1. 获取数据this.getServerData();}, 1000);},mounted() {console.log('|--mounted')this.getServerData();},methods: {resetData() {this.Ring2 = {series: [{name: 'Access From',// type: 'pie',radius: ['40%', '70%'],avoidLabelOverlap: false,label: {show: false,position: 'center'},emphasis: {label: {show: true,fontSize: 40,fontWeight: 'bold'}},labelLine: {show: false},data: [{value: 1048, name: 'Search Engine'},{value: 735, name: 'Direct'},{value: 580, name: 'Email'},{value: 484, name: 'Union Ads'},{value: 300, name: 'Video Ads'}]}]}this.eopts2.series = this.Ring2console.log(this.Ring2)},getServerData() {//模拟从服务器获取数据时的延时let PieA = {"series": [{"data": [{"name": "一班","value": 50}, {"name": "二班","value": 30}, {"name": "三班","value": 20}, {"name": "四班","value": 18}, {"name": "五班","value": 8}]}]}// this.chartsDataPie2 = JSON.parse(JSON.stringify(PieA))this.chartsDataPie2 = {  "series": [{"data": [{"name": "一班","value": 50}, {"name": "二班","value": 30}, {"name": "三班","value": 20}, {"name": "四班","value": 18}, {"name": "五班","value": 8}]}]}},}
};
</script><style scoped>
/* 请根据实际需求修改父元素尺寸,组件自动识别宽高 */
.charts-box {width: 100%;height: 300px;
}
</style>
这篇关于uniapp H5项目使用ucharts的Echart组件方式创建圆环的文章就介绍到这儿,希望我们推荐的文章对编程师们有所帮助!


