本文主要是介绍【Flutter】graphic图表的快速上手,希望对大家解决编程问题提供一定的参考价值,需要的开发者们随着小编来一起学习吧!
简介
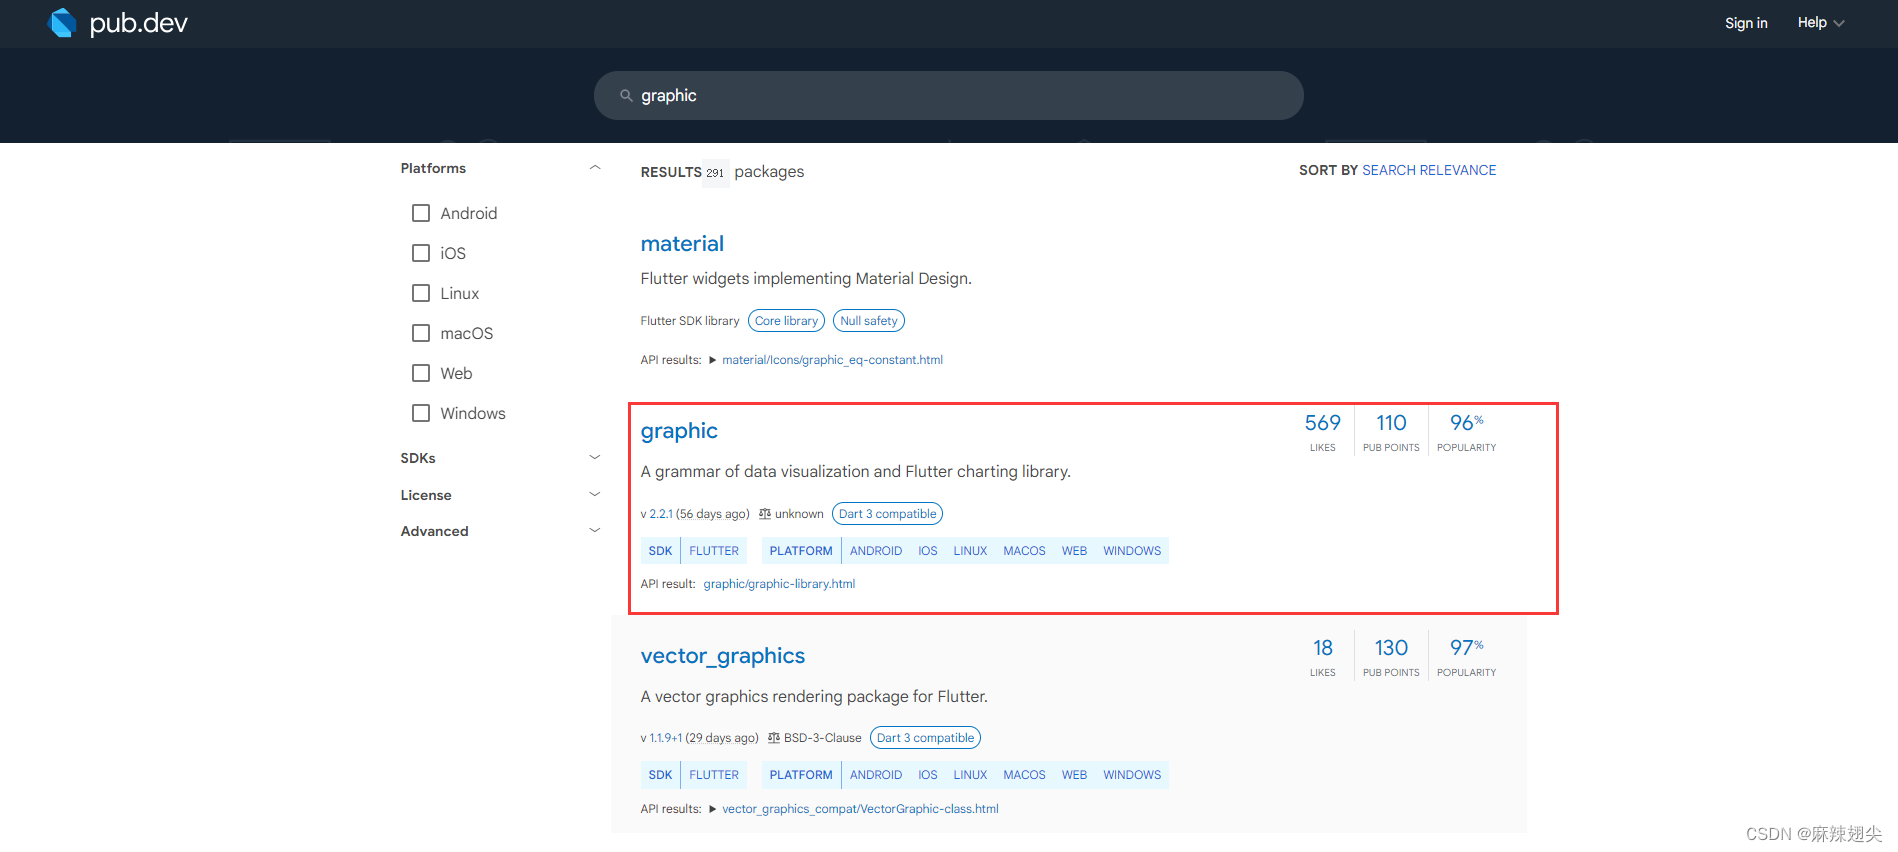
graphic是一个数据可视化语法和Flutter图表库。

官方github示例
网上可用资源很少,只有作者的几篇文章,并且没有特别详细的文档,使用的话还是需要一定的时间去调研,在此简单记录。
示例
以折线图为例(因为我只用到了折线图,但其他的图大差不差)
创建一个两个文件:linePage.dart和数据文件data.dart
创建main.dart,引入linePage.dart
// main.dart
import 'package:flutter/material.dart';
import './linePage.dart';void main() => runApp(const MyApp());class MyApp extends StatelessWidget {const MyApp({super.key});@overrideWidget build(BuildContext context) {return MaterialApp(title: 'Flutter Graphic Example',debugShowCheckedModeBanner: false,home: Scaffold(appBar: AppBar(title: const Text('Flutter Graphic Example'),),body: linePage(),));}
}
// linePage.dart
import 'package:flutter/gestures.dart';
import 'package:flutter/material.dart';
import 'package:graphic/graphic.dart';
import 'package:intl/intl.dart';import './data.dart';class linePage extends StatelessWidget {linePage({super.key});final GlobalKey<ScaffoldState> _scaffoldKey = GlobalKey<ScaffoldState>();@overrideWidget build(BuildContext context) {return SingleChildScrollView(child: Center(child: Column(children: <Widget>[Container(padding: const EdgeInsets.fromLTRB(20, 40, 20, 5),child: const Text('Smooth Line and Area chart', //单线style: TextStyle(fontSize: 20),),),Container(margin: const EdgeInsets.only(top: 10),width: 350,height: 300,child: Chart(// 数据源data: invalidData,// 变量配置variables: {'date': Variable(accessor: (Map map) => map['date'] as String,scale: OrdinalScale(tickCount: 5, // x轴刻度数量),),'points': Variable(// 数据值accessor: (Map map) => (map['points'] ?? double.nan) as num,),},marks: [// 线条与X轴之间区域填充AreaMark(shape: ShapeEncode(value:BasicAreaShape(smooth: true), // smooth: true 使线条变得平滑),color: ColorEncode(value: Colors.pink.withAlpha(80),),),// 线条LineMark(shape: ShapeEncode(value: BasicLineShape(smooth: true),),// 粗细size: SizeEncode(value: 1.5),),],// 坐标轴配置axes: [Defaults.horizontalAxis,Defaults.verticalAxis,],/** 选项配置* 可以写多个,提供给tooltip单独配置selections:{‘touchMove’}选择* 或者marks中LineMark的color属性的updaters*/selections: {// 'touchMove'名称随意起,一般与是功能性描述词'touchMove': PointSelection(on: { //on里面配置操作选项GestureType.scaleUpdate, // 可垂直或水平移动准线GestureType.tapDown, // 点击GestureType.longPressMoveUpdate //长按拖动},dim: Dim.x,)},// 触摸弹框提示tooltip: TooltipGuide(//未单独配置 selections,默认使用上面的selections中配置// 跟随鼠标位置(感觉主要是看第二项是true,tooltip框才会跟随,false会随着鼠标移动乱动)followPointer: [false, true],align: Alignment.topLeft, // tooltip弹框对于点击位置的对齐方式offset: const Offset(-20, -20), // 位置偏移量,结合align),// 十字准线crosshair: CrosshairGuide(followPointer: [false, true]),),),Container(padding: const EdgeInsets.fromLTRB(20, 40, 20, 5),child: const Text('Group interactions', //多线style: TextStyle(fontSize: 20),),),Container(margin: const EdgeInsets.only(top: 10),width: 350,height: 300,child: Chart(data: invalidData1,// 根据给定线条数据的name值相同的为同一条线variables: {'date': Variable(accessor: (Map map) => map['date'] as String,scale: OrdinalScale(tickCount: 5, inflate: true),),'points': Variable(accessor: (Map map) => (map['points'] ?? double.nan) as num,),'name': Variable(accessor: (Map map) => map['name'] as String,),},coord: RectCoord(horizontalRange: [0.1, 0.99]),marks: [LineMark(position:Varset('date') * Varset('points') / Varset('name'),shape: ShapeEncode(value: BasicLineShape(smooth: true)),size: SizeEncode(value: 1.5),color: ColorEncode(variable: 'name',values: Defaults.colors10,// 改变线条颜色// updaters: {// 'groupMouse'是在selections中配置的// 'groupMouse': {false: (color) => color.withAlpha(100)},// // 'groupTouch': {false: (color) => color.withAlpha(100)},// },),),// 显示线条上的数据点// PointMark(// color: ColorEncode(// variable: 'name',// values: Defaults.colors10,// updaters: {// 'groupMouse': {false: (color) => color.withAlpha(100)},// 'groupTouch': {false: (color) => color.withAlpha(100)},// },// ),// ),],axes: [Defaults.horizontalAxis,Defaults.verticalAxis,],// // 提示框选项配置selections: {'666': PointSelection(on: {GestureType.hover, GestureType.tap},// 设备[mouse(鼠标),stylus(手写笔),invertedStylus,trackpad(触控板),touch(触摸屏),unknown]// 参考资料:https://api.flutter.dev/flutter/dart-ui/PointerDeviceKind.htmldevices: {PointerDeviceKind.mouse // 鼠标 (该配置在鼠标设备时生效)},// 显示此处date相同的数据variable: 'date',),'groupMouse': PointSelection(// 触发的交互// 参考资料:https://pub.dev/documentation/keyboard_dismisser/latest/keyboard_dismisser/GestureType.htmlon: {GestureType.hover, // 覆盖},// variable: 'name',devices: {PointerDeviceKind.mouse},),'tooltipTouch': PointSelection(on: {GestureType.scaleUpdate, GestureType.tapDown, //点击GestureType.longPressMoveUpdate },// variable: 'name',devices: {PointerDeviceKind.touch, // 触摸屏(仅在触摸设备生效:神奇的是不包括iOS)},),'tooltipTouchIos': PointSelection(on: {GestureType.scaleUpdate,GestureType.tapDown,GestureType.longPressMoveUpdate},// variable: 'name',devices: {// 未知设备(不明白为啥iOS被识别成了unknown,猜测可能与ios中的触摸事件有关)PointerDeviceKind.unknown, },),},tooltip: TooltipGuide(// 选择触发配置selections: {'tooltipTouch', '666'},followPointer: [false, true],align: Alignment.topLeft,// tooltip中显示的内容(按顺序显示)// 与上方selections中定义的variable相排斥variables: [// 'date','name','points',],),// 十字准线配置crosshair: CrosshairGuide(selections: {'tooltipTouch', '666'},styles: [PaintStyle(strokeColor: const Color.fromARGB(255, 92, 68, 68)),PaintStyle(strokeColor: const Color.fromARGB(0, 158, 154, 154)),],followPointer: [false, true],),),),],),),);}
}数据文件
// data.dart
const invalidData1 = [{"date": "2016-01-04", "name": "线条1", "points": 126.12},{"date": "2016-01-05", "name": "线条1", "points": 125.688},{"date": "2016-01-06", "name": "线条1", "points": 119.704},{"date": "2016-01-07", "name": "线条1", "points": 120.19},{"date": "2016-01-08", "name": "线条1", "points": 121.157},{"date": "2016-01-11", "name": "线条1", "points": 117},{"date": "2016-01-12", "name": "线条1", "points": 120},{"date": "2016-01-13", "name": "线条1", "points": 122},{"date": "2016-01-14", "name": "线条1", "points": 117.76},{"date": "2016-01-15", "name": "线条1", "points": 114.397},{"date": "2016-01-18", "name": "线条1", "points": 116.373},{"date": "2016-01-19", "name": "线条1", "points": 120.547},{"date": "2016-01-20", "name": "线条1", "points": 113.733},{"date": "2016-01-21", "name": "线条1", "points": 114.098},{"date": "2016-01-22", "name": "线条1", "points": 123.833},{"date": "2016-01-25", "name": "线条1", "points": 125},{"date": "2016-01-26", "name": "线条1", "points": 124.866},{"date": "2016-01-27", "name": "线条1", "points": 120.264},{"date": "2016-01-28", "name": "线条1", "points": 122.296},{"date": "2016-01-29", "name": "线条1", "points": 124.502},{"date": "2016-02-01", "name": "线条1", "points": 127.936},{"date": "2016-02-02", "name": "线条1", "points": null},{"date": "2016-02-03", "name": "线条1", "points": 129.95},{"date": "2016-02-04", "name": "线条1", "points": 129.275},{"date": "2016-02-05"
这篇关于【Flutter】graphic图表的快速上手的文章就介绍到这儿,希望我们推荐的文章对编程师们有所帮助!


